Writers block—that is what sometimes happens when you look for that catchy phrase to start off your blog.
But this information is not about being clever. This is about statistics, about facts, about numbers you should know when someone asks you “So, How is the market doing?”
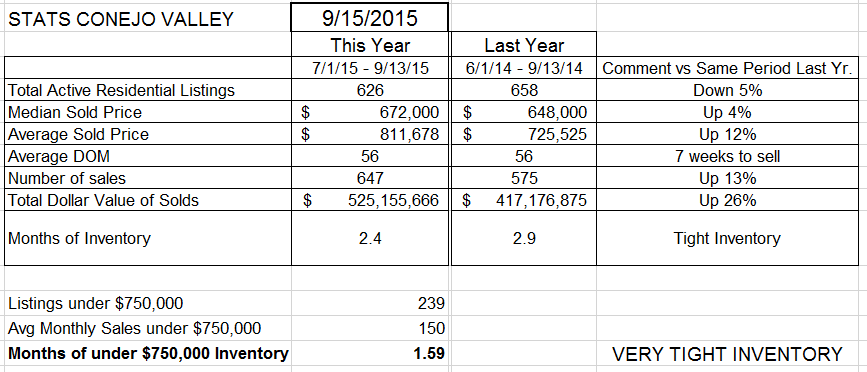
For this edition, I will highlight only two “pictures” of information, one for each valley area.
From the data above, this is what I would say in answer to the question “So, How is the market doing?”
The market has been very active this year, with 13% more sales than the previous year. Prices are up (take your choice here) about 7%. The median sold price in the Conejo Valley is now approaching $700,000. With inventory down 5% from last year, and sales up 13%, the inventory is extremely tight, representing only about 10 weeks of sales, and only 5 weeks worth of sales for homes in the lower price ranges. We see continued strength in the market, and in prices.
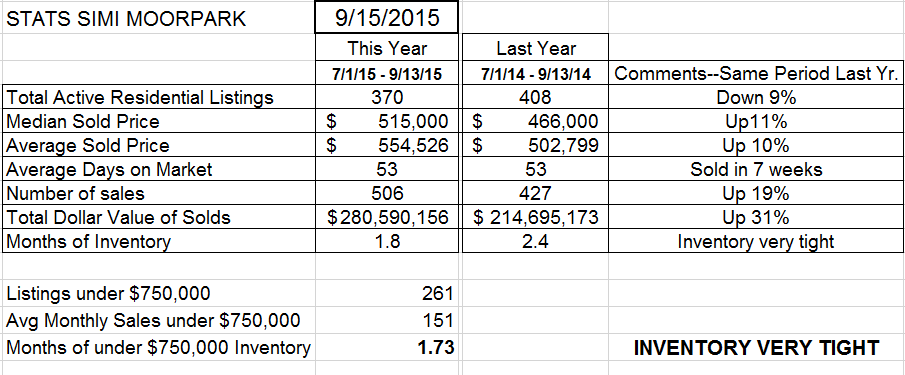
Now for Simi Valley and Moorpark
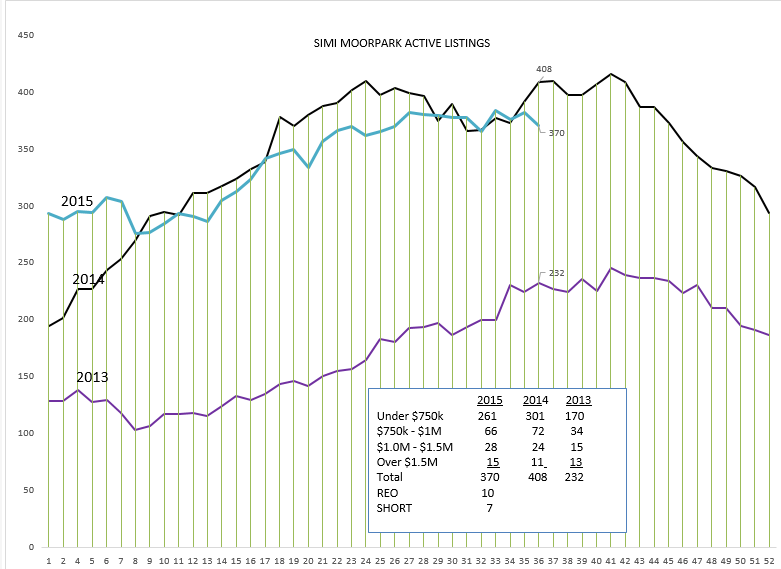
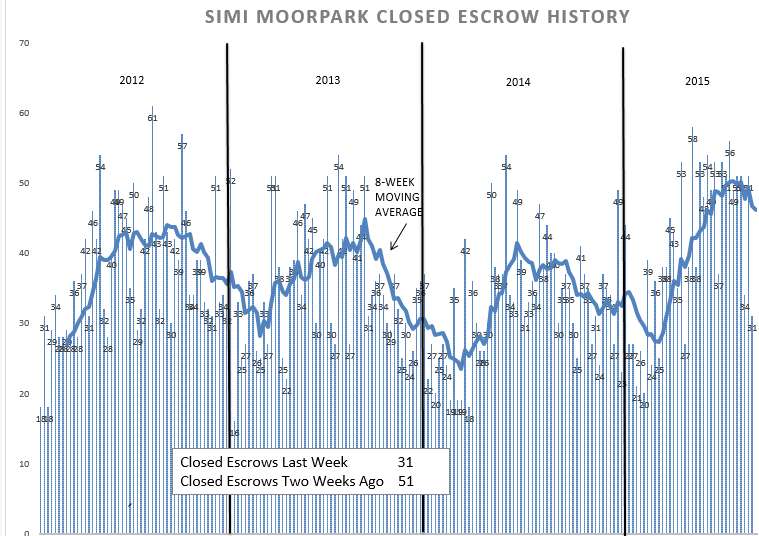
The market has been extremely active this year, with 20% more sales than the previous year. Prices are up about 10%. The median sold price in Simi/Moorpark is now over $500,000. With inventory down almost 10% from last year, and sales up almost 20%, the inventory is extremely tight, representing only about 7 weeks worth of sales. We see continued strength in the market, and in prices.
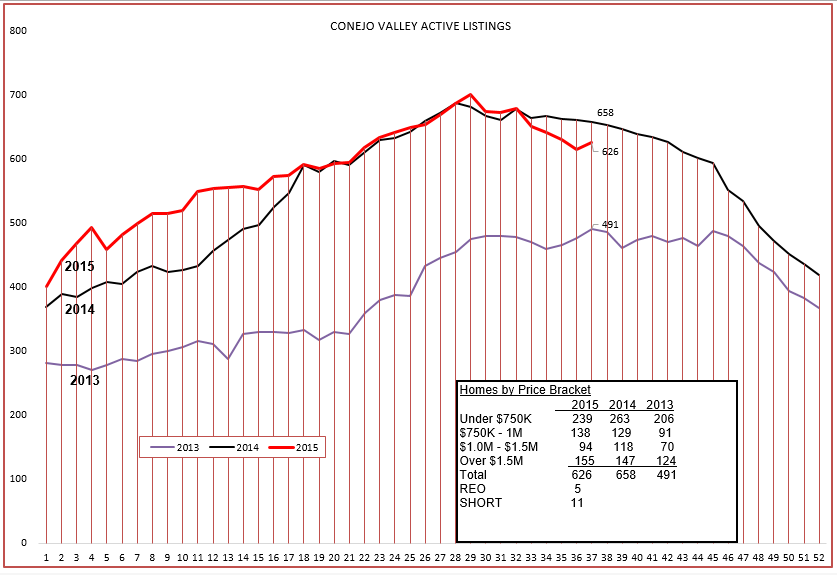
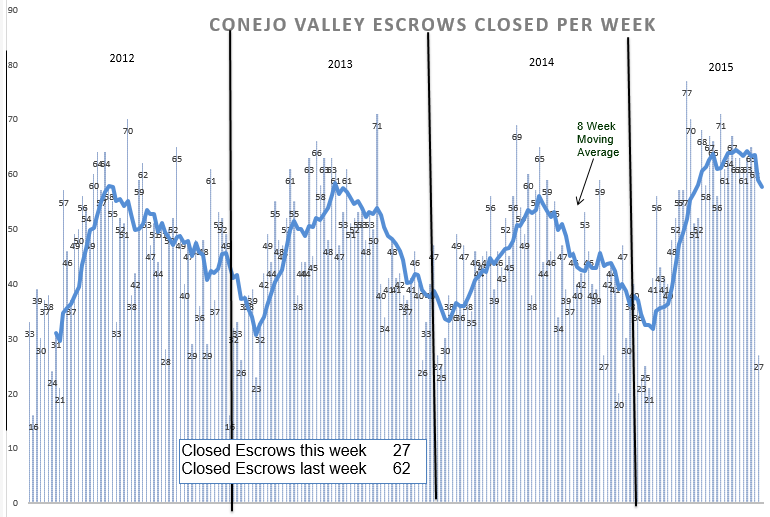
Below, without comment this time, are the charts and numbers of inventory and closed escrows.
Why are the escrow numbers so low from last week? Labor Day holiday, only 4 days in the week.
Chuck
