Forecast: There will be rain, and lots of it. But here it is March, and we are waiting for the deluge.
Forecast: There will be home sales, and lots of them. But February was not yet the deluge we have expected. At least not in the Conejo Valley. All real estate is local.
Today the jobs report came out, and the US economy added many more jobs than expected last month. Non-farm payrolls grew by 242,000, whereas economists had estimated a gain of 195,000. The unemployment rate held steady at 4.9%, an eight-year low, as expected. And average hourly earnings rose 2.2% year-on-year. A very strong report.
We also got upward revisions to job gains posted during the prior two months, with 30,000 more jobs added to the original announcements for December and January.
A very good report on jobs. A report for the entire country. Not a local report. A recession is when your neighbor loses their job. A depression is when you lose your job. All real estate is local.
I have been comparing the past three months, for this report December through February, this year versus last year. Leslie Appleton-Young made a presentation to our local Women’s Council of Realtors this week, and mentioned that home prices tend to drop at the end of the year, along with volume, and rise in the Spring. Good information for your clients, they often ask when is the best time to list their home.
Let’s see how that premise is working for the Conejo Valley, and for Simi Valley and Moorpark.
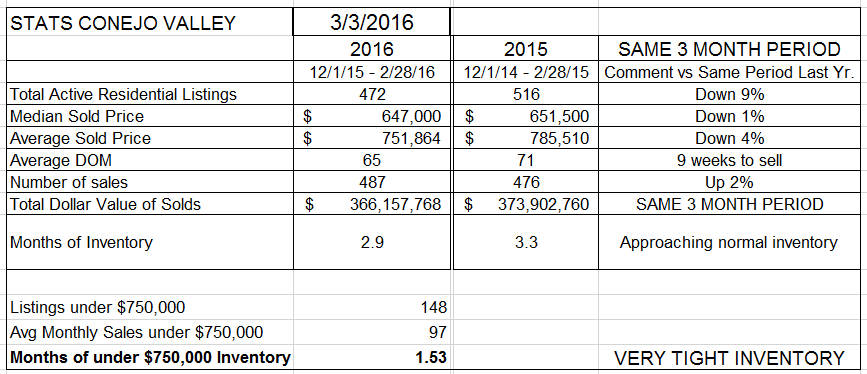
Inventory is down, by 9%. Supply and Demand theory says that puts upward pressure on prices. The number of sales are up, by 2%. Supply and Demand theory says that puts upward pressure on prices. There are many reports of multiple offer situations, particularly in the lower price ranges. So how are prices doing? Median prices are down 1%, Average prices are down 4%. I ran them twice, the figures are correct. And this trend has continued for a couple of months. The larger drop in Average prices indicates fewer higher priced properties were sold. Over the last three years, the number of million dollar homes sold has been averaging 18-19% of the total. Right now they are at 14%. Still selling, still doing well, but the really hot price ranges are $700,000-900,000, and the entry level homes around $500,000-600,000.
I am calling inventory normal as we get closer to 4 months worth of inventory. The rest of the country points to 6 months worth of inventory as a balanced market, but I believe our coastal communities are more active. If you want an entry level home, be prepared for multiple offers due to the very low inventory. Lots of demand here, not enough inventory. And given the price history, homes may be a bargain.
Simi Valley/Moorpark paints a different picture.
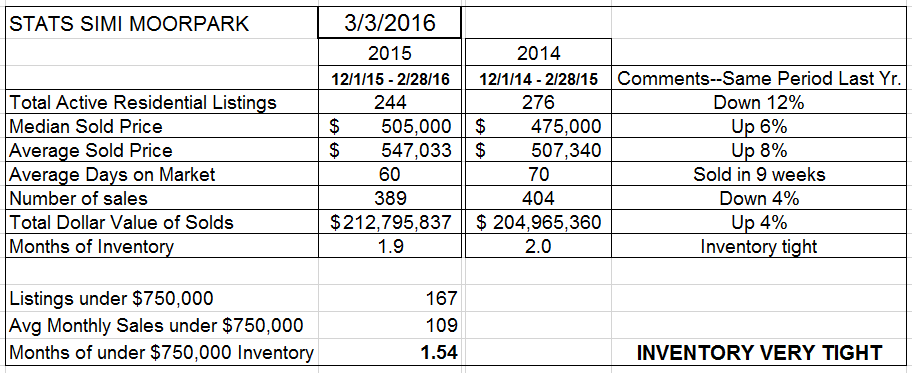
Inventory, down 12%. Prices, up 6% and 8%. But the number of homes sold is down 4%, most likely due to the lack of inventory. Multiple offers, strong pricing pressure, a strong market.
Let’s look at the two components of inventory and sales volume. First, Conejo Valley.
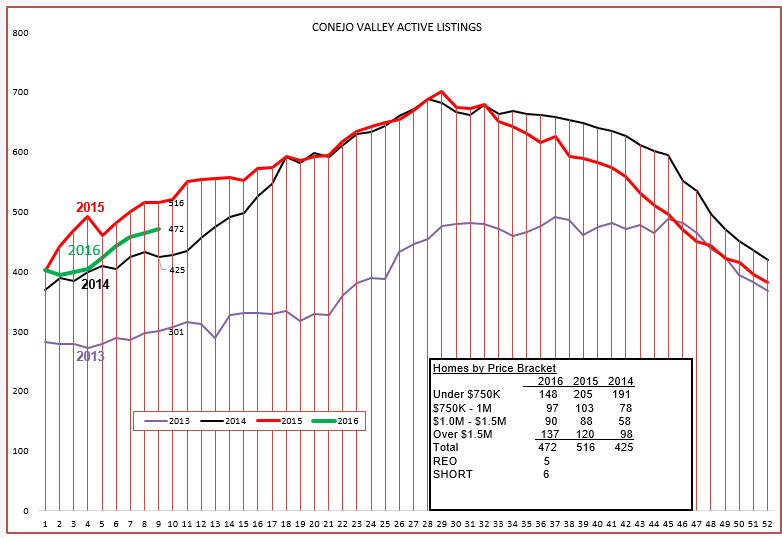
Inventory overall is a happy medium, growing as expected and sandwiched between the experience of 2014 and 2015. Look at the box within the chart, and compare the different price categories. The high priced range inventory is growing, the lowest price range is desperate for more inventory to fill demand. This is not the low inventory scenario that resulted in strong price increases across the board, but indicates pricing softness in the highest range and pricing strength in the lowest range.
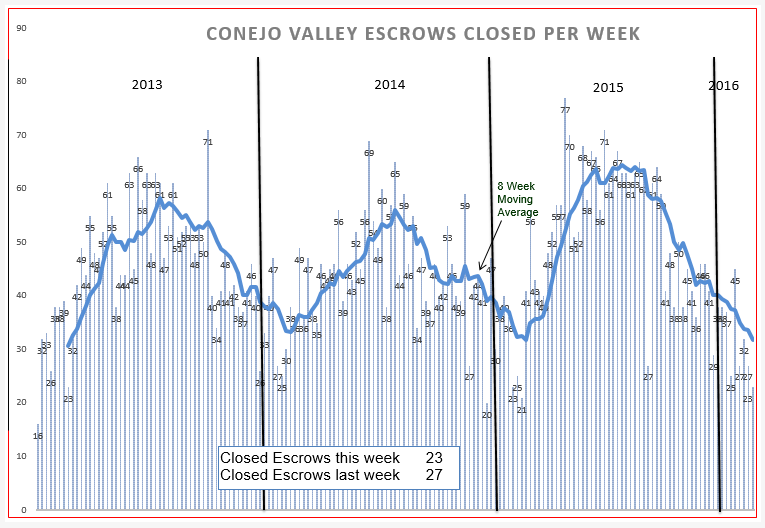
The weekly closed escrows chart shows the sales strength in 2015, and the 8-week moving average is awaiting the usual turnaround we hope for at this time of year. If you think of our local economy as a four-cylinder engine, with the cylinders being the above price ranges, the engine is currently not hitting on all cylinders. I think we will turn the corner, but the rise to compete with 2015 is going to be more difficult.
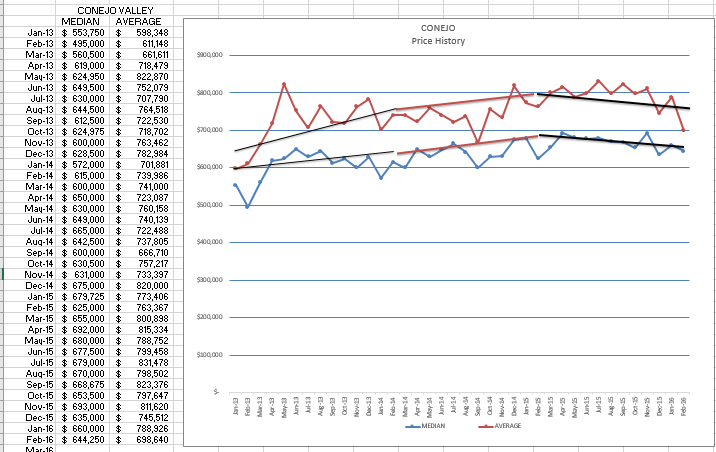
Prices on this chart show the median and average prices for each particular month. As you can see, there is wide variation month-to-month, but overall the trend is down. Look at the actual prices reported in the columns, and you can see the struggle going on. Prices are safe, but nothing to get wildly optimistic about. But remember, all real estate is local. Can you tell your clients that the price of their home has gone down or up? This graph is not targeted enough to make that call, you need to do more research into their particular neighborhood, their particular price range, and how many homes they might compete with. All real estate is local.
How does that compare to Simi/Moorpark?
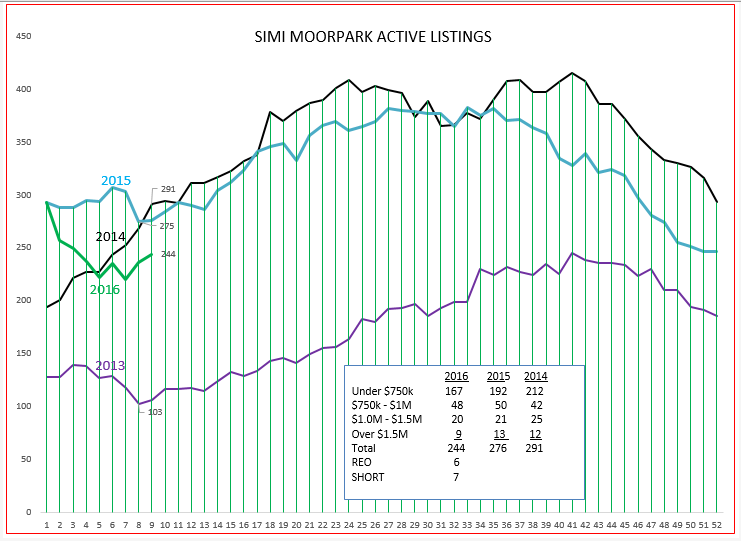
The graph is a little confused for the beginning of the year. It looks as if things are returning to normal, climbing as spring approaches. Again, look at the information in the box. Inventory is lower across the board. Not as low as 2013, but enough to provide strong upward pricing pressure. Now let’s look at how sales are doing in Simi/Moorpark.
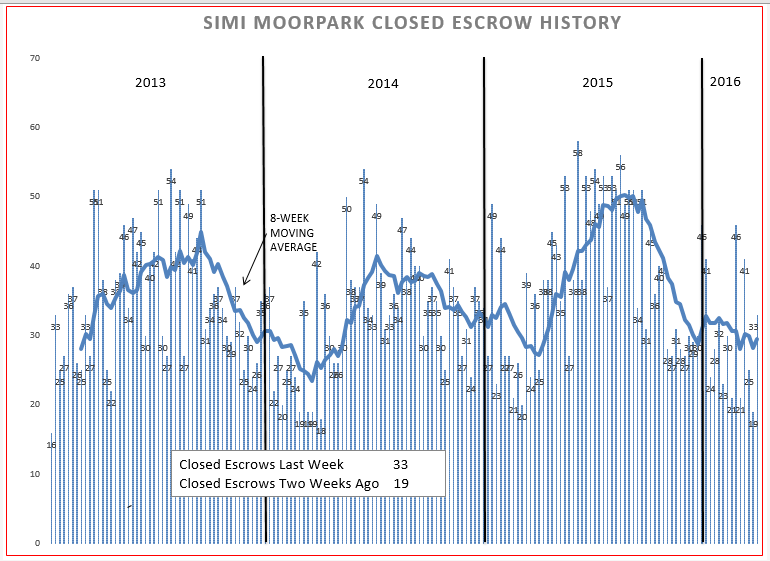
Again we can visually see the strength of 2015 sales. The dip in the number of sales has not dropped as low as 2014, is about the same strength as 2015, and although not consistent week-to-week, sales in Simi/Moorpak are strong. Their home prices are in the area that first time buyers can afford.
Now for the graph of prices.
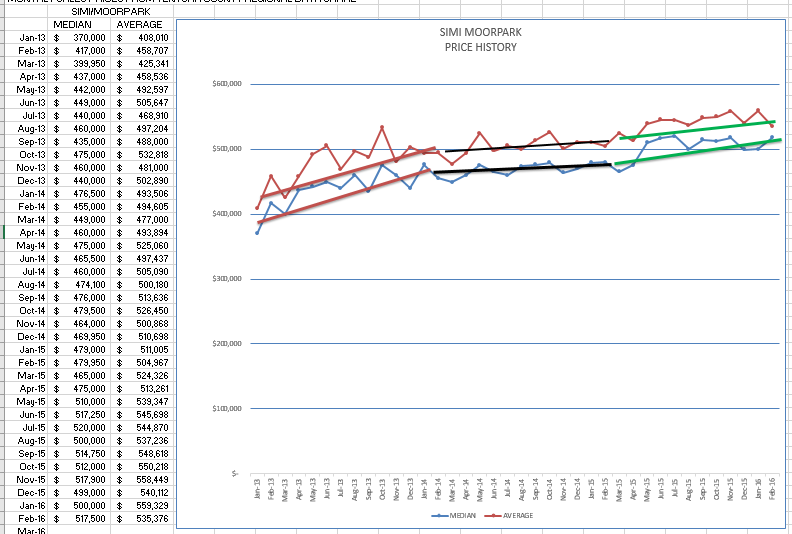
Simi Valley and Moorpark do not have the wide range of home prices that Conejo has, and are much more centered in the $500,000 – $600,000 price range. Look at the numbers in the left column. Due to this strong base range, their price records are more consistent, much less affected by the higher price ranges. A strong market, one very consistent with most of the forecasts for this year.
This is only one man’s opinion. What do you think? Do you agree or disagree? How are things going in your business? How are things in the local area that you deal in? I would love to hear from you.
Have a prosperous year.
Chuck
