The charts of the past, blended with the reality of the present, allow us to make an educated guess on the future. I call the reality of the present the information and feelings I get from my agents. Charts do not tell the whole story.
I usually begin the story with a discussion of inventory. Too little, and we don’t have enough to sell, but that usually makes prices go up. It starts with multiple offers, too many buyers chasing each property. Too much inventory, and properties stay on the market longer, and we see price reductions.
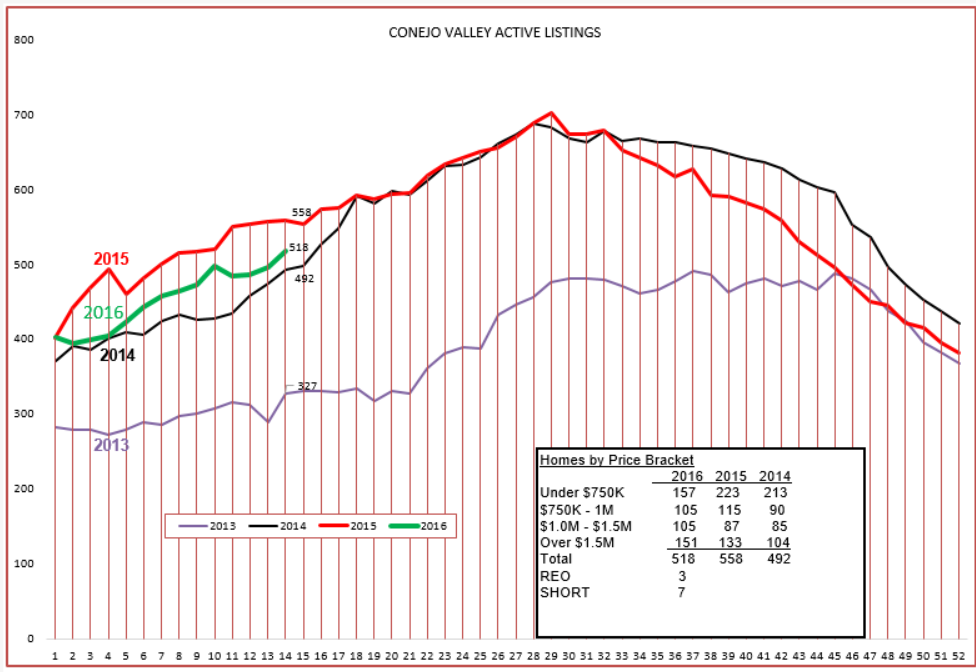
For the Conejo Valley, the inventory is sandwiched right between 2014 and 2015. We had no complaints in those years. We did have low inventory in 2013, and that not only caused prices to increase but also limited the number of homes sold. There were just not enough to go around. According to this chart, inventory is not a problem.
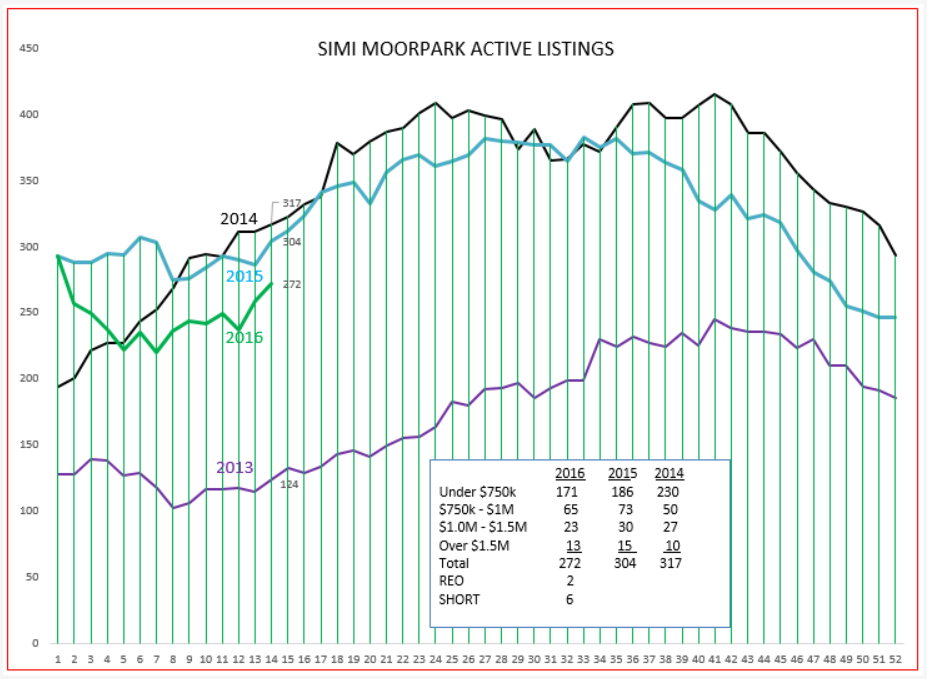
For Simi Valley/Moorpark, inventory is lower than the past two years, although not as low as the extremely low numbers in 2013. At this point, it does look as if the inventory curve wants to follow the normal seasonal curve, and prices and total numbers of sales should not be affected too strongly. Again, not the pressure that we had in 2013.
The other leg of the supply and demand curve is demand, which we measure by the number of closed escrows taking place.
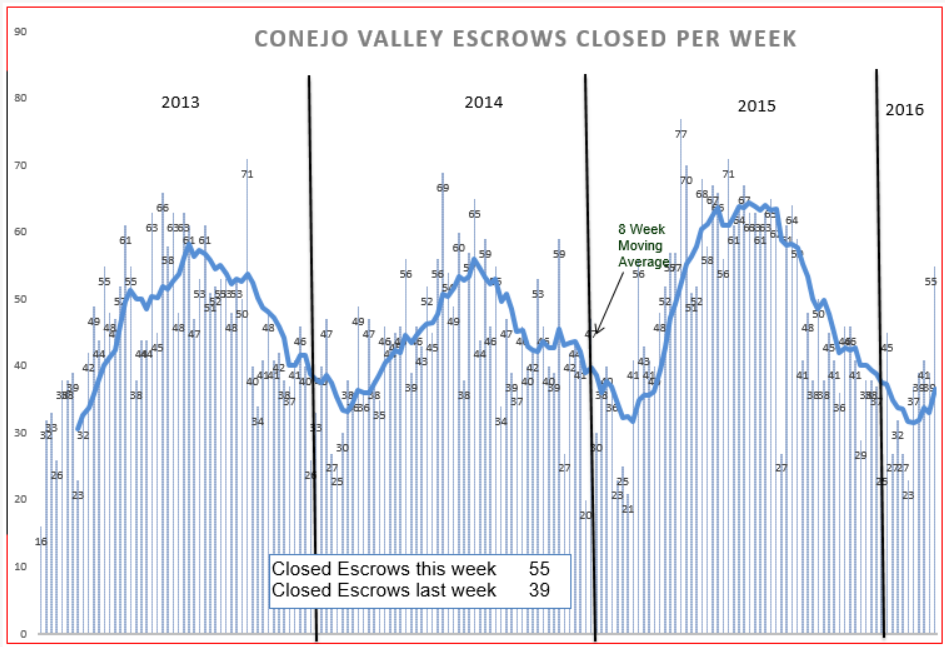
Conejo valley has turned the corner, as expected this time of the year, with a very strong final week in March. We had a fabulous year in 2015, inventory is still available, interest rates remain extremely low, and according to this chart demand is not a major problem, and is proceeding as expected.
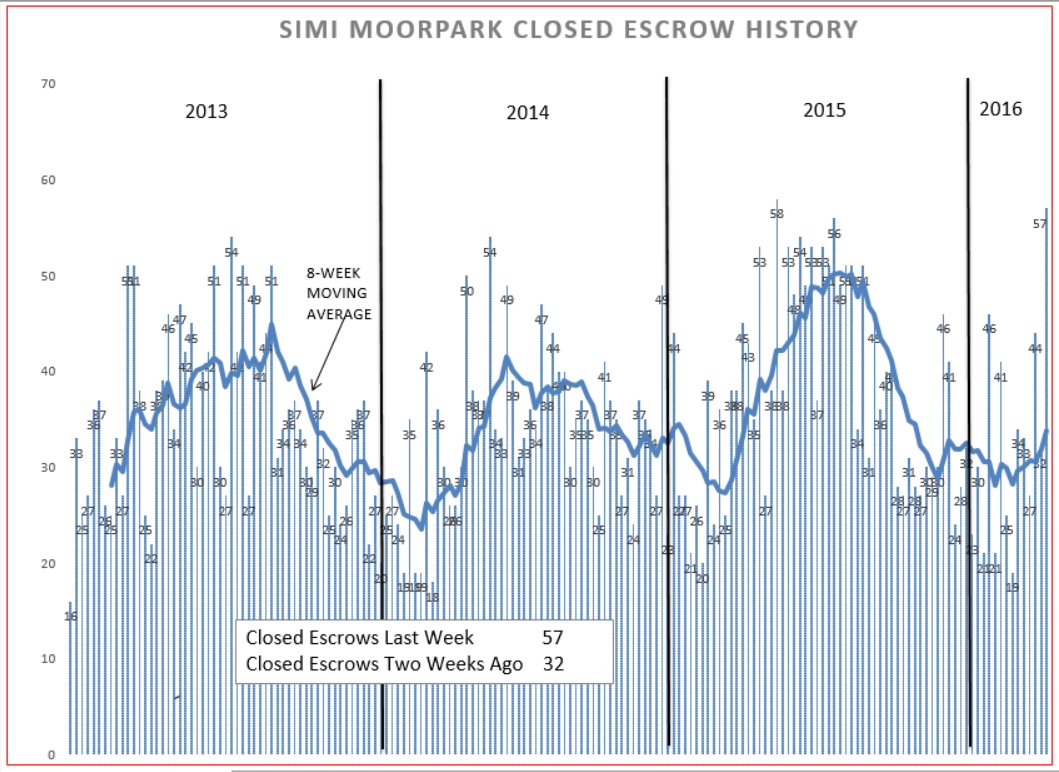
Simi/Moorpark sales remained strong due to the attractiveness of their $500,000 average price range, and it looks as if we may mirror the very strong results achieved in 2015.
Let’s look at the actual numbers now, not just the chart. Remember, the numbers I compare are for three month periods, this year versus the beginning of 2015.
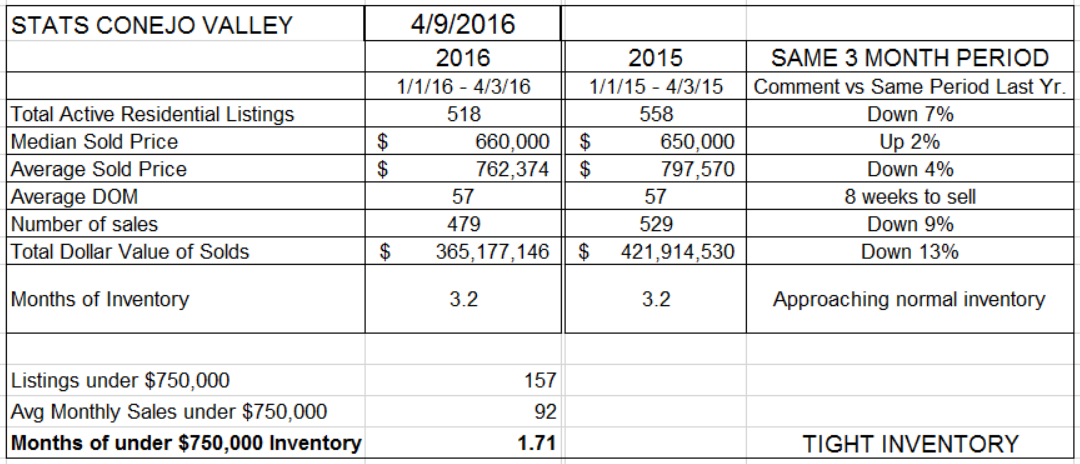
Residential listings are down 7% from 2015, but up from 2014. The Median sold price is up 2%, but the Average is down 4%. That is due to fewer sales in the higher end. Significantly, the number of sales is down 9%, a number to cause all of us to pay attention. Maybe that represents mostly the high end homes, but that becomes significant. I looked up the major brokerages for the first three months of this year versus last year, and dollars are down 15%. Significant. High end homes are selling, but not like they used to.
Months of inventory (as I measure it) is a little over three months, approaching normal inventory for our area. Normal meaning that the market does not favor either the buyer or the seller, it is balanced.
However, for listings under $750,000, there is a much lower inventory, strongly favoring the seller. All real estate is local, and that goes for price ranges as well as geography.
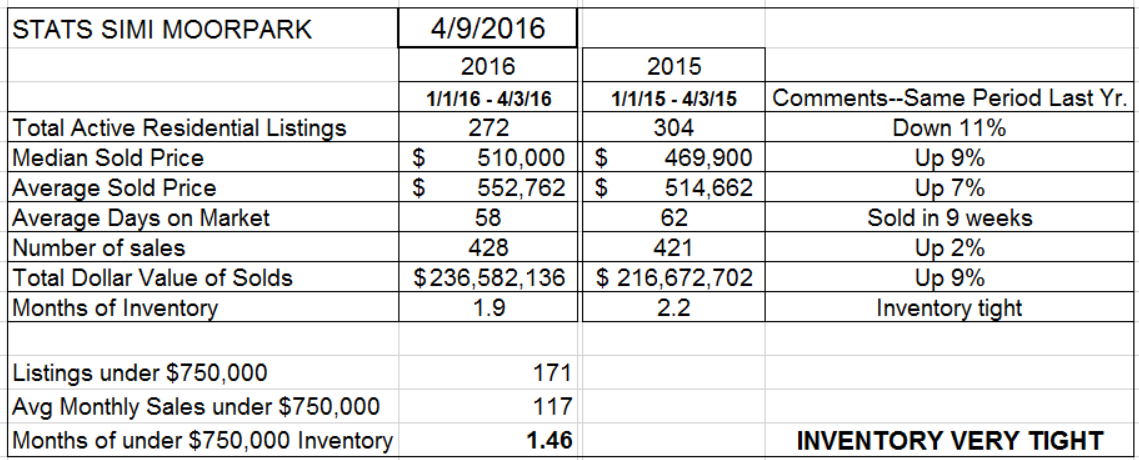
For Simi/Moorpark, the major portion of their inventory is under that $750,000 number, and their months of inventory figure is much lower, less than 6 weeks worth of inventory. The overall months of inventory is not much stronger, as there are a much smaller percentage of homes in the higher cost category.
Finally, let’s see how prices have been affected by the figures above.
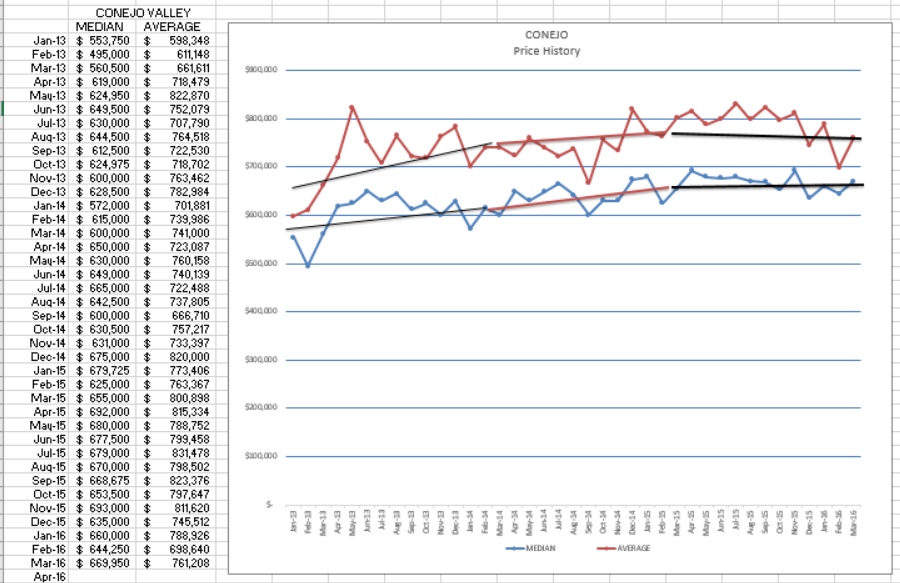
The space between the red Average figure and the blue Median figure has gotten smaller, the two lines closer together. In the Conejo Valley, fewer high priced homes are selling compared to last year. The blue Median figure still shows a reasonable increase (2%) but we are missing the upward pull of the higher priced homes. Still selling, but by comparison fewer than the past couple of years.
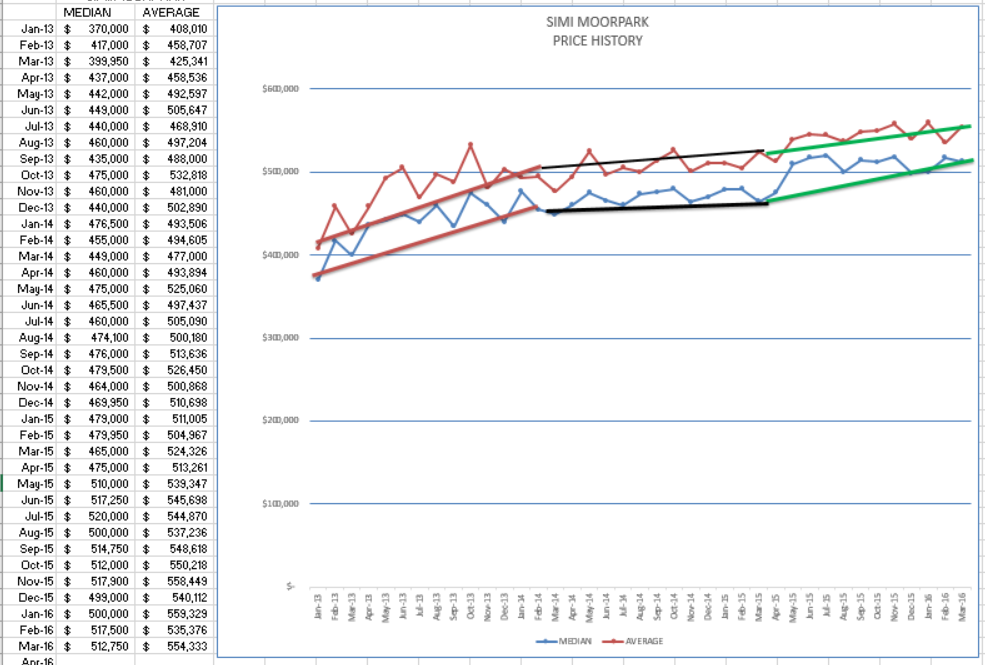
For Simi/Moorpark, both median and average prices are up about 8%, representing stronger price increases than the Conejo Valley. Also, the total number of sales is up 2%. The lower price structure of the Simi/Moorpark areas show stronger demand and are not as influenced as much by high priced homes, therefore the market seems to be stronger.
The “financially troubled properties” numbers for Conejo, Moorpark, and Simi Valley show a grand total of 5 REOs and 13 Short sales. Very little going on with financially troubled properties. We have always had a few, and we will continue to have a few. Thankfully, all of the resets are over.
I recently spent a lot time on an airplane, and actually viewed the movie “The Big Short” twice. It is a little difficult to follow, as there are 4 related stories in the film. I thought I understood what happened, but this movie added a lot of extra information. I strongly recommend seeing it yourself or, even better, reading the book.
So that’s the story we get from the charts, from the past. How about the present? At our weekly business meetings, we are sharing stories of buyers missing out on five homes they bid on, of multiple offers in all price ranges. The market sounds hotter than the past history would lead us to believe.
TRID has not been a problem. We were initially concerned that escrow times would be lengthened, and it turns out that TRID is actually preventing last-minute delays from occurring. All the work and investigation is now done up front, and we are finding out sooner that escrows will close on time rather than experiencing the last minute delays we were used to last year.
Finally, it’s an election year, and an election year is usually good for the economy. We are in a market that is strong, but not necessarily strong in all price “tranches”. (Not sure what that means—see the movie.)
Have a prosperous month.
Chuck
