Am I talking about football or the housing market? Either one. Sometimes the first half is an indicator of the second half, and then again sometimes it is not.
HOME PRICES CONTINUE GAINS IN APRIL ACCORDING TO THE S&P/CASE-SHILLER HOME PRICE INDICES
NEW YORK, June 28, 2016 –S&P Dow Jones Indices today released the latest results for the
S&P/Case-Shiller Home Price Indices, the leading measure of U.S. home prices. Data released today
for April 2016 shows that home prices continued their rise across the country over the last 12 months.
- Twenty-city property values index increased 5.4 percent from April 2015 (matching median forecast) after climbing 5.5 percent in the year through March
- National home-price gauge rose 5 percent from 12 months earlier after 5.1 percent in the year ended in March
- On a monthly basis, seasonally adjusted 20-city measure increased 0.5 percent from March, the smallest gain since September (rounded), after climbing 0.8 percent
At the end of June, Case-Shiller reported on home prices for April. They are very accurate. If you are reporting on something that happened two months ago, you have a lot of time to make sure your figures are accurate.
The people we run into want to know what their home is worth today.
They want to know what they can sell it for if they listed it today. And a lot can happen in two months.
As we find ourselves in August, we see the market peaking and slowing down a bit. Why the switch? Why is it slowing down?
Part of the reason is schools. I remember schools being let out for the summer near the end of June, and we went back to school after Labor Day. My grandkids are going back to school next week, on August 10. They got out at the end of May. There are some schools that still follow the out-in-June back-in-September time frame, but certainly not all. This has moved the peak season, or perhaps spread it out over more months.
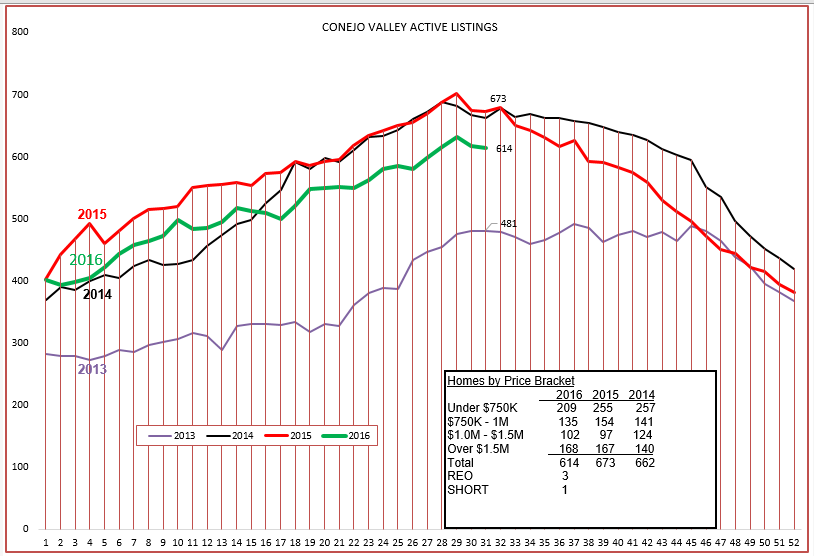
Let’s look at the Conejo Valley first, both inventory and closed escrows. The inventory has peaked, as it usually does this time of the year. That happens when more homes go onto the market than come off the market (are sold). Except for 2013, the big price recovery year where inventory was outrageously low, the past three years are following exactly the same pattern.
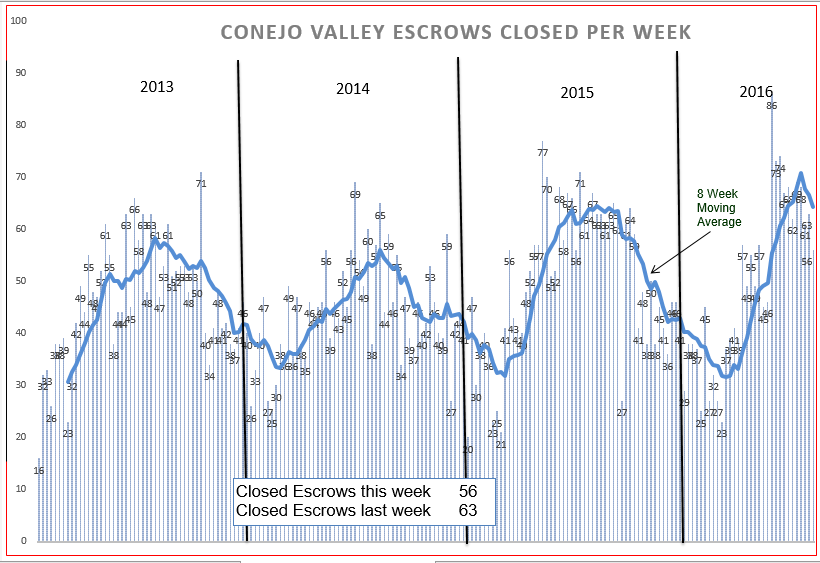
Closed escrows seem to have also peaked. While this chart records escrows when they are closed, actual sales take place roughly two months earlier. Therefore, actual sales activity peaked more than two months ago. Conejo had a weak beginning to the year. It can be seen by comparing the space from the beginning of the year to the rapid rise in sales. However, sales perked up strongly and the peak achieved was higher than the past three years. But the peak has passed, and we are back on track to go a little slower as we go into the second half. Remember we are not going to zero, we are heading toward the probable low of 30-40 closed escrows per week, roughly half the peak, but still a very strong market.
Inventory is controlled by two factors, the spigot that fills the basin and the drain that pulls inventory away. As we see inventory growing, it grows because more homes are coming onto the market than are being sold.
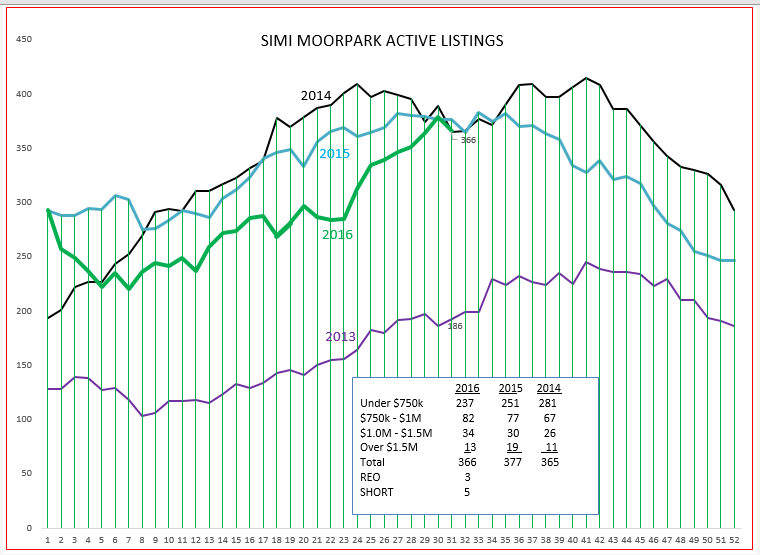
Now let’s look at the same charts for Simi Valley and Moorpark. It looks like they hit their peak inventory, but the path it took was a little different, going down at the beginning of the year instead of climbing. The inventory of short sale and REO listings is only 10 total, for both valleys. These listings are always part of the market, but they continue to be a very small part.
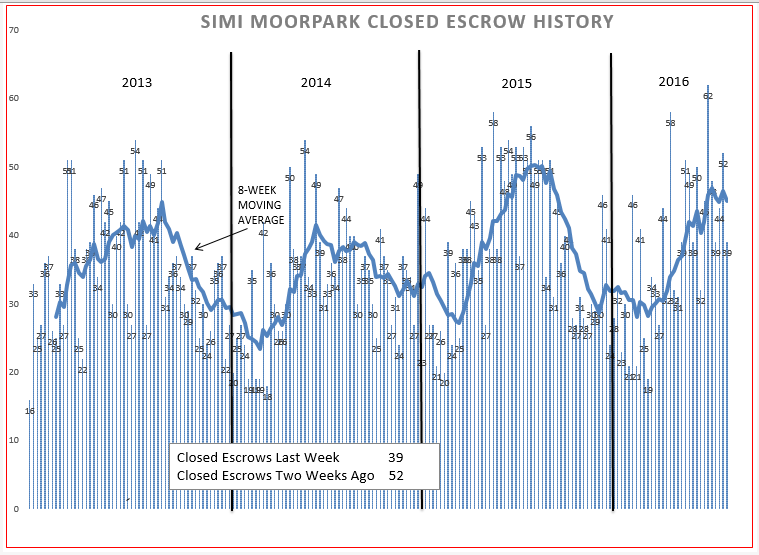
Closed escrows for Simi and Moorpark hovered around 30 per week to begin the year, a strong sales level. Sales are now peaking, not as high as the extremely strong 2015, but still strong compared to other years.
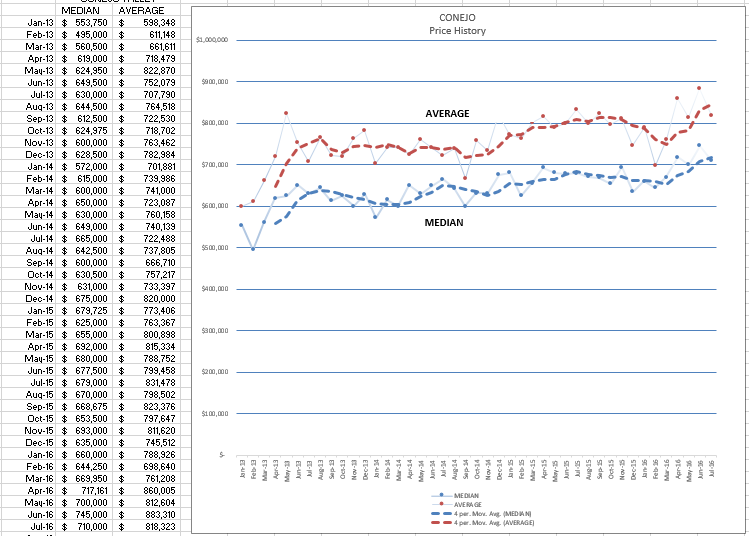
Now let’s see what this does to prices. First, Conejo Valley. Prices as measured every month have a lot of normal fluctuation, so the chart you see represents the 4-month-moving-average, smoothing out the month-to-month inconsistencies. Notice there seems to be seasonality in prices also, similar to the inventory curves.
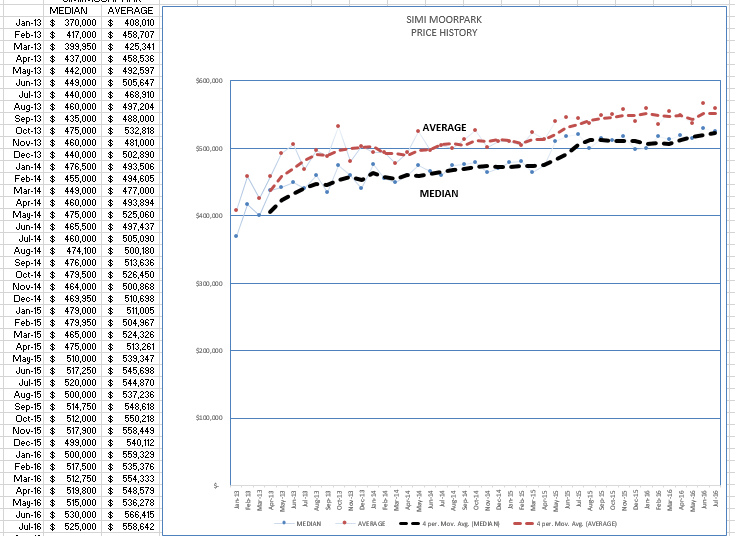
Next we will look at Simi Valley Moorpark. This area does not have the wide range of pricing at the upper end to cause as much variation as does Conejo, but the seasonality is still noticeable.
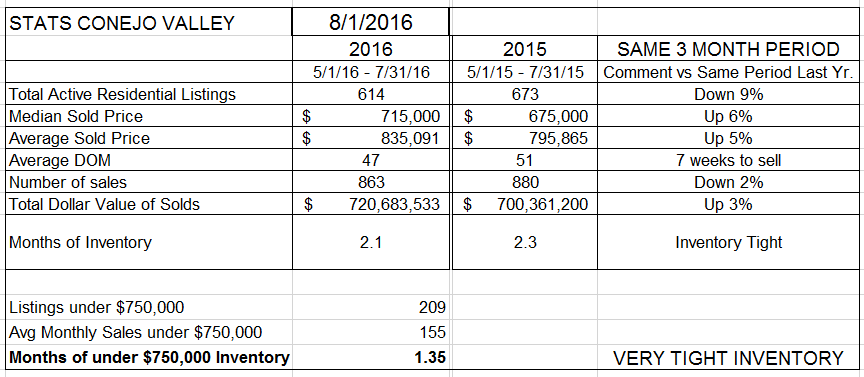
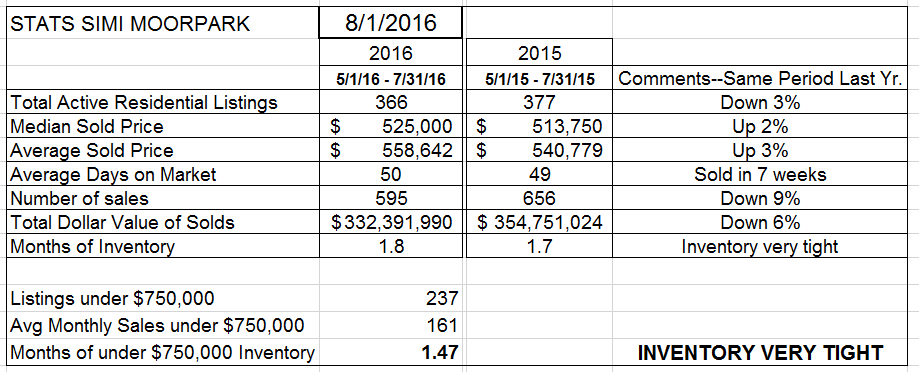
And finally, let’s look at the data summary and see how it compares to the Case-Shiller information from two months ago.
Conejo prices are up 5-6% from a year ago. The number of sales is down 2% from the same three months a year ago, but inventory is down even more at 9%. Inventory remains tight at just over two months worth of sales, but this seems to be the new normal.
For Simi Valley and Moorpark, prices are up only 2-3% more than the same three months last year. The number of sales started out the year very strong, but now is down 9% versus those same three months, while inventory is down only 3%.
All in all, the market continues to be a good market. Prices are up versus last year, but not bubble-scary up. The inventory remains extremely tight, but there seems to be enough to fill buyer needs. Two months inventory is what we are now used to dealing with.
All real estate is local. And all real estate prices are relative to what the market was doing last year. Is that the best comparison? Maybe good enough for Case-Shiller, maybe good enough for an entire valley, but not good enough for your potential client. That’s why we are needed, we know what is going on right now in a specific area.
Have a prosperous month.
Chuck
