The 4th of July weekend. Memorial Day weekend. Mothers Day. Fathers Day. School Graduations. Vacations. School out early. School out late. Taxes due.
If sales are up, everyone is happy. No analysis required. If sales are down, we look for the reasons. Every week we talk about what is happening. Why?
One problem is that real estate is not a day-to-day business. Starbucks is a day-to-day business. They can count on their sales level like clockwork. Daily. Groceries are a day-to-day business. Or perhaps week-to-week. Consistent. But with real estate, we never know what each day will bring. Or each week. Or even each month.
That is why economists tend to describe real estate sales as this year versus last year, this month versus last month. Price changes versus last year, versus last month. Too much fluctuation.
There is no perfect way to decide what time frame to choose. I have chosen a period of 2-3 months, comparing the 3-month period this year with the same months last year. Often one year of data is too much data, and one month is too short. The week-to-week and month-to-month changes have too many variables (see the first line of this blog). Did a lot of high-priced homes sell? Or not? Averaging takes care of some of these variations. But averaging over too long a period loses the latest trend.
That’s the background theory. Now lets look at our current results.
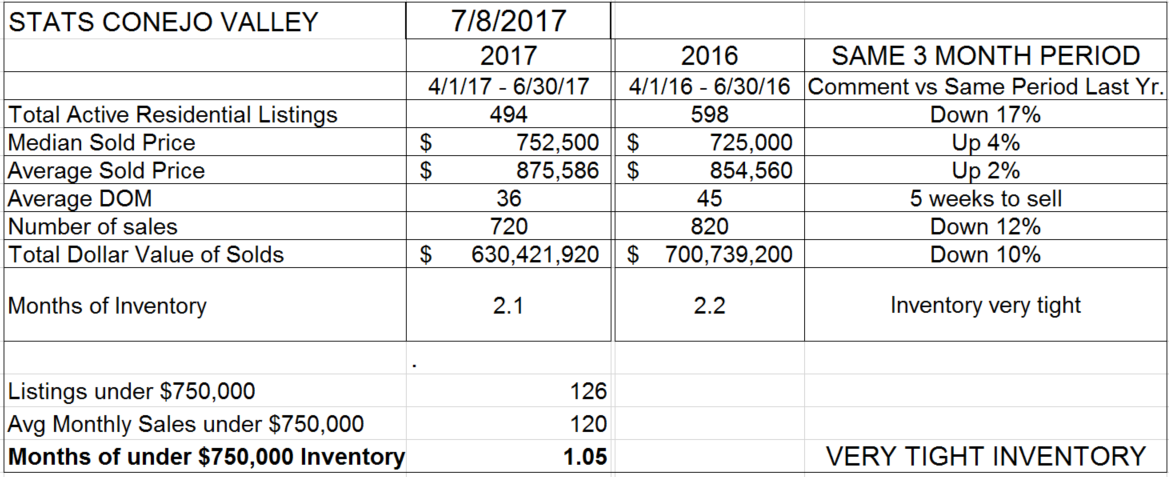
In the Conejo Valley, inventory remains 17% below the same day last year. That 17% lower figure represents 100 units. Sales levels were down also, by 12%, also 100 units. With sales relatively weak, and inventory significantly lower, we have to look at another factor to determine if the low inventory is affecting the level of sales. That factor is price. If demand and supply are in balance, we can expect prices to increase only slightly, perhaps along with inflation.. That is what prices are now doing, up 4% on the median price and up 2% for the average price, which is more affected by the mix of higher end properties.
Some suspect that lower sales figure is due to the lack of inventory. A shortage of homes to sell would overheat the market. I propose to you that we are not in an overheated market, even though inventory is way down. Because demand is also lower. If low inventory were causing the market to overheat, prices would be rising dramatically, and they are not. The market seems to be balanced. A balanced market is one where neither the buyer nor the seller have a distinct advantage. Balance is not a bad thing, let’s call it normal. We have not experienced normal for many years.
Then why are homes moving so quickly? The average Days On Market has been falling consistently, showing how quickly homes are selling. The average days on market is now only 38 days, close to 5 weeks, versus 46 days or 7 weeks last year for this same period. Perhaps buyers are doing more research prior to actively entering the market to buy, and sellers are keeping their homes off the market until they are staged and ready to show and sell. When a knowledgeable buyer meets a house staged to sell quickly, decisions to buy and sell are made quickly.
Finally, for those homes under $750,000, there is only one month of inventory. Considering that the median home price is right at $750,000, this price point is beginning to lose its importance in the Conejo. We now have to consider the two segments priced below $1,000,000 as significant.
Not so for Simi Valley and Moorpark.
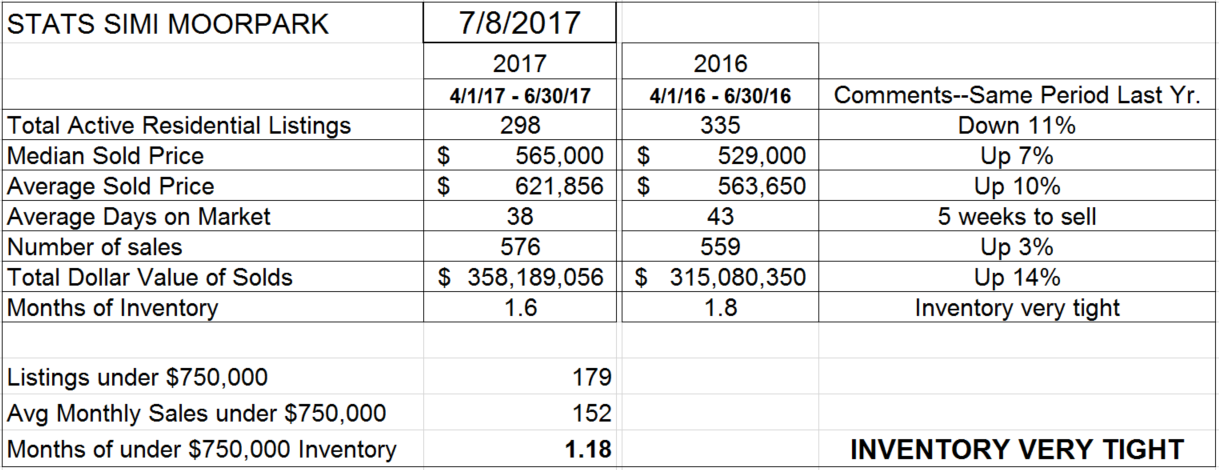
For Simi Valley and Moorpark, the numbers portray a different market. Inventory is also down, 11%, but the number of sales is actually 3% higher, causing pricing compared to the same 3-month period last year to increase by 7-10%. The median price of homes sold is well under $750,000, registering $565,000. Those median priced homes are selling in 38 days versus 43 last year, and the inventory represents only 5 weeks of sales. For Simi Valley and Moorpark, that figure is an important number. The lower inventory of homes are affecting the number of potential sales, as can be seen by significantly higher prices (7-10%).
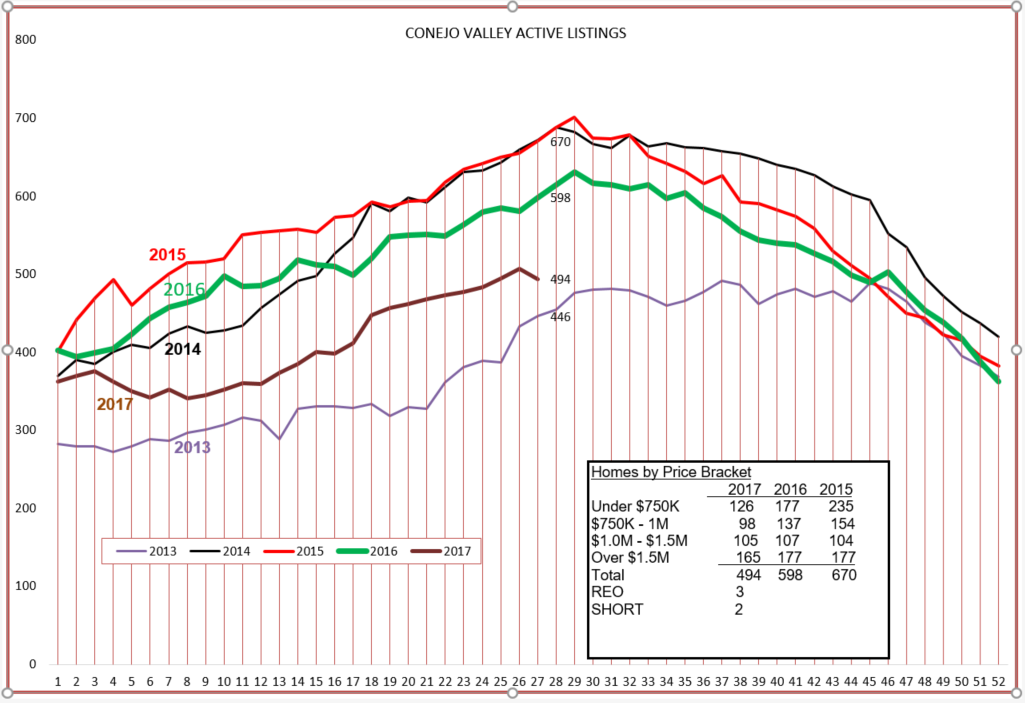
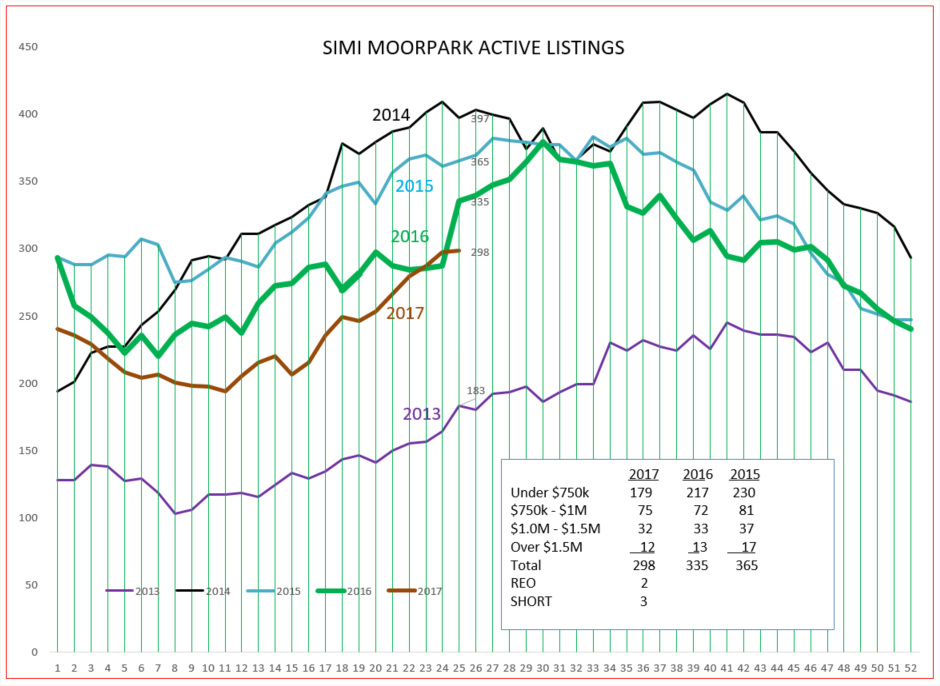
Let’s look at how the current inventory compares to the past few years. The Conejo inventory line is following the same slope, but the numbers are lower than any of the past 3 years. REOs and Short Sales are still around, but, as the attorneys say, de minimus. Look at the numbers in the box comparing different price levels. The two highest price levels are amazingly consistent year to year. The real drop in inventory is in the listings priced below $1,000,000. Since the point between the two levels is now $750,000, the median price, the decrease in inventory is not limited to the lowest price segment, but to both segments under $1,000,000.
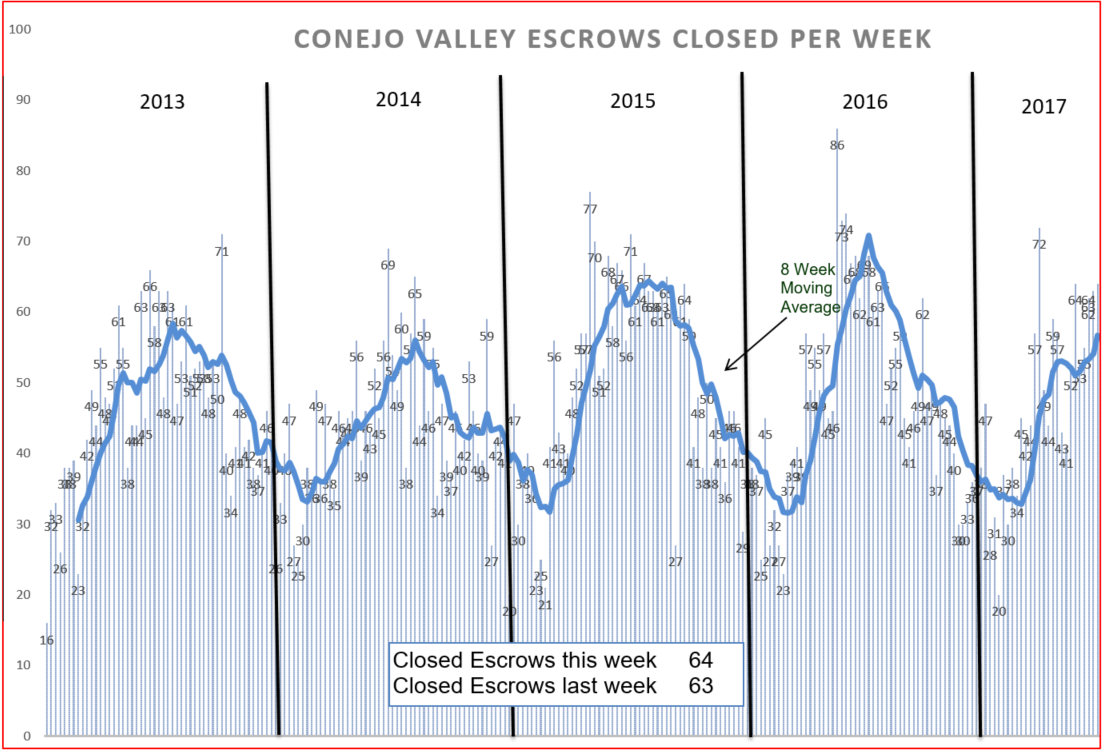
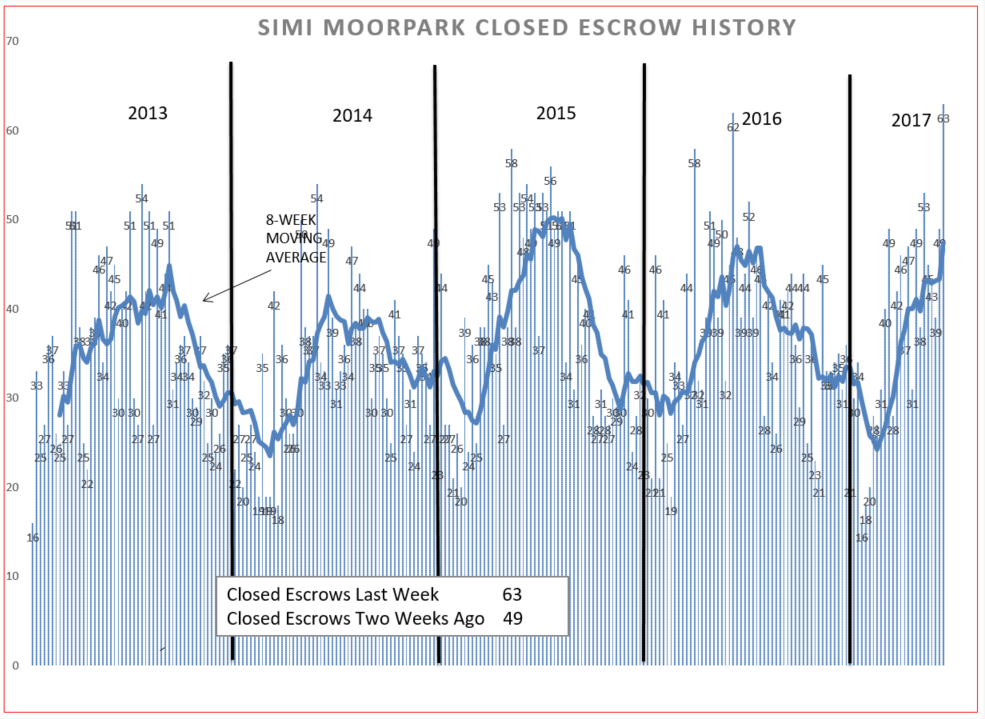
The statistics for Conejo tell us that sales are down 12%. Let’s see if we can visually see that on the closed escrow chart. See below, the number of escrows seems to be peaking more like 2013 and 2014, not reaching the higher peaks reached the last two years.
Now let’s compare the Simi Moopark active listings. The statistics page tells us they are down 11%. The number of listings is expected to increase as we go into the summer. Currently we are up only about 60 homes from the number at the beginning of the year.
The Simi Moorpark inventory is pretty much a mirror image of Conejo. Look at the numbers in the box comparing different price levels. The three highest price levels are amazingly consistent year to year. The real drop in inventory is in the listings priced below $750,000. And that level represents the preponderance of sales in Simi Valley and Moorpark.
For Simi Moorpark, the number of sales is up 3% compared to last year, only an additional 16 units, but higher. And from the chart it looks to be quite similar to 2015, a very strong year.
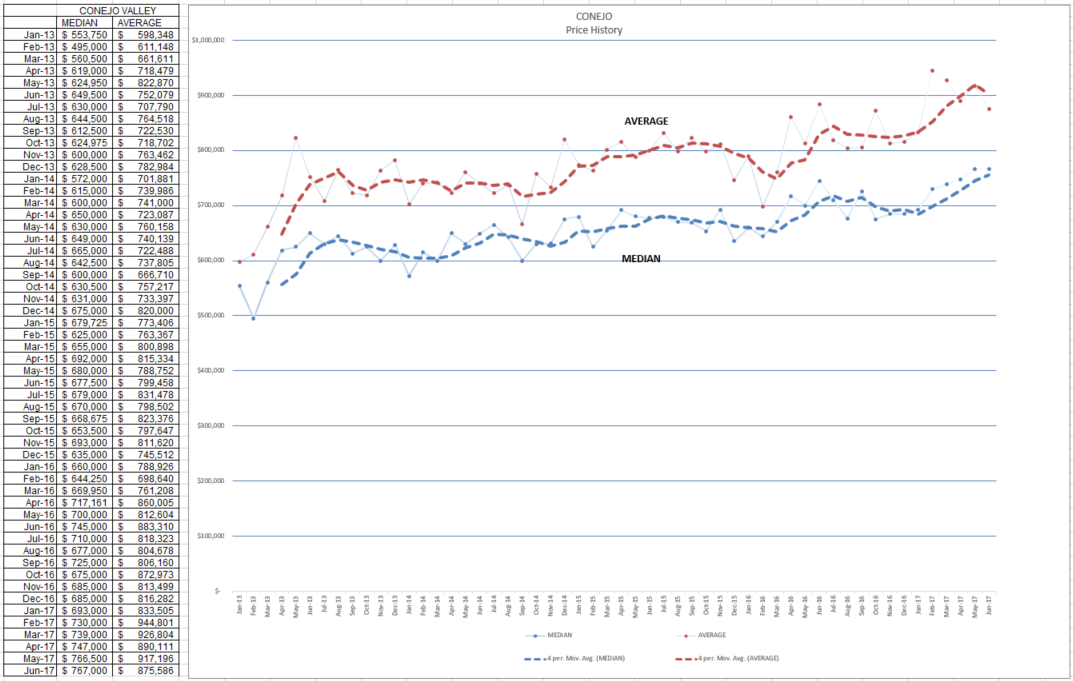
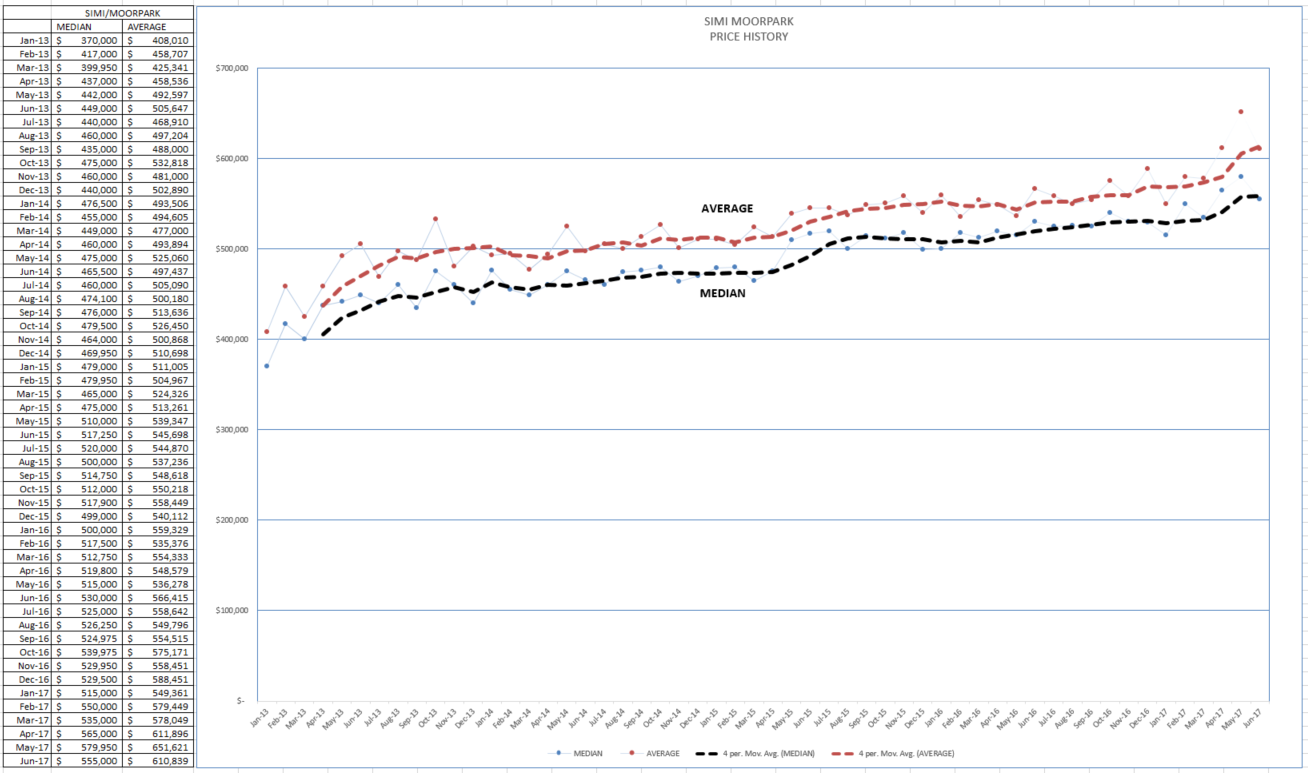
Finally, the price charts. Each point representing mean and average prices in these charts represents only one month. However, the dashed line does present the average of the preceding 4 months, smoothing out the information to more easily see the trends. We started out this blog by discussing that real estate sales are not day-to-day consistent. This chart shows that mean and average prices are also not day-to-day consistent, there are many factors that affect mean and average prices, not the least of which is the sale of very high priced home (or the lack of such a sale).
For the year, the chart shows very strong price increases. Then why only 2-4% on the statistics page at the beginning of this blog? Because price increases have pretty much taken place, and now the higher prices are beginning to slow sales down somewhat. Supply, demand, price, all three are inter-related.
The points on the Simi Moorpark chart do not show large ups and downs, but more a steady climb. Prices are up 7-10% compared to the same 3-month period last year, and took a good jump the last 3 months. The market in Simi Moorpark remains strong.
So that’s the way I see the market. Do you agree? Disagree? Let me know what you think.
Chuck
