The big discussion in real estate is about the Tax Bill, and what it will mean for California home ownership.
While there are plenty of theories being offered, the real answer will come, as it usually does, from the individual decisions each buyer and seller makes. Should they buy, should they sell, at what price? The end result of all these decisions is what we call The Market.
We have been living with low inventory for many years now. Somewhere back in the Midwest, people may still try to discuss a “Normal and Balanced” inventory as one with six months worth of sales.
That has changed forever in California, particularly for the areas close to the ocean.
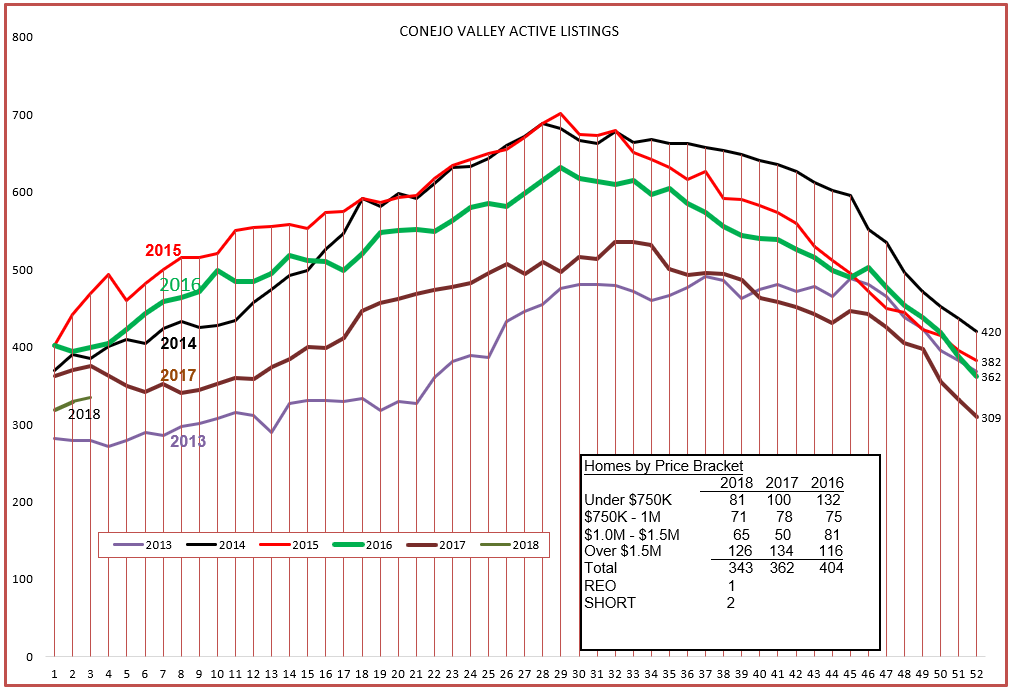
We started out 2018 with an inventory that was the second lowest in the past seven years. That sounds very intimidating. But, if you look at the box in the chart below, the inventory at this time of year for the past three years has been fairly similar–343, 362, 404. So it is the lowest, but not by that much. It is sort of both low and normal.
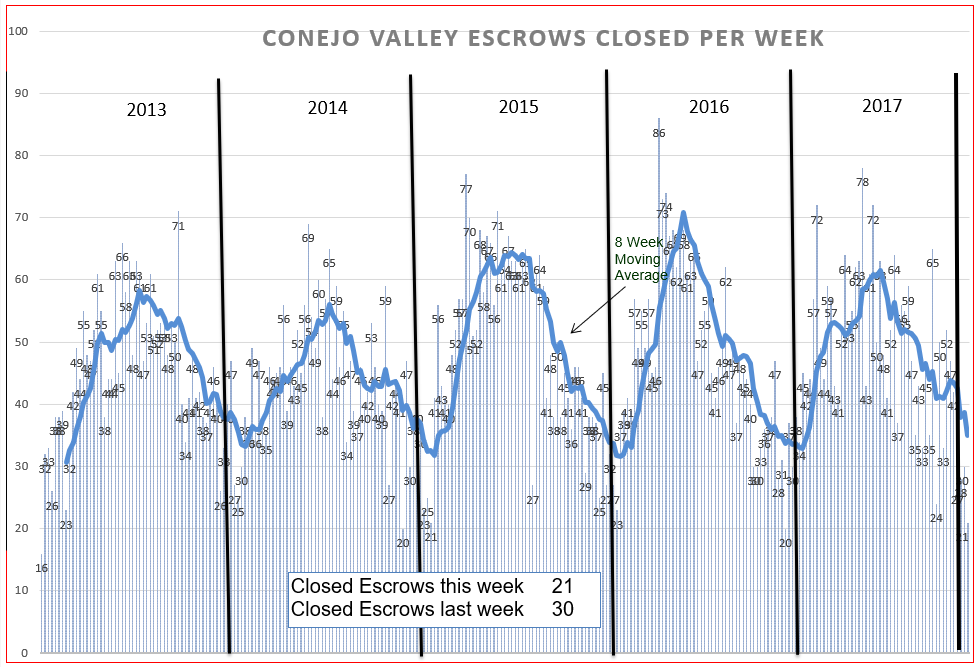
The “months worth of inventory” is defined by two factors. One is the actual inventory, and the other is the number of sales taking place. To see if that has been changing, let’s look at the number of sales over the past five years.
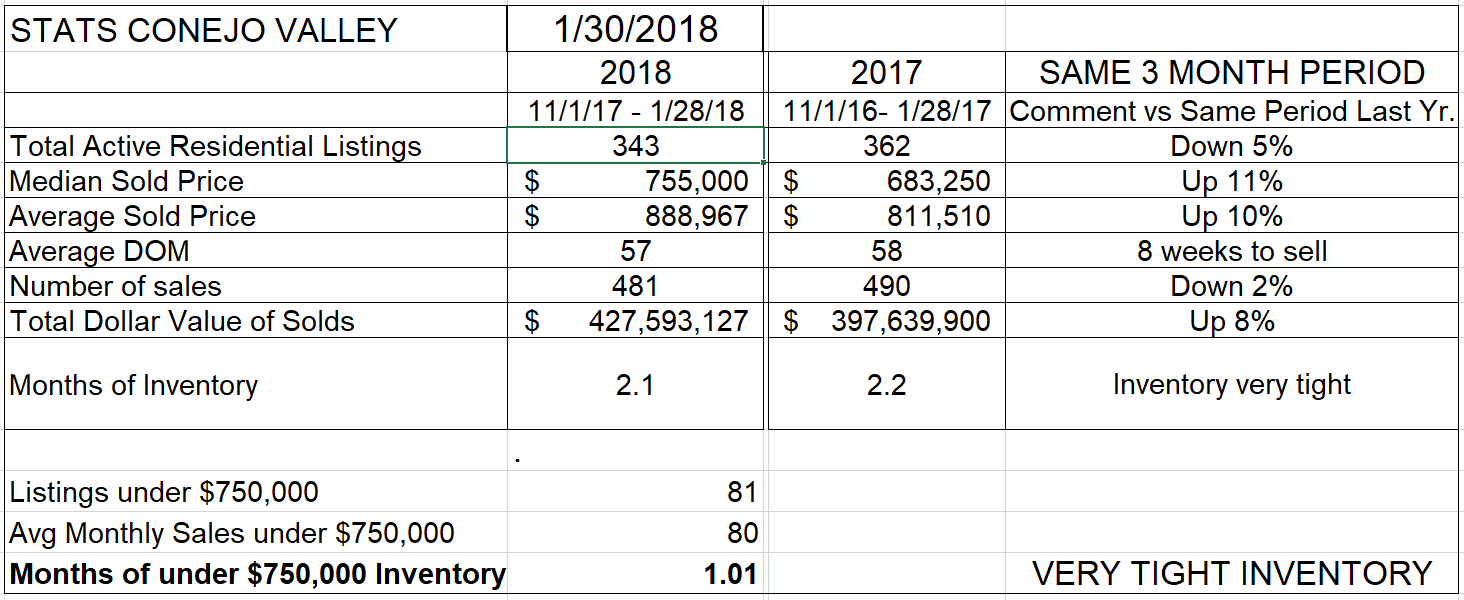
The number of sales varies according to the time of year, and for now it looks very normal. The end of the year holidays see many homes temporarily coming off the market and the quest to purchase a home put on hold. This chart represents closed escrows, which occur 5-6 weeks after a contract to sell has been agreed upon. That’s why there is a dip between the first of the year and around the middle of February. Is it busy out there today? I visited with an agent this morning with a home that has been on the market for four months. At an open house both Saturday and Sunday, he had 20 groups come through each day. Reportedly, there are a lot of people looking over the minimal inventory with the intent to buy. Rather than charts, let’s look at the actual statistics, comparing the past three months this year with the same three months a year ago.
The inventory is down, but only by 5% from a year ago. The number of sales is down, but only by 2% from a year ago. And prices have increased by 10-11%. With this level of inventory and this level of sales, we are at 2.1 months worth of inventory, about the same as the 2.2 months a year ago. Some might term this “Normal”.
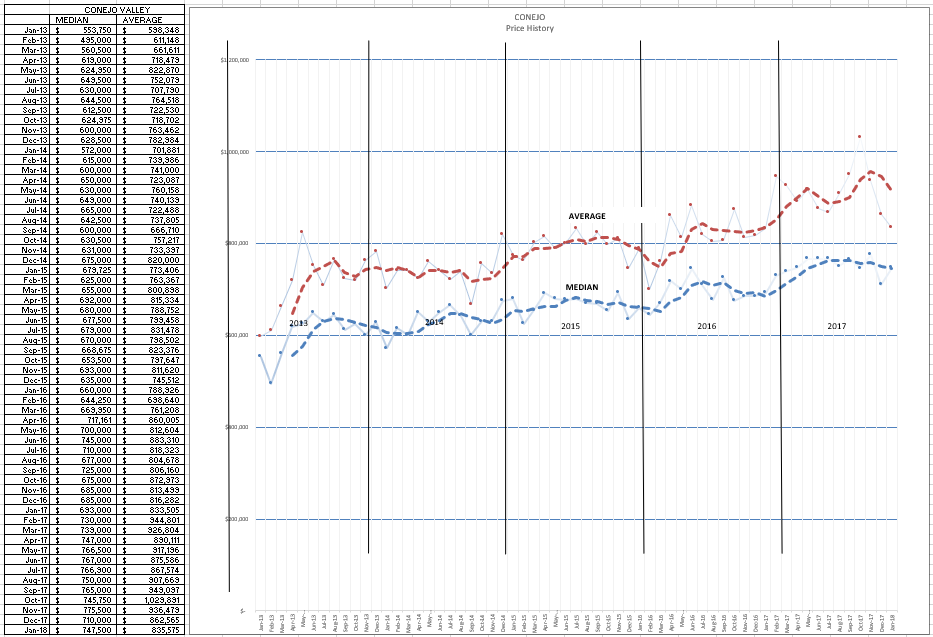
Let’s look into those price increases over the past 5 years.
You can see the seasonality in this chart, prices going up slightly in the spring and down slightly in the fall. The space between the Average and Median lines is due to the percentage of higher priced homes. The more higher priced homes that are part of the mix, the wider the space between the lines. During the past four months, the higher priced factor has been significantly dropping.
Now let’s see if Simi Valley/Moorpark has been behaving in a similar fashion.
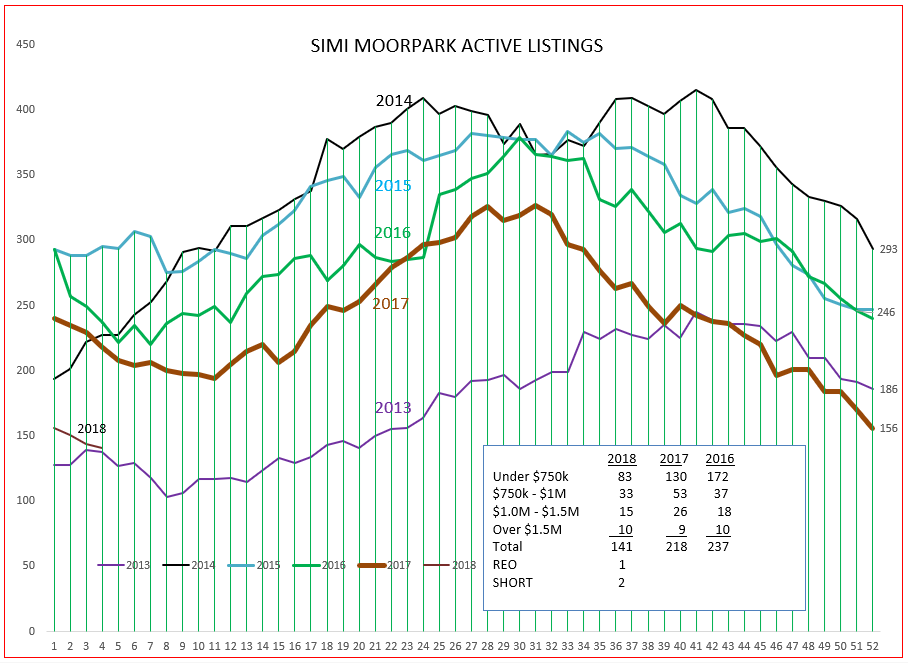
Simi/Moorpark is a red-hot market as measured by inventory. 2013 was a period of high price inflation for homes, and the 2018 inventory seems to be mirroring 2013, the lowest inventory for the past five years. With only 141 homes listed, and only 83 priced below $750,000, the inventory is extremely low. But is there still activity in the marketplace? Are homes still selling? And is the inventory so low that it is putting a lid on sales?
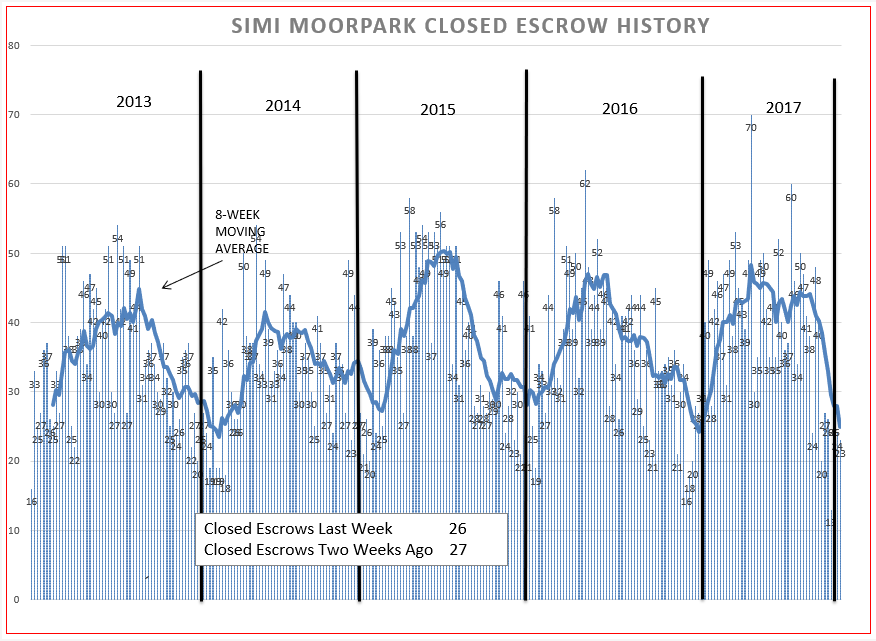
Sales figures have taken a precipitous drop at the end of 2017, dropping off more severely than any previous year displayed. Some of this could be due to the lack of inventory. We need some real numbers to make a better comparison between last year and this year, comparing three months of history for each year.
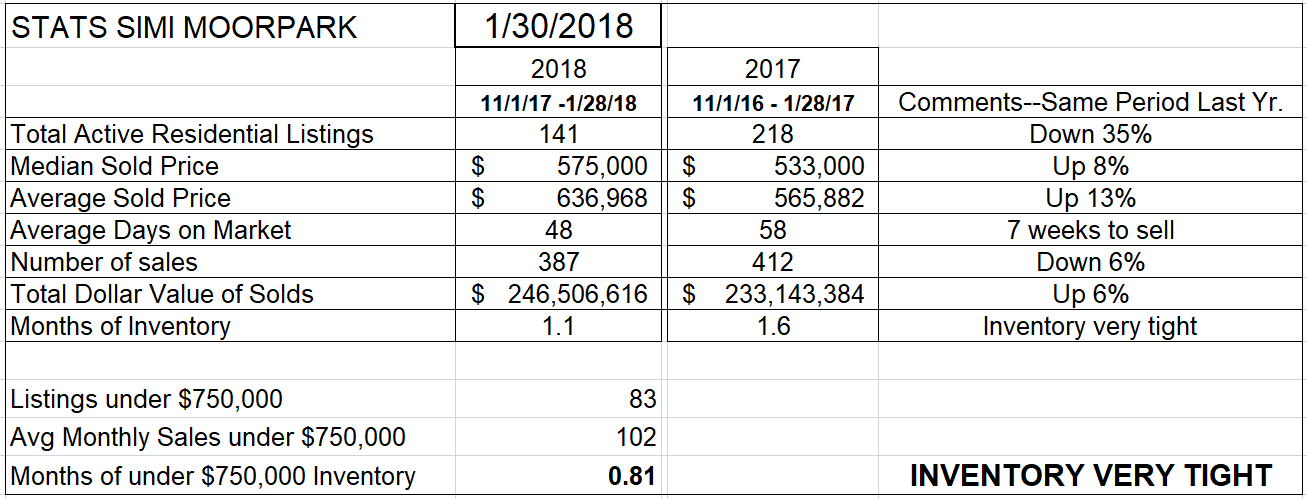
These statistics show that the inventory in Simi Moorpark is down 35% from last year, while the number of sales is down only 6%. Unlike Conejo, the two lines are moving pretty much in sync, because the vast majority of sales are in a fairly narrow band, between $500,000 and $600,000.
The inventory represents only one month of inventory, while the Conejo is twice that amount. And the inventory of homes priced below $750,000 represents only three weeks of supply.
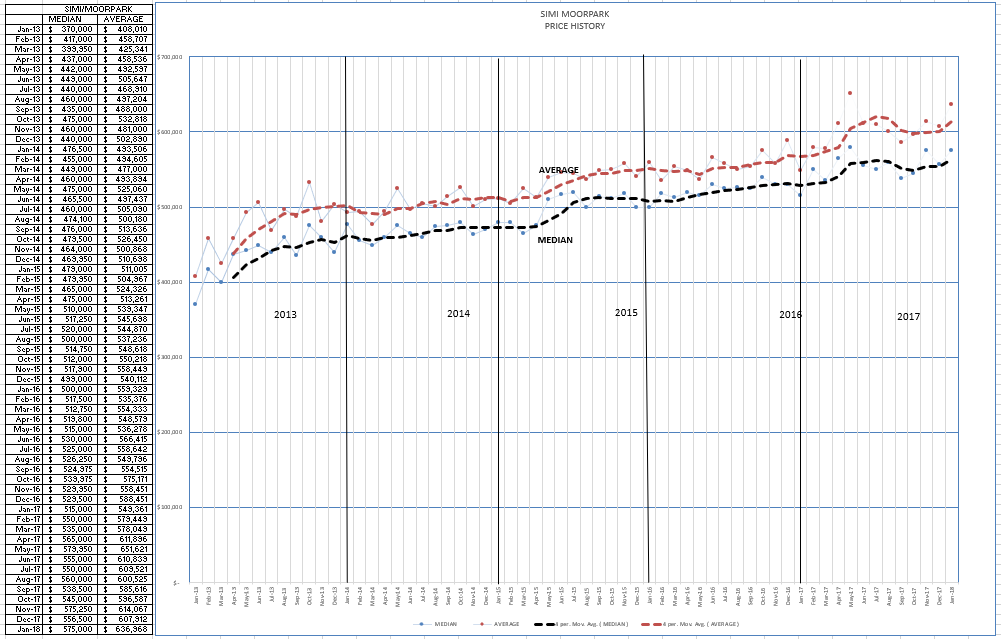
Up until last month, the price increase from the same three-month period a year ago was lower, 5-6%. Now we are seeing an 8% increase for the Median Price, and 13% for the Average Price.
You can see that, during 2017, the space between the two lines has widened, indicating that many more expensive homes have become part of the mix.
So this is what the market is telling us.
The relatively lower priced homes in Simi/Moorpark are more attractive than the higher priced homes in the Conejo.
Both areas are experiencing strong inflationary pressures. While Simi Moorpark had reported lower inflation than Conejo, that is now changing. Both areas are experiencing strong inflation.
There is practically nothing to buy in Simi/Moorpark, only a one month (or less) inventory.
Conejo experienced higher price appreciation throughout 2017, and now Simi/Moorpark is catching up. The inventory tells that tale, as the Conejo inventory has two months worth of sales, whereas Simi/Moorpark has only one month.
We will need a little more history, a little more information, to be certain of the tale being told by the market. But it looks as if the new tax bill restrictions will not drastically affect the appetite buyer’s have for homes in our area.
Have a wonderful month.
Chuck
