For years now, we have said that we could sell more if only we had more to sell.
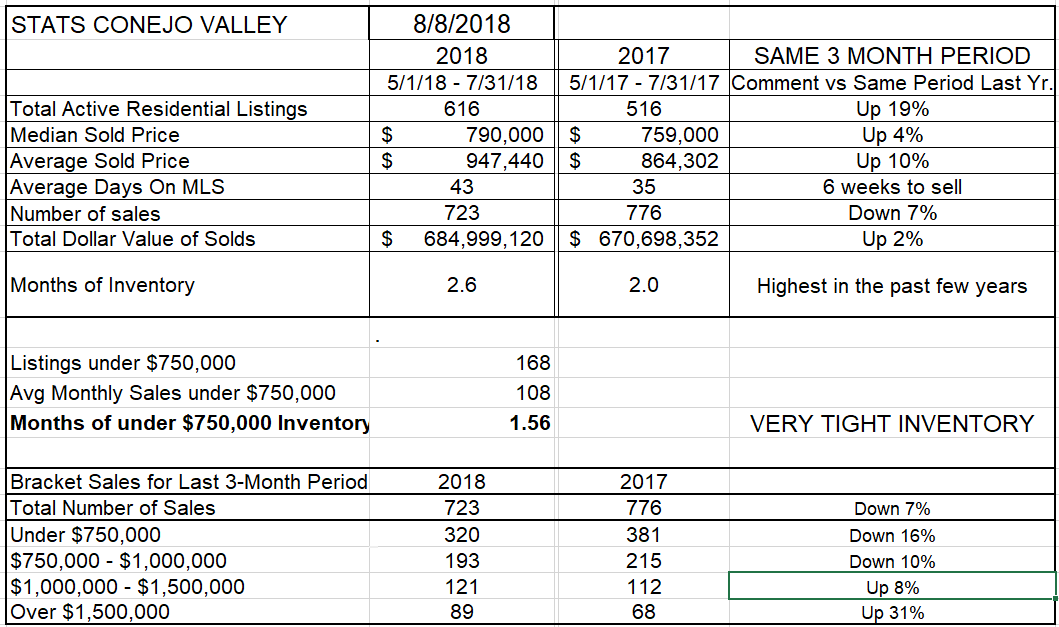
The lack of inventory has been accused of putting a lid on the number of sales. However, prices have not dramatically increased, which is the usual result of low inventory and strong demand. We are now seeing inventory and prices climb together. The inventory in the Conejo Valley is up a very strong 19% versus the same week a year ago. There should be lots to sell. Prices are higher, 4% for the average price and 10% for the median price.
But overall, sales are down compared to last year, down by 7% for all price ranges.
While previously the high priced segment has been soft, the number of sales in the two highest price ranges, $1 million to $1.5 million and over $1.5 million are up 8% and 31% compared to the same three months a year ago. Sales in the lower ranges, zero to $750,000 and $750,000 to $1 million, are down 16% and 10% respectively. The high priced end has been booming, the low priced end has been struggling.
Median and Average prices reflect the same shift, with Median prices up 4% versus a year ago, while Average prices are up 10%. This spread reflects a strong market in the high end.
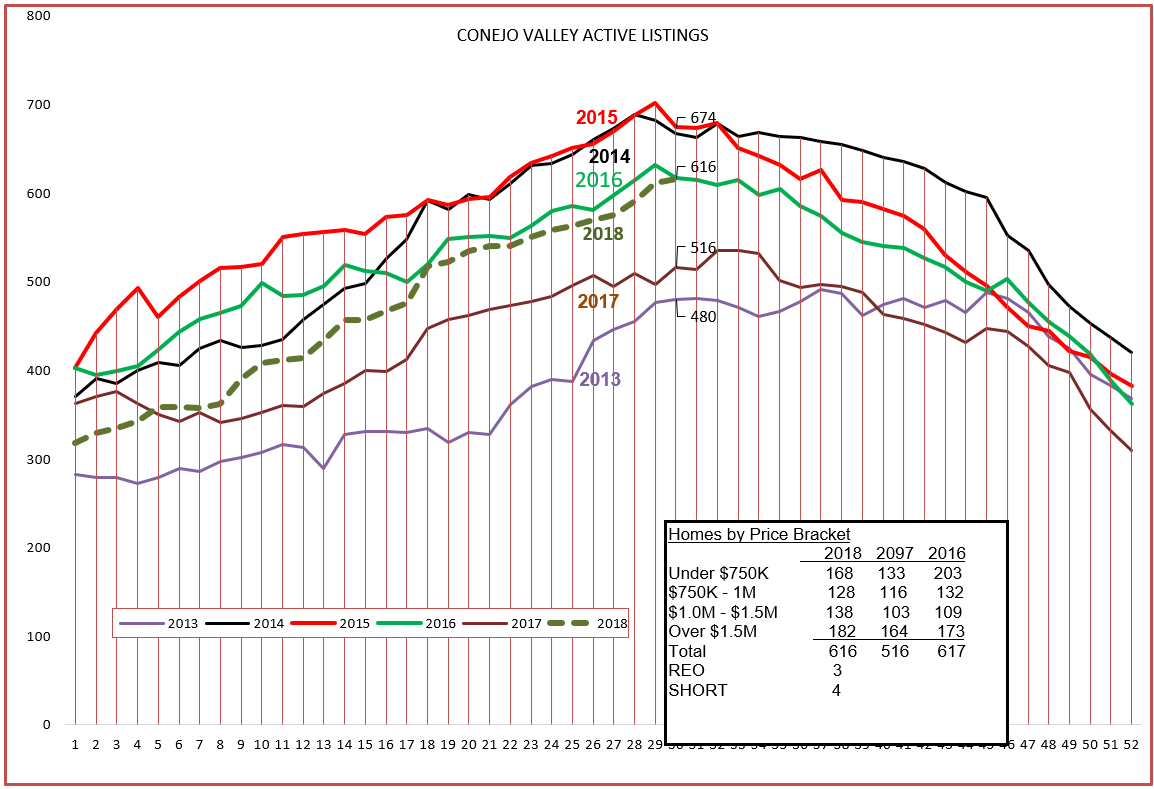
Let’s look at the graph of active listings in the Conejo. The figures say inventory is up 19% from last year, while the graph shows the history of listings for the last 8 years. The graph shows a dramatic increase in inventory for this year, moving from almost a historically low level at the beginning of the year to one of the highest levels seen at the middle of the year. The inventory has been climbing dramatically.
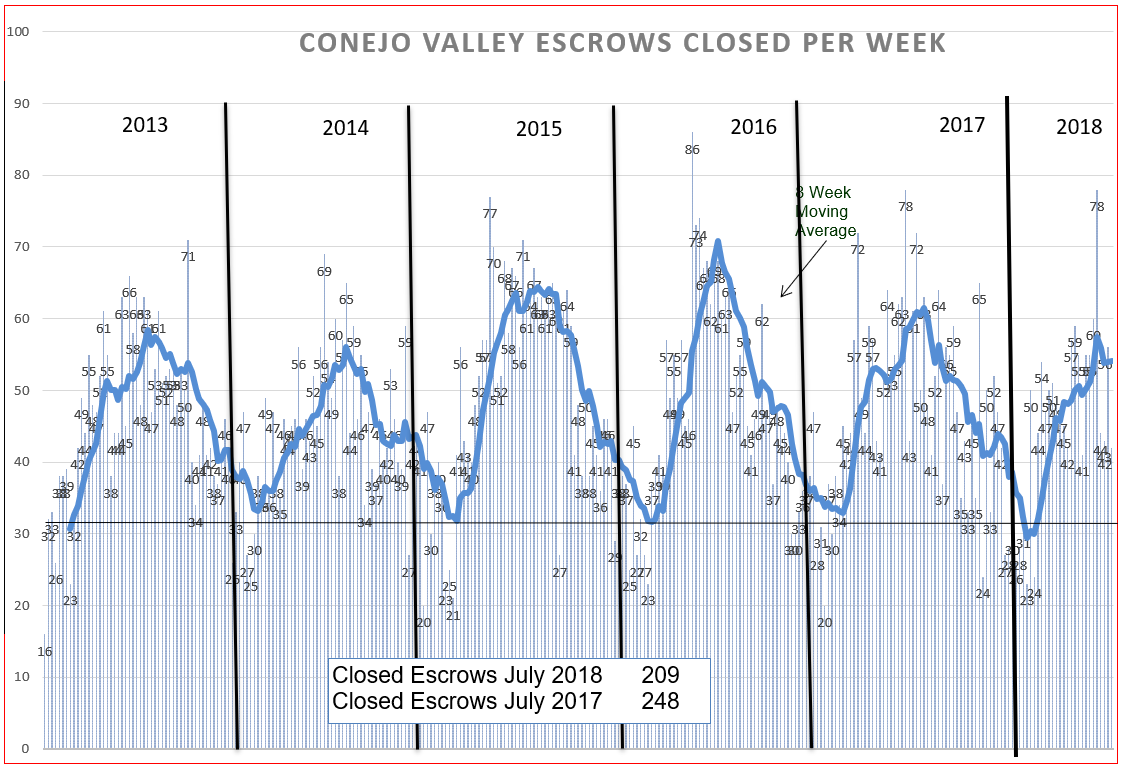
Next, the closed escrow graph. We know from the chart above that sales have dropped off, down 7% from a year ago. You can see that the mid-year turnaround has taken place, and the height of this season is down from the past three years, more in line with 2013 and 2014. For the month of July compared to 2017, sales are down 15%. This market has slowed.
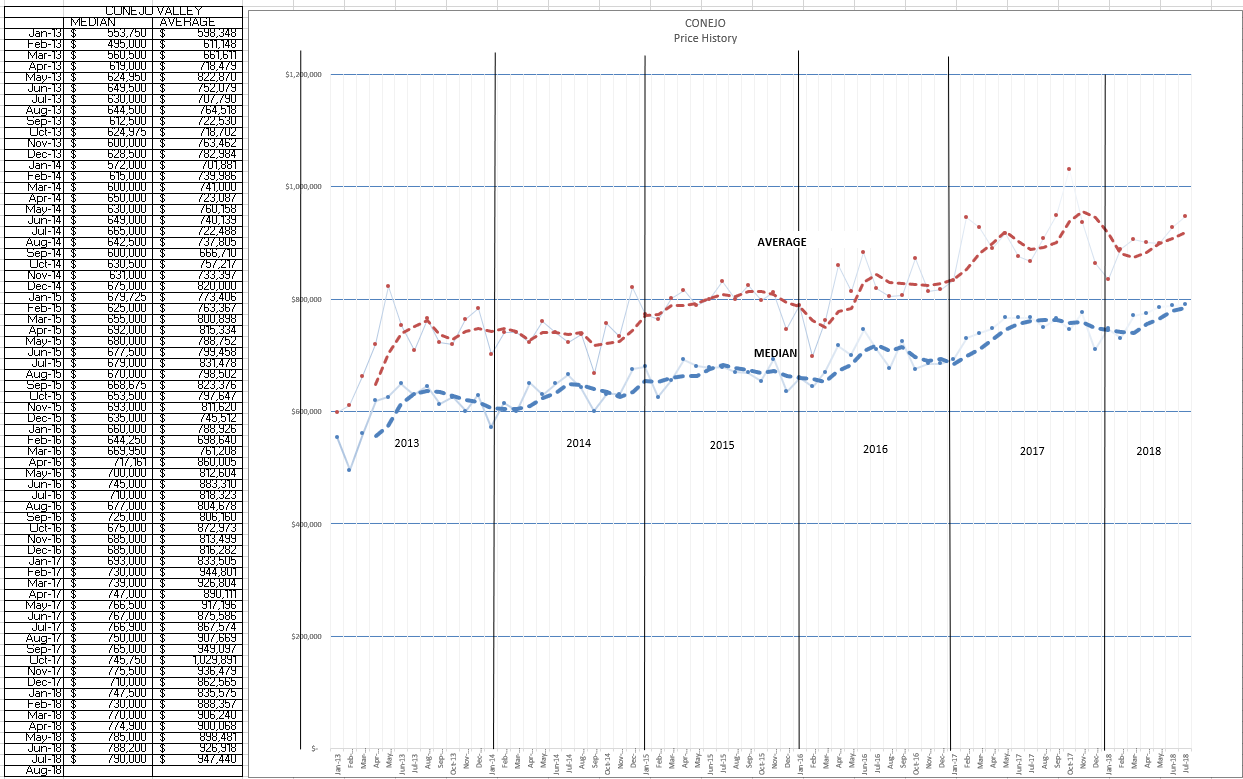
Finally, lets look at prices. With the market slowing, and inventories rising, prices should be leveling. To my dismay, in the past few months prices have gone up dramatically, both Average and Mean. The dashed line is an 8-week average, used to smooth out the points on the graph and make a little more sense of month-to-month changes. This chart shows extremely strong price appreciation, with all the points above that average price line. That line will continue to go up, and is being pushed by high end purchases. The average price in the Conejo Valley is approaching the $1 million level, last month at $947,000, while the median price is at $790,000.
Let’s next look at the same information for Simi-Moorpark.
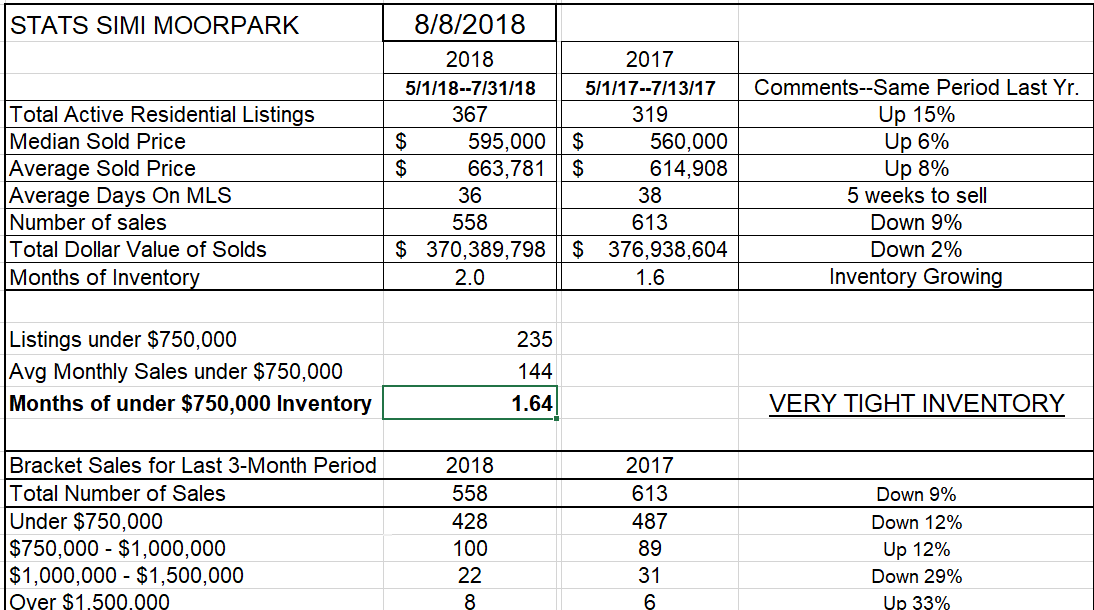
In Simi-Moorpark, the lack of inventory has for years been accused of putting a lid on the number of sales. Prices have previously risen 4-6%, about as expected, and better than inflation. The inventory in SImi Moorpark is up 15% versus the same week a year ago. There are more homes to sell. And prices have increased 6-8% from the same 3 month period a year ago.
But overall, sales numbers are down compared to last year, down by 9% for all price ranges.
Simi Moorpark does not have the range of high priced inventory as Conejo. Like Conejo, the high priced end is up 33%, but with only 8 sales, that trend is difficult to analyze. The lowest price range, below $750,000, is down 12% from a year ago. With prices rising, the next range, $750,000 to $1 million, is up a strong 12%. Then the next range is down 29%, while the highest is up 33%. With only 30 sales in these last two categories, this shift is difficult to analyze. But with 15% more inventory available, a drop of 9% in the number of total sales is significant.
The months of inventory has consistently been about 1.6 months, and that now has risen to 2.0 months, a combination that shows the market has slowed.
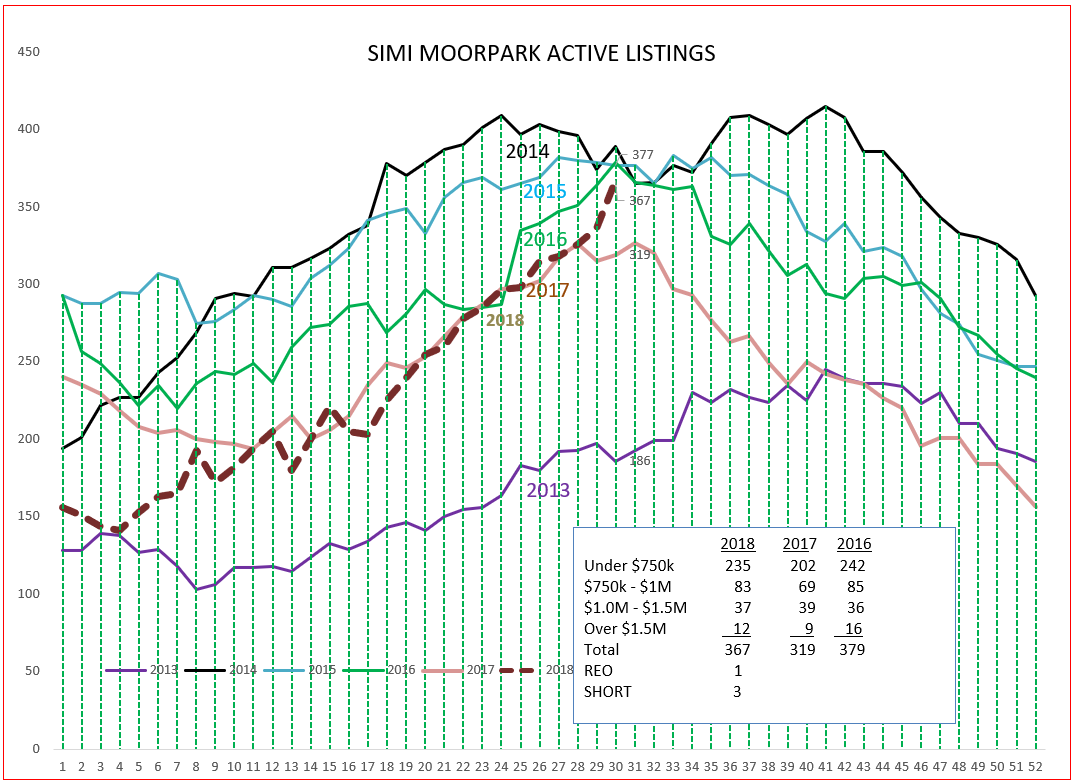
Let’s see what that rise in inventory looks like in a graph. Over the last 6 months, the almost historic low inventory has grown to almost a historic high inventory. And the increase does not appear to be flattening out. How does that saying go, be careful what you wish for? We now have plenty of homes to sell.
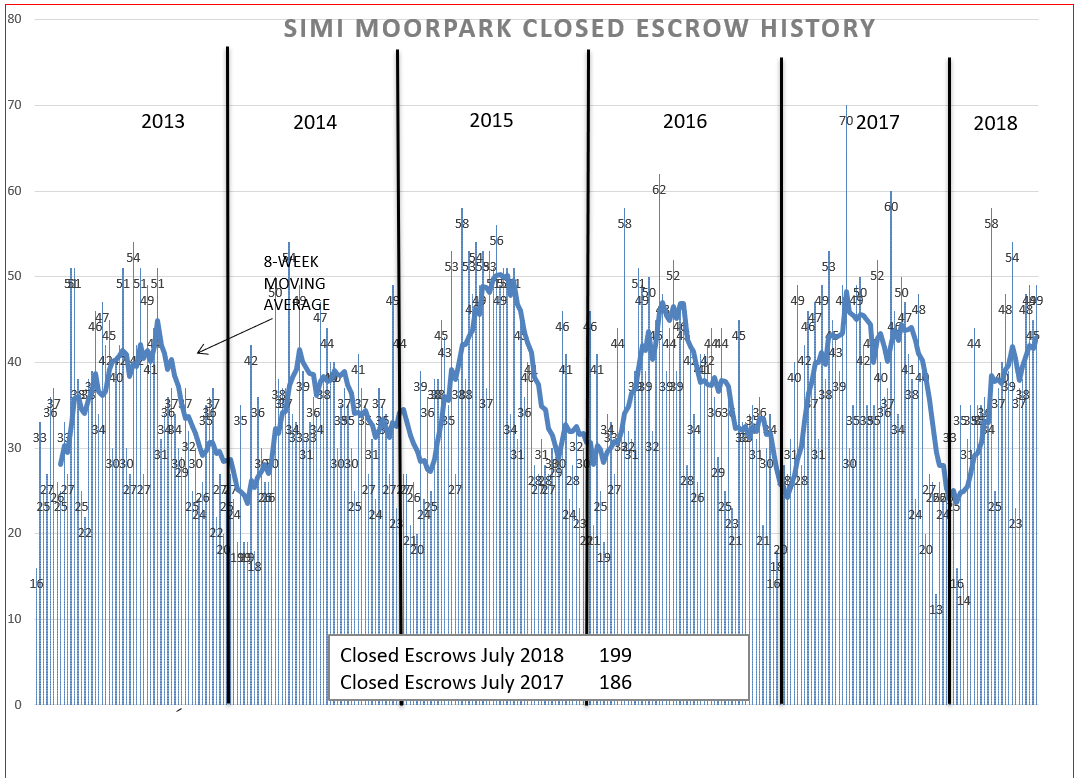
So lets see how sales have been doing. We know from the chart they are down 9%. Just like Conejo, the peak seems to have been reached and it is much below the last 3 years. Things look to be slowing.
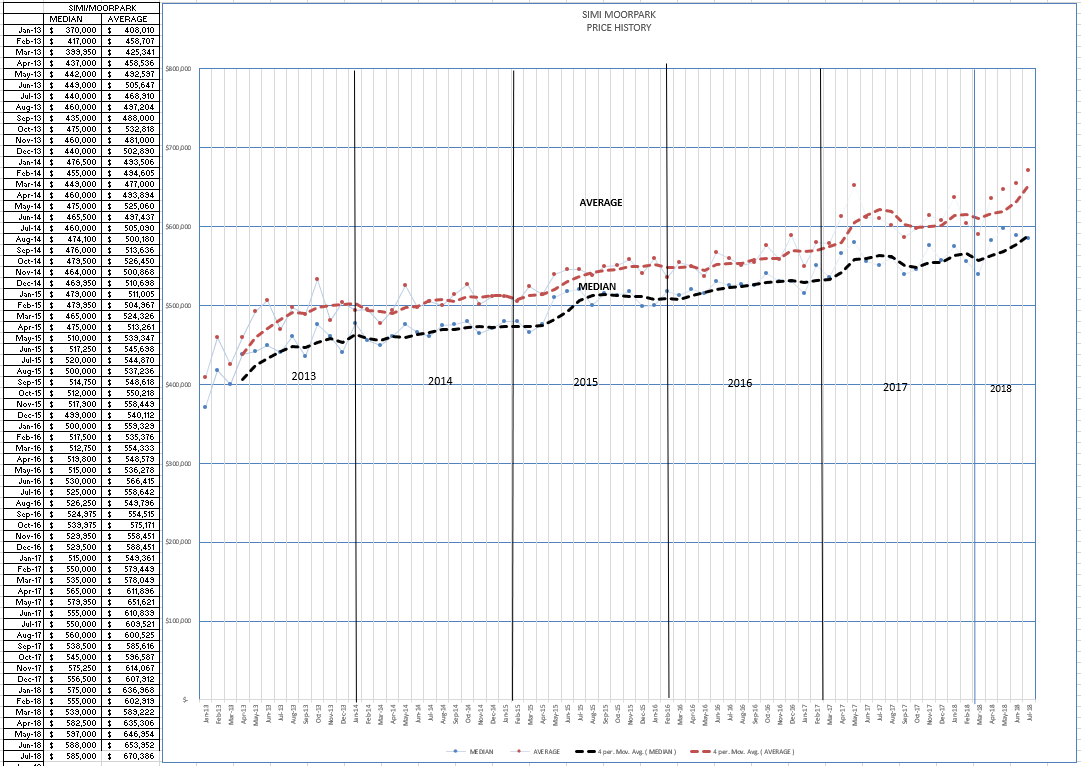
Finally, let’s look at prices. Same story as in Conejo, prices are rising dramatically. The Average price in Simi Moopark is now $670,000, while the Median is $585,000. The forces have been there in past years to push prices higher, and it looks as if they are finally getting there, just as the market is slowing down.
I will not describe this as a bubble, but certainly the market forces don’t call for sharp price increases in the near future. I would say we are due for what the stock people would term as “a correction”. Or perhaps a leveling.
Elections usually produces strong markets. Build in the massive tax cuts that we began the year with, followed by a Federal Budget with major increases in many areas, and it looks as if inflation will start taking hold of this economy. Add to that the higher prices that will result from the tariffs, and it is time to buckle up and ride this potential roller coaster we will be facing. Those forces may be accounting for the price rises we are seeing in real estate more than the basic supply and demand scenario. While the number of sales are down, prices seem to be strong.
My crystal ball is in the shop being repaired. What do you see in your crystal ball for the future?
