Remember the movie Dumb and Dumber?
We now have a market that is Slow and Slower.
How slow? All depends on where your market is.
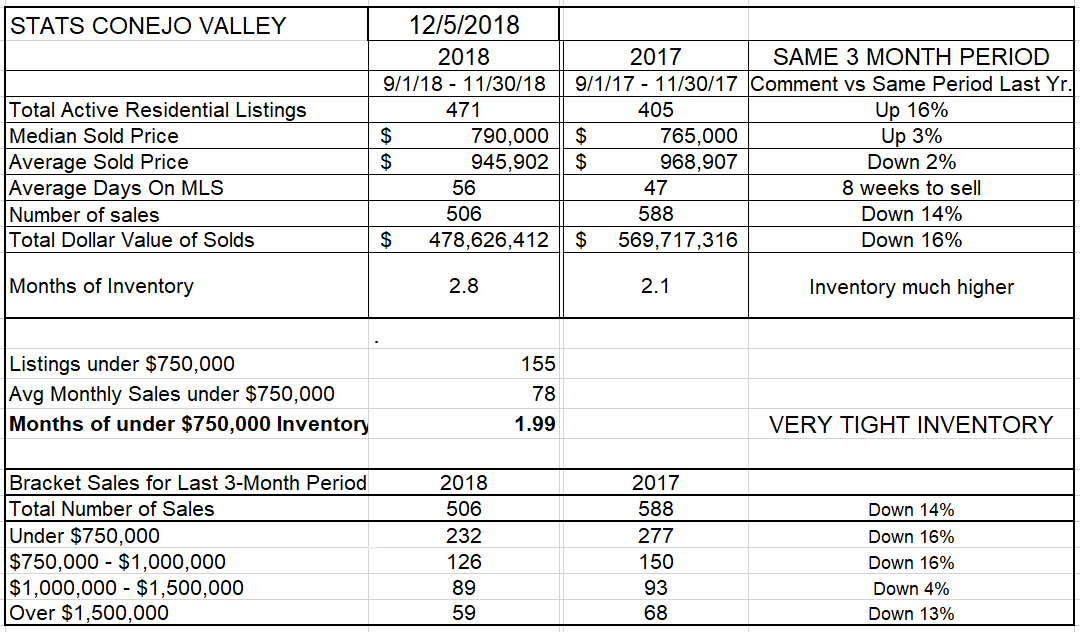
In the Conejo Valley, when comparing the past three months to those same months a year ago, inventory has risen by 16%, but the number of sales has declined 14%,. Average prices are down 2% and median prices are up 3% compared to a year ago. (The difference is due to the relative percentage of higher priced homes compared to lower priced homes.) Months of inventory has climbed from 2.1 months last year to 2.8 months this year. This change is attributable to the combination of higher inventory and lower sales. For every price sector, the numbers were down.
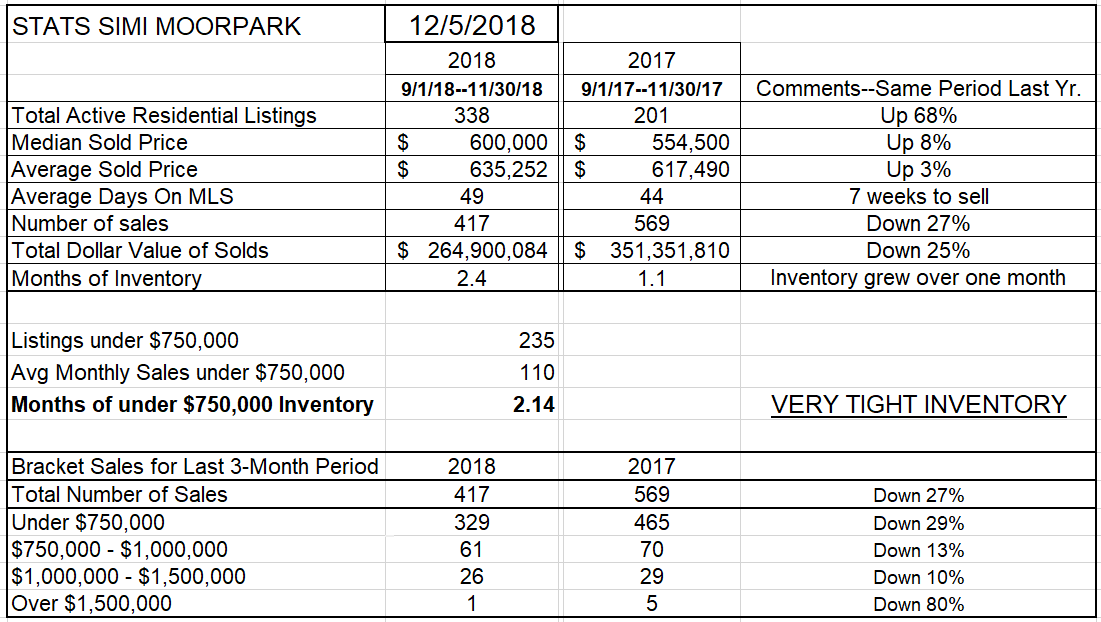
In Simi Valley/Moorpark, when comparing the past three months to those same months a year ago, inventory has risen by 68%, and the number of sales has declined 27%, with average prices up 2% and Median prices up 8% compared to a year ago. (The median price is where half of the sales are higher, and half are lower. For Simi/Moorpark, 79% of the sales were below $750,000, providing a heavy influence, and that price segment was down 29%). The months worth of inventory has climbed from 1.1 months last year to 2.4 months this year, from desperately low to just about average. Both the increasing inventory and the lower sales numbers contributed to that change. Every price sector showed lower sales numbers.
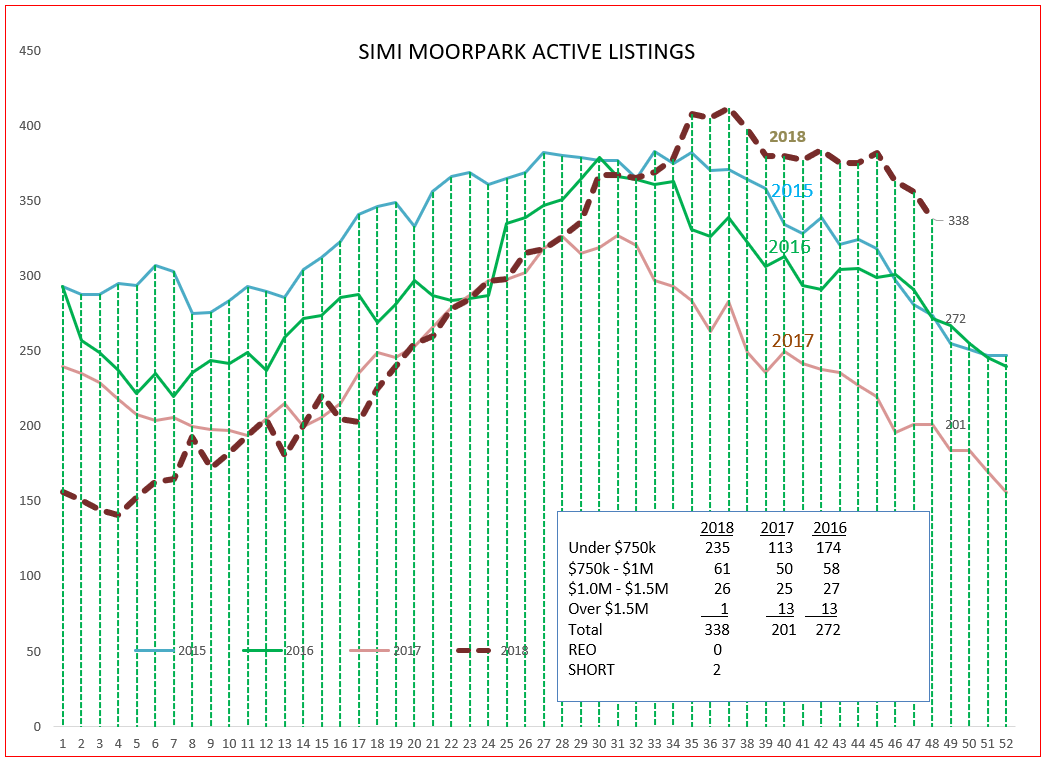
So how does that dramatic increase in listings look in a chart? See below. Things were going pretty much according to expectations until July, then the listing inventory took off. The normal curve is returning to end the year, but at a much higher level than the past four years.
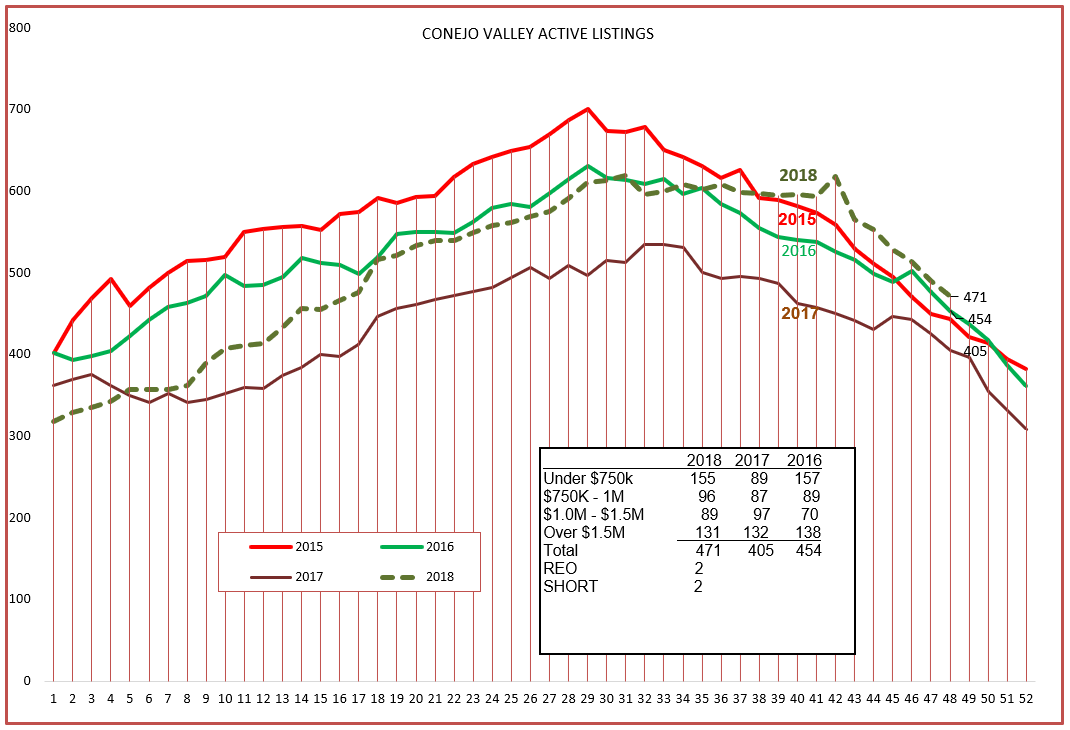
Conejo was not as dramatic, but inventory did grow. The 2018 chart, after a brief spike, is now following the path expected this time of year.
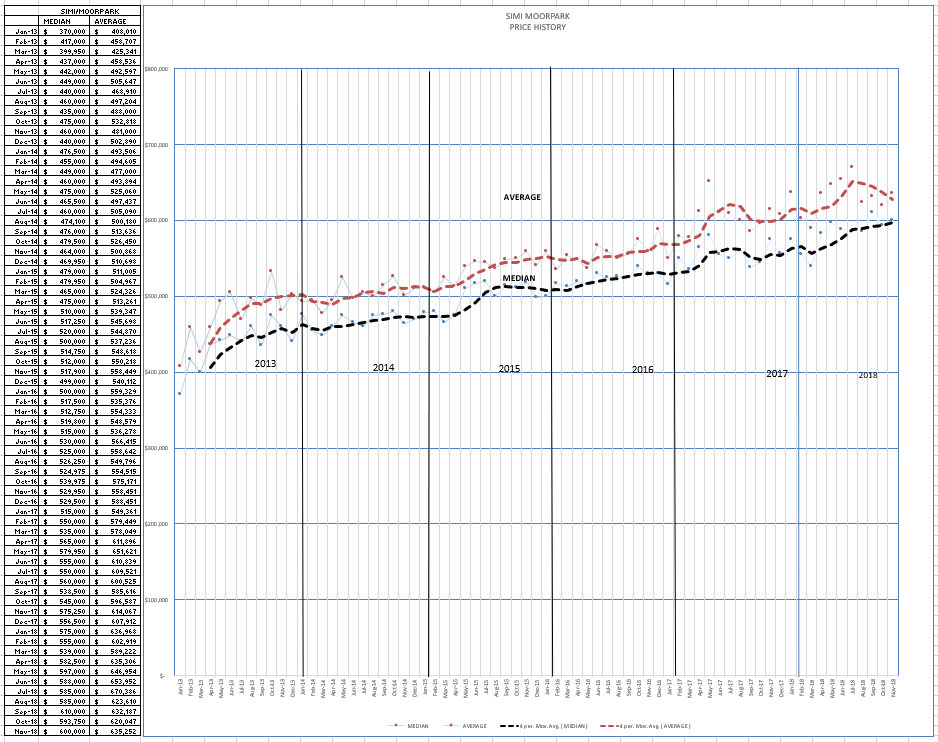
I have charted prices a little differently, plotting the monthly mean and average numbers rather than the 3-month numbers. This gives us a look at how volatile the prices have been without the averaging and smoothing effect of a 3-month chart. Simi Valley/Moorpark shows very steady price growth, with a few bumps mostly due to summer versus winter market strength. This long, steady climb has produced a median price that started in January 2014 at $370,000 and is ending 2018 at $600,000.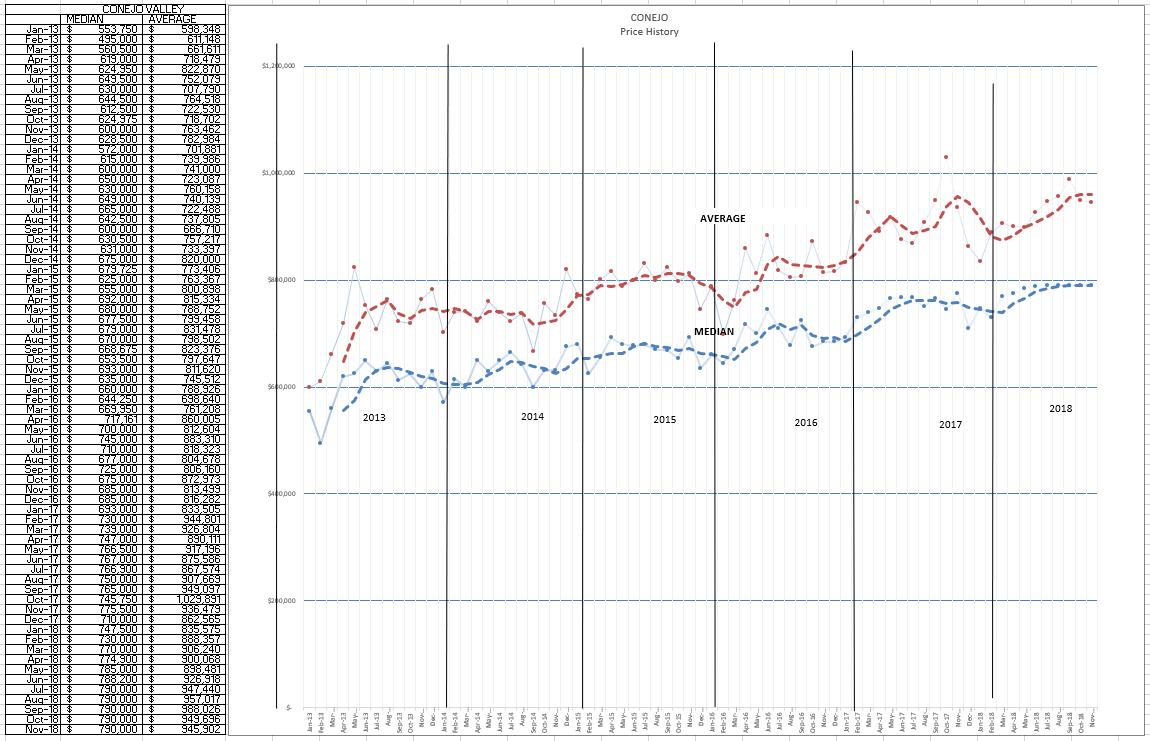
The Conejo price chart below shows strong price support for the Median prices, but the higher priced homes have caused a drop in the Average graph. $550,000, the median price at the beginning of this chart in January 2013. has now risen to $790,000 by the end of 2018.
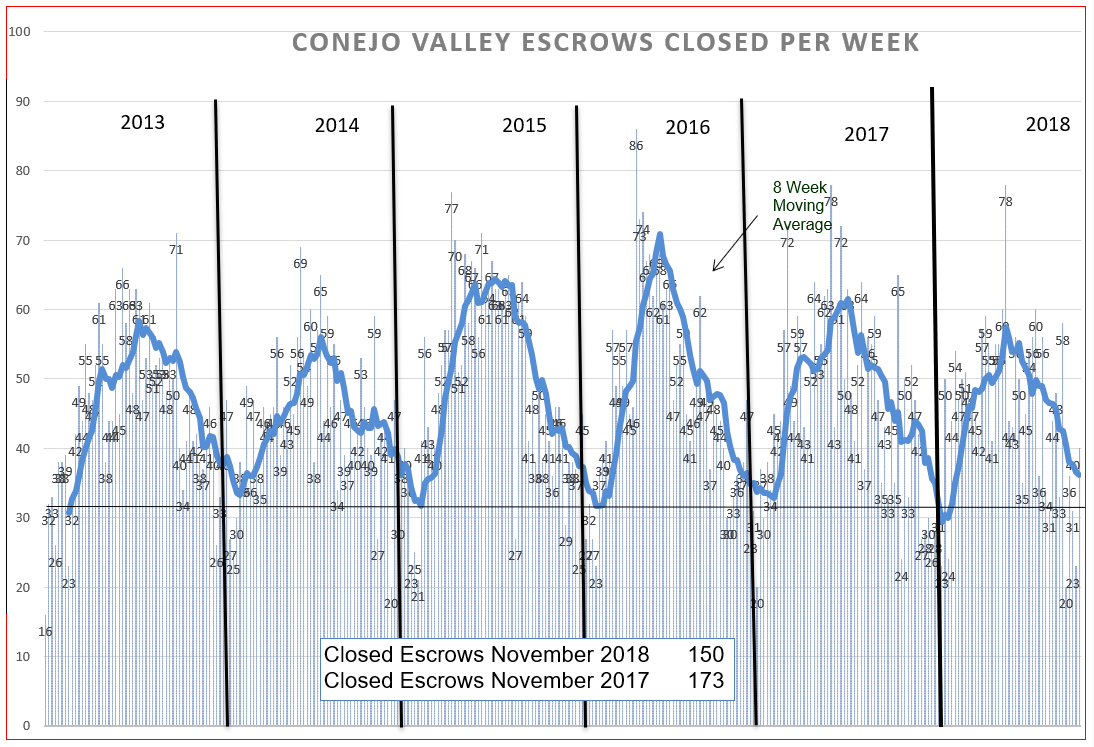
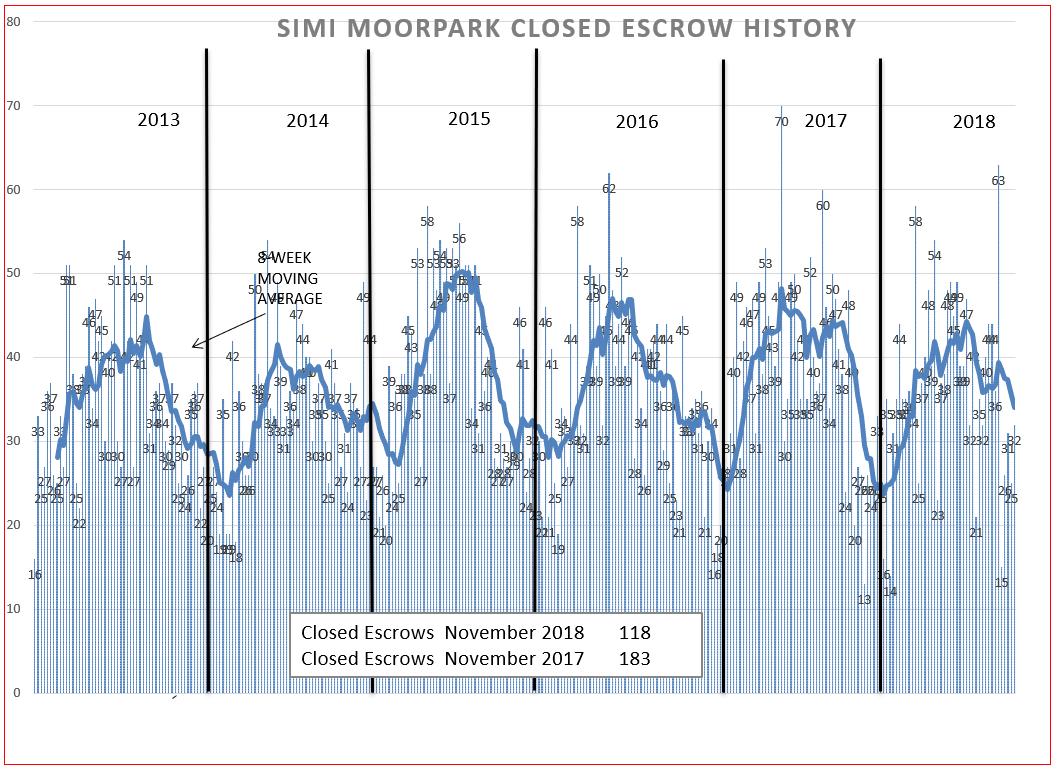
Finally, let’s look at the Closed Escrow charts to get a feeling of how closing have gone.
For the Conejo Valley, the number of homes sold in November this year compared to 2017 is 13% lower.
For Simi Valley/Moorpark, the number of homes sold in November this year compared to 2017 is 35% lower.
The stock market is usually described as a leading indicator, foretelling the future. The current stock market volatility is due to a wide variety of factors. Tweets, high price/earnings ratios, the Fed, the Trade War and tariffs, lower tax rates for corporations, the “death cross”, many factors. For a more simplistic viewpoint, more people are selling stocks than buying stocks.
That is what is occurring in home sales. Sellers no longer have the upper hand. No longer are numerous buyers chasing the same home with multiple offers. More people are selling houses than are buying houses. And without substantial increases in wages, buyers are only buying homes they could afford to buy, not homes they will be able to afford when large raises increase their buying power. Large increases in wages are not happening.
LINK–PEW RESEARCH CENTER–For Most U.S. workers, real wages have barely budged in decades
With interest rates going up, the increases in payments are balancing off the increases in wages. Buyers can only afford to offer what they can afford to pay now, with little in the way of future raises entering the equation.
The housing market has slowed. Slow, and getting slower. Not dropping, not crashing, not an over-heated bubble. Slow.
As a buyer, I make my best offer, it is all I can afford. Oh, and by the way, I won’t have money to improve it any time soon, so I only want a home that is ready to live in. Well-manicured homes are being offered what they are currently worth. Homes that are selling are Pinterest-ready. Homes needing upgrading with deferred maintenance are less attractive to buyers in this market.
The housing market is slower, but not in danger. Homes that are in good condition are selling in a reasonable amount of time for prices close to the previous sales prices of like homes. Homes priced too aggressively are dropping their prices and spending more time on the market. The market remains good, but slower than it used to be.
Have wonderful holidays. Talk to you next year.
Chuck
