Let’s get the bad news over with. Only two major bad news indicators. But important ones.
First, we just experienced an inverted yield curve. Twice. Many economists say you should grab your recession umbrellas.
The second one worries me more, the ISM Purchasing Managers Index. I was a purchasing manager for 15 years. When a manufacturing operation needs to increase their production, change the product they are manufacturing, or decrease their production, purchasing is one of the first groups notified. They need to know what the future holds. Production cannot be increased or changed without the correct materials and packaging being available, and a decrease in production prescribes a slowdown or cancellation of raw material and packaging orders,. Why? Because inventory will quickly grow, tying up both dollars and precious storage space. This index has been around since the 1970s, and has proven to be a good short-term indicator of production planning. If the index is above 50, more than 50% of production sites are planning increases. When the index falls below 50, planners are pulling back and cutbacks are being planned. This index is weighted by the size of the company and industry reporting.
The PMI index in September 2019 dropped to 47.8, from 49.1 the previous month. This is the steepest month of contraction in the manufacturing sector since June 2009. When production declines, factories begin layoffs, and consumer purchases, which have been the recent force behind our economic expansion, weaken.
Arguing against those reports are the employment figures for September. Unemployment dropped to 3.5%, the lowest since 1969. This does not really balance my two concerns above, because employment figures are a report on the past, whereas the other indicators foretell the future.
While it is important to understand the general economic picture, the housing market has gone its own way. For the past 24 months we have seen sales stagnate and prices increase only moderately, if at all. That has changed in the past month (at least in our little part of the world). Sales are very strong, inventory is very weak. And prices are responding, finally moving upward.
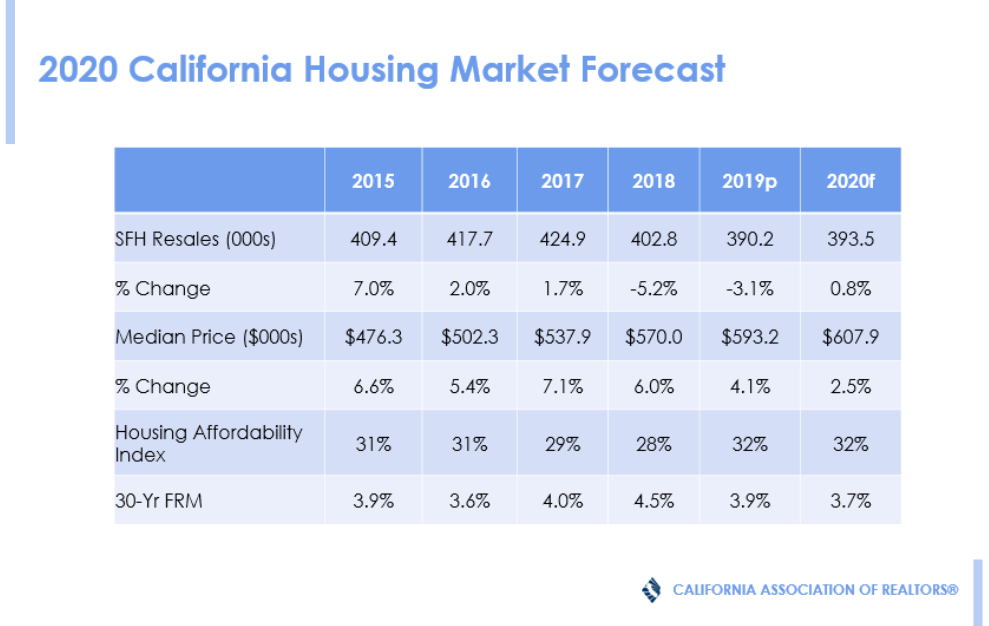
Hey, doesn’t everyone know that California has a housing shortage? Supply and Demand theory tells us to expect strong price increases. For the past two years, housing has been in a recession, with state figures showing decreases in the number of homes sold, down 5.2% in 2018and down 3.1% in 2019. See the chart below. And while the number of sales was decreasing, prices were increasing.
Locally we have had strong sales and declining inventory, but the market has been defying the rule of supply/demand that tells us when supply is weak and demand is strong, prices rise. Our local market has now turned the corner, pricing is no longer anemic, and prices are beginning to perform as they should.
A more macroeconomic picture can be gained by viewing the 2020 forecast from California’s premier housing economist, Leslie Appleton-Young. 2019 is only 75% complete, so the 2019 number reflects what the results will probably be by the end of the year. Affordability may be the biggest factor preventing the market from doing better, as well as the outflow of residents to other states. We are losing people who want to live here because they cannot afford to live here.
After two years of housing’s own private recession, Leslie is forecasting higher sales and higher prices. The real wild card in the chart below is interest rates. Those affect affordability and the inclination of buyers to buy. Home buyers find low interest rates hard to pass up. What will happen with the economy? Will the Fed push interest rates even lower? Then there is the pressure of SALT making home buying in California less attractive. And it’s an election year. Anyone out there got a really good crystal ball they want to sell?
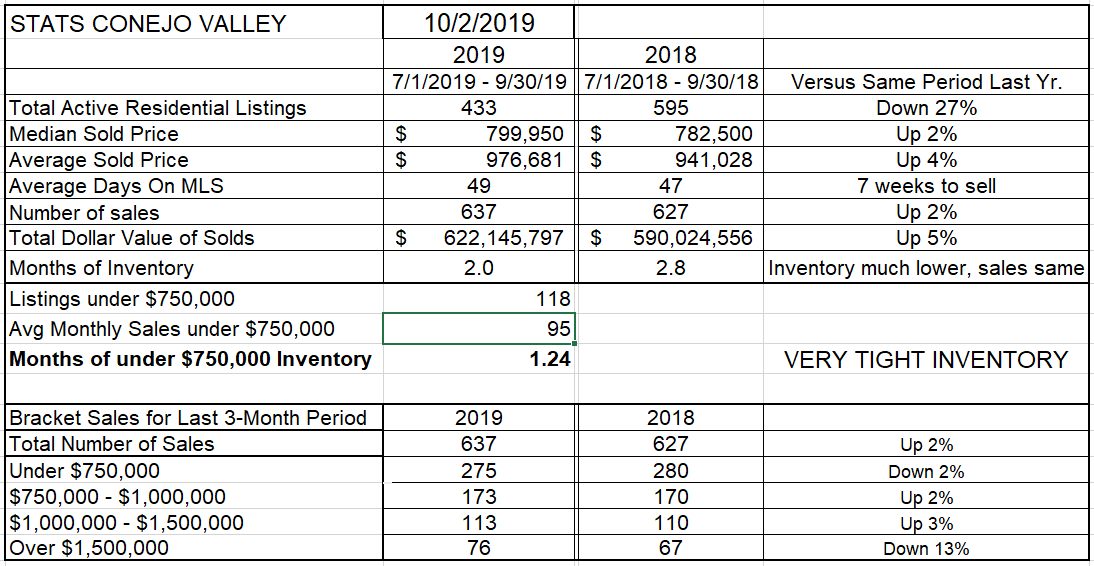
Time to see how the 2019 figures compare to our area. First, Conejo Valley. Remember that I compare most of these figures based on a three-month view, July, August and September of 2019 compared to the same months in 2018. Inventory is down significantly, by 27%. Prices are up 2-4%, but have recently been trending higher, and will most likely hit the 4% state figure estimate. The number of sales in these periods is up 3% and trending higher, much stronger than the state figures above. The computation of Months of Inventory is drastically lower than last year, only two months worth of inventory. This is due to a much lower inventory and slightly higher sales numbers.
For sales brackets, the under $750,000 number is down because there are so few homes available in that category, limiting sales. The next two categories are up, but the highest category, over $1.5 million, is decidedly less active. Is this because there is less inventory available? Or Salt?
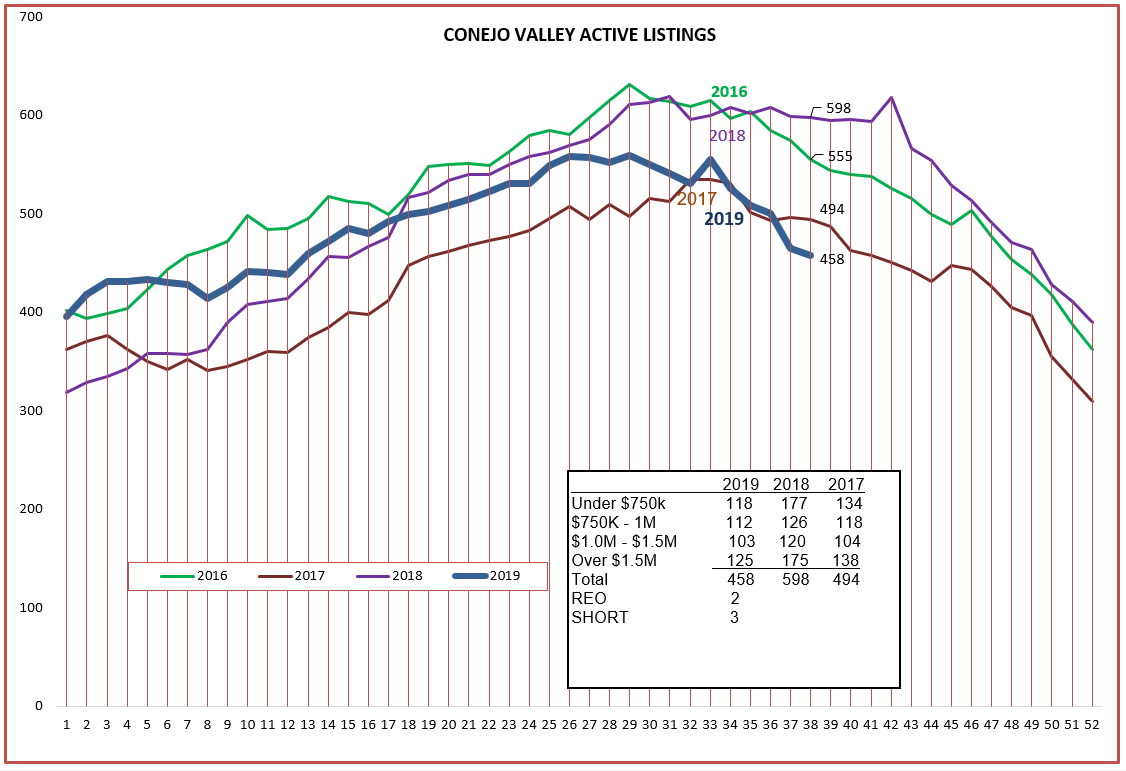
Actually, inventory is lower across the board. Look at the inset box in the chart below. All the numbers are below last year, and very similar to what they were in 2017. That was the year we were questioning whether the lack of inventory was limiting sales. Probably yes.
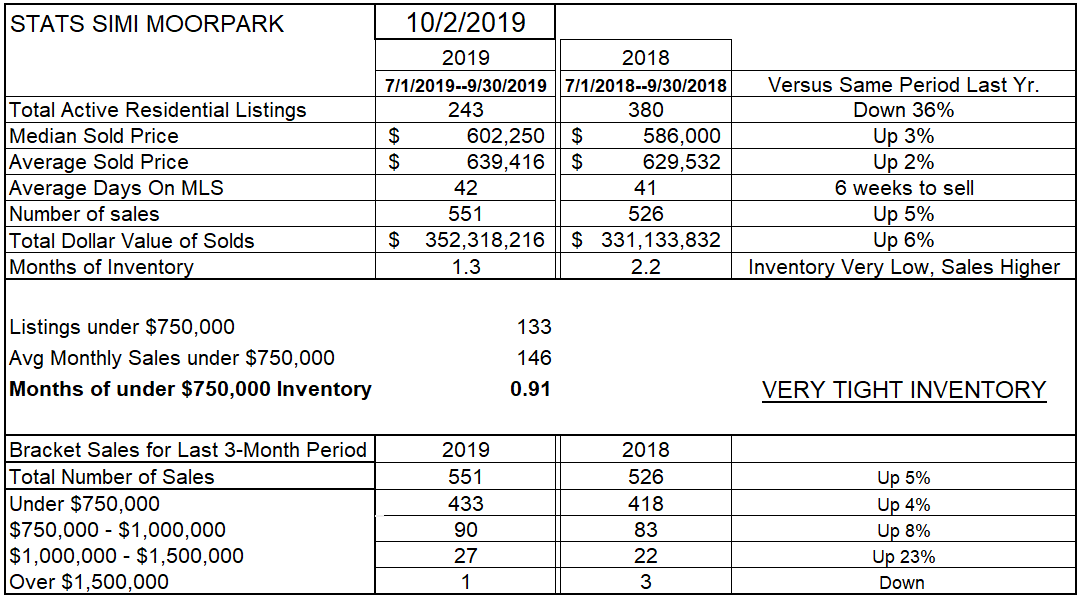
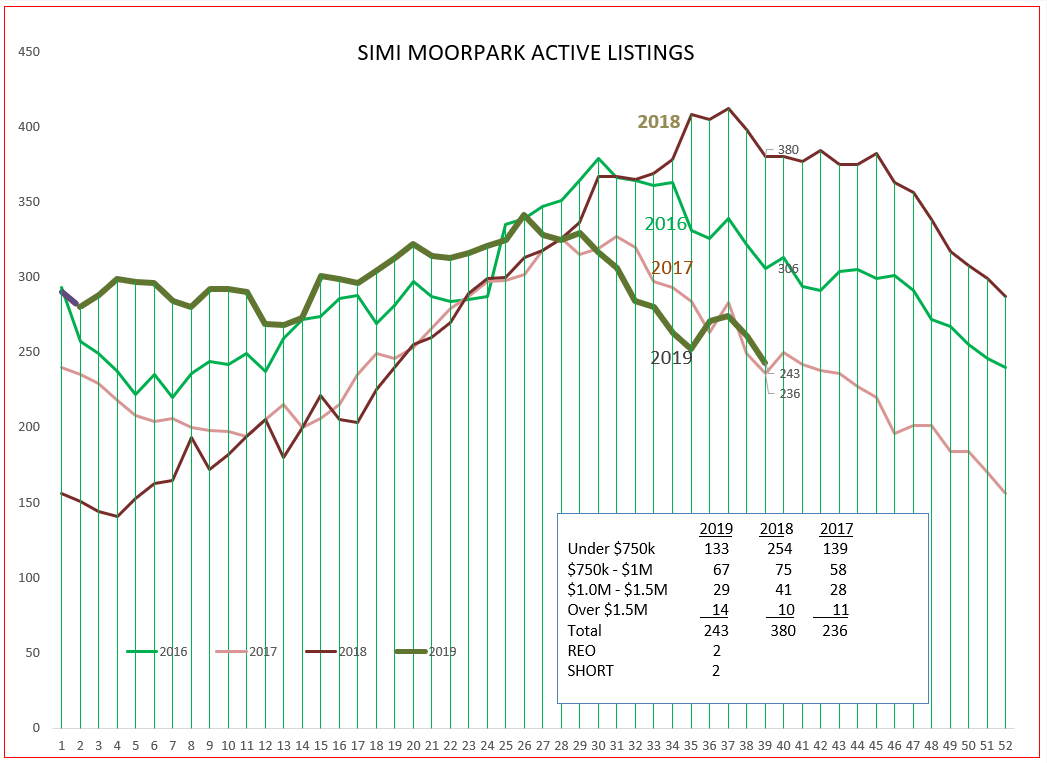
Let’s go to SImi Valley and Moorpark and compare what we see above. Inventory down even more, by 36%. Prices up 2-3%, but trending much higher recently. Sales up 5%. But look at the Months of Inventory. For all price ranges, only 1.3 months, and for properties priced below $750,000, only 9/10 of one month.
The comparison above for properties priced above $1 million is difficult to analyze because the numbers are much lower in Simi/Moorpark. But the number of home sales below $1 million is very strong, much stronger than the state forecast. Prices are in line with the forecast, but should beat the forecast because prices are experiencing recent strength. Let,s see what a 36% lower inventory looks like on a chart, below
. Hmm, 2017 all over again. And 2017 saw strong price increases, just as we are beginning to experience this month.
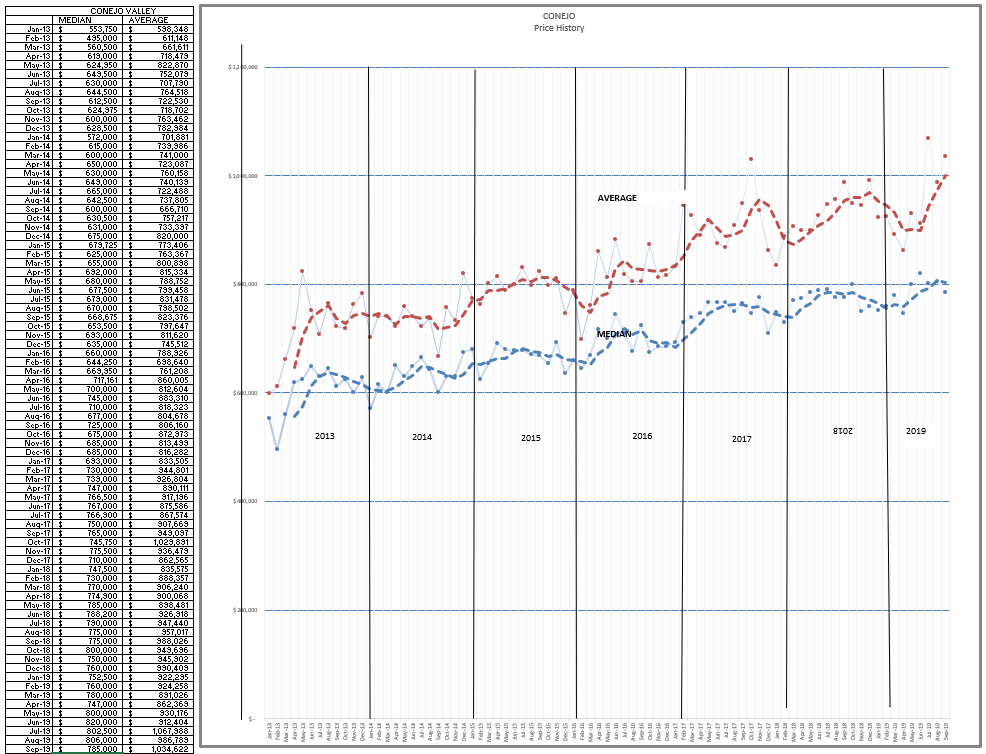
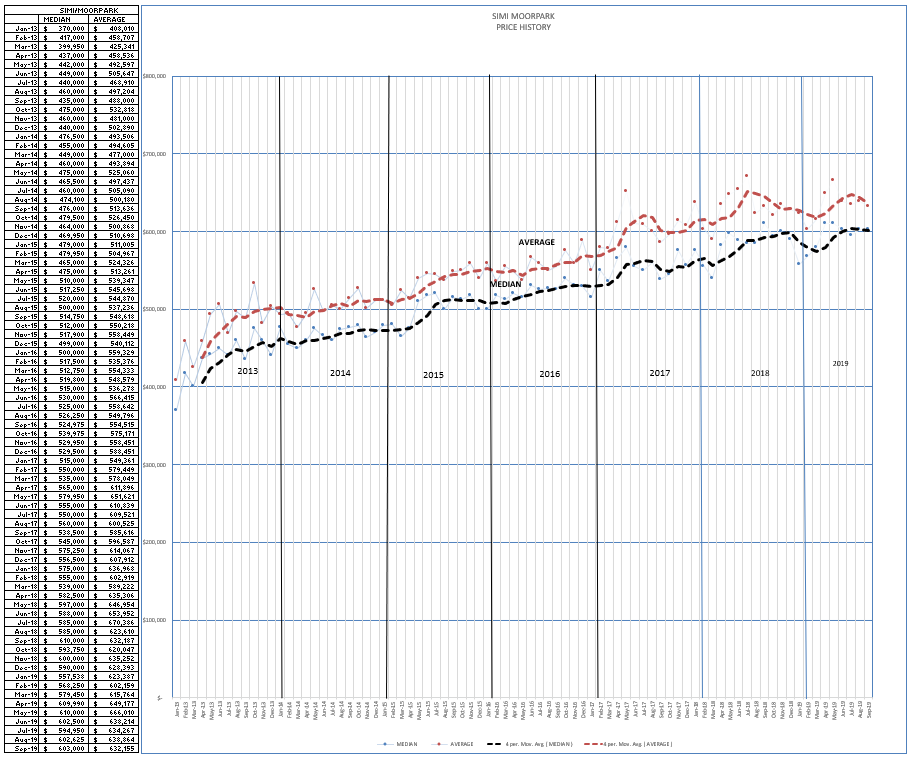
Finally, let’s look at the price charts. Both areas showing strong growth.
How is the market? It is healthy, it is strong, we wish we had more inventory. Prices are on the increase.
Stop the conversation there. If you start looking for all the economic storm clouds for the general economy, you can find them. Limit your conversation to housing. Housing was a disaster in the last horrible recession. It may be the bright spot in any coming recession. We already had our housing recession, for the past couple of years. We are stronger now, we are coming out of our recession.
Have a prosperous month.
Chuck
