Except for the apparent repeal of the law of supply and demand, everything seems to be progressing well.
You remember that supply, demand and pricing are all interrelated. If supply goes up, prices go down. If demand goes up, prices go up. However, where the housing market is concerned, there seems to be a disconnect.
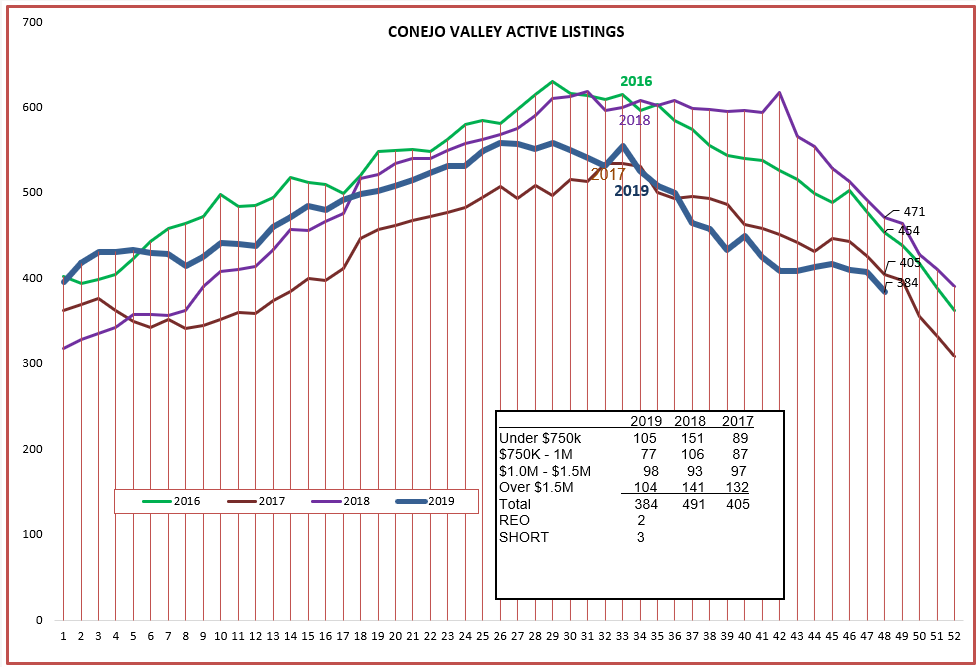
Let’s look at the supply side, Conejo first. The curve is progressing as expected, inventory growing into the summer months and then getting lower and lower as we approach the year-end holidays. It looks like we will finish with the lowest inventory in the past few years.
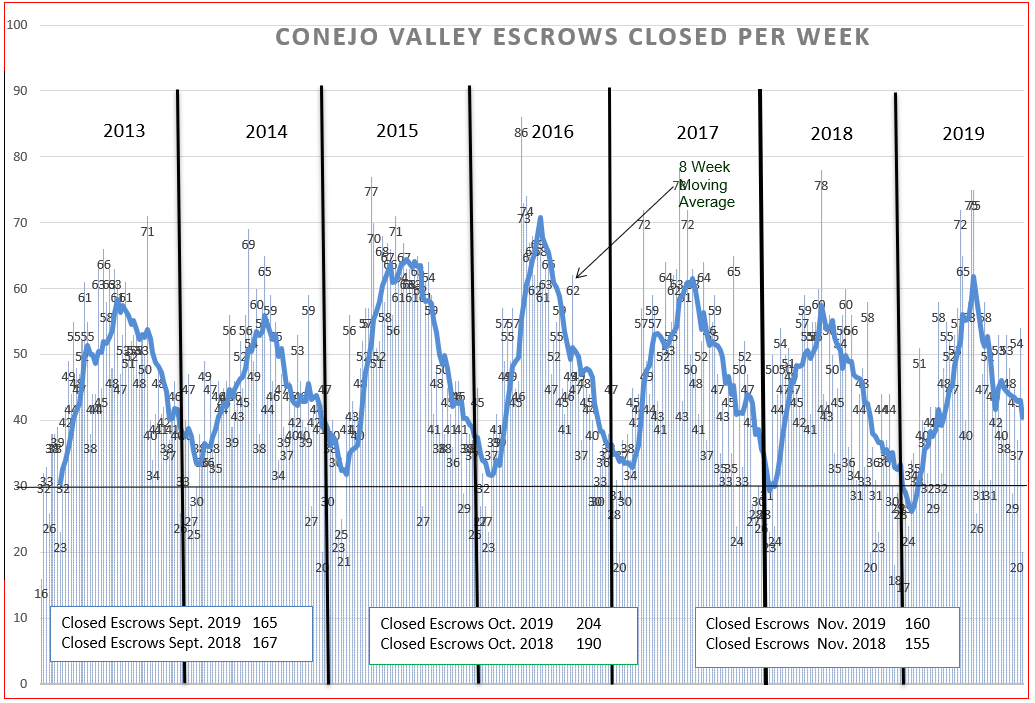
How about demand? The chart of Closed Escrows should give us the best indication of how many buyers were really serious and actually purchased a home. It has been a good year, one in which the top end of the market progressed slowly, but ended the year strong. Looking at the monthly boxes in the chart below, sales are very similar to last year.
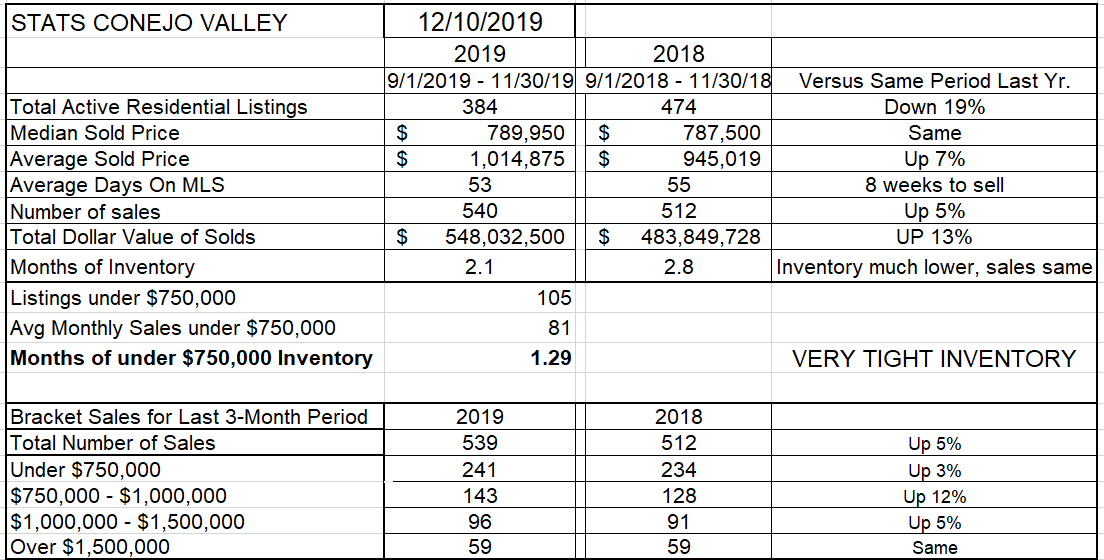
Let’s look at these statistics together on one page. Inventory lower by 19%. Months of inventory, how long it would take to sell our inventory based on the current rate of sales, a very low two months worth. Only 5 weeks worth of inventory for homes priced below $750,000. Total number of sales up by 5%. Lower inventory should mean higher prices. Higher sales should mean higher prices. But the Median price, compared to last year, is the same. The Average Sold price, compared to last year, is much higher, up 7%. The second half of the year saw the return of higher priced home sales, creating that increasing spread between the Median and Average Sold price. The total number of units sold (the bottom half of the chart below) in each pricing category increased, again comparing the past three months with those same three months a year ago, with the biggest increase in homes priced between $750,00 AND $1,000,000.
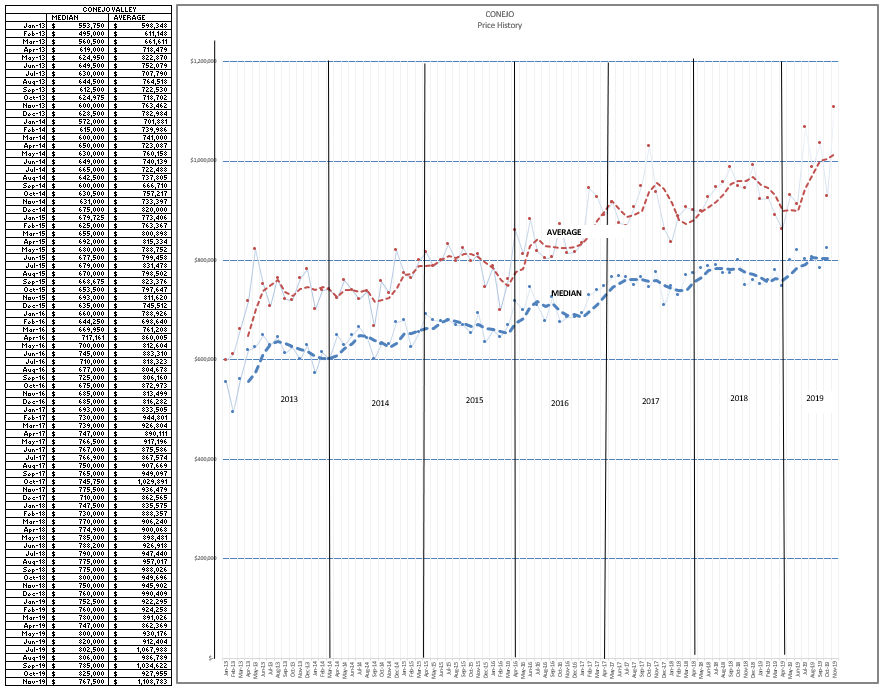
Finally, looking at the graph below, you can see how the Median price has flattened, while the Average price has recently soared. High priced sales are responsible for the Average Price increasing, and distancing itself from the Median price. However, the Median price should also have increased, and it has not. Seasonal pressure? Maybe.
For the Conejo Valley, we are looking at a good market, spread throughout the range of prices.
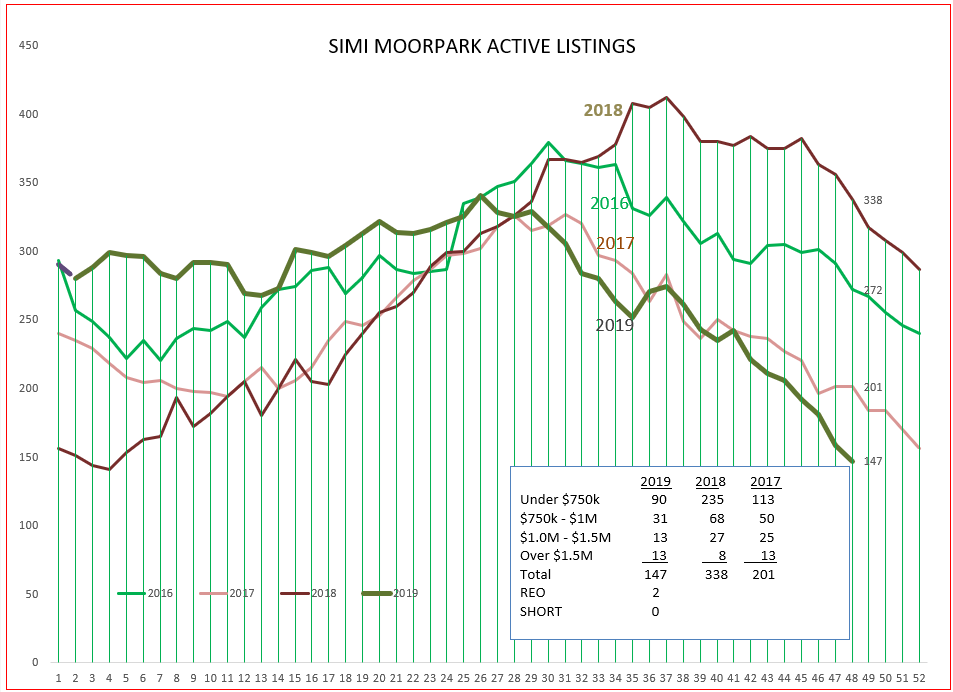
Now let’s look at Simi Valley/Moorpark. First, the inventory. Historically low, at least in this century. 2012 (114 listings to end the year) was the previous year of lowest inventory, and we appear on track to challenge that record.
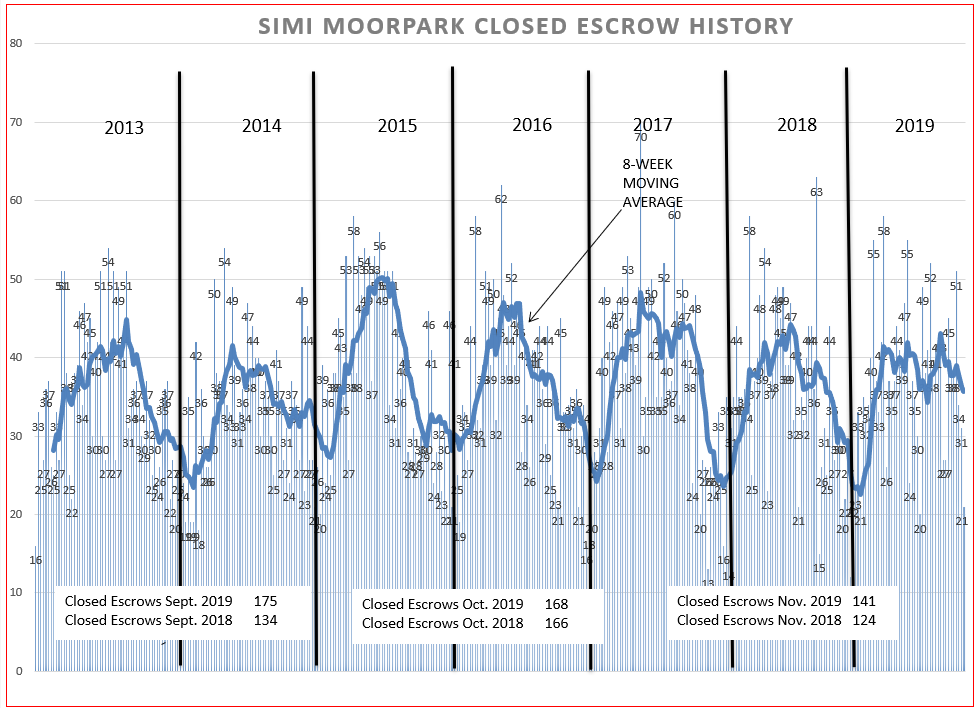
Sales in Simi/Moorpark continue at an elevated pace, refusing to taper off as the year ends. Sales have been higher than last year, in spite of the lack of inventory.
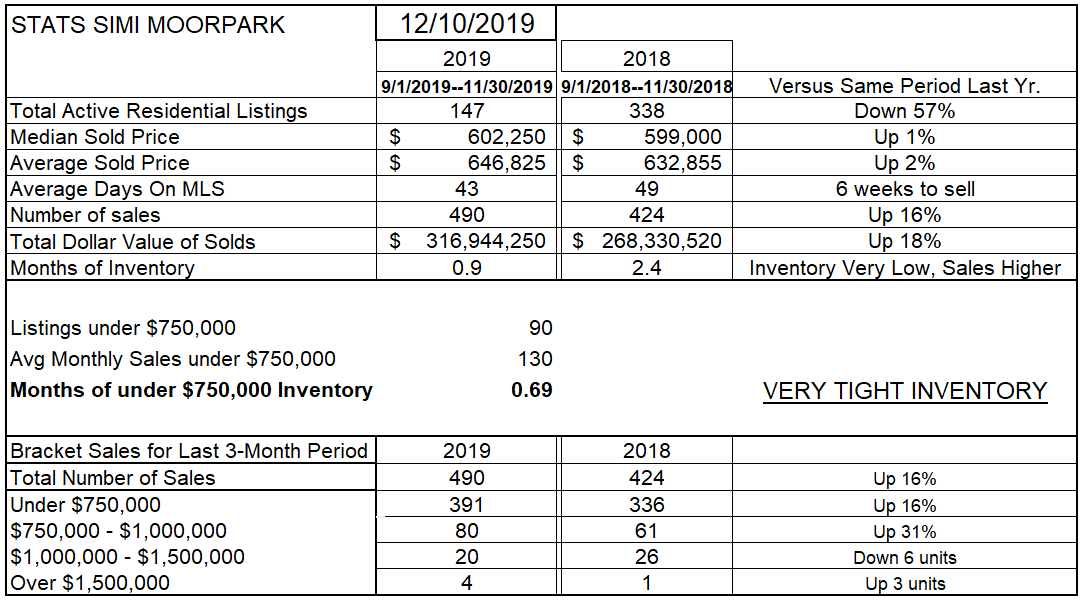
The numbers in the comparison chart below show the extremes that Simi/Moorpark has been experiencing. Inventory is down 57% from last year, and sales are up 16%. But look at prices, up only 1-2%. As I proposed last month, I believe affordability and desirability are fighting it out in Simi/Moopark. Prices have hit the glass ceiling.
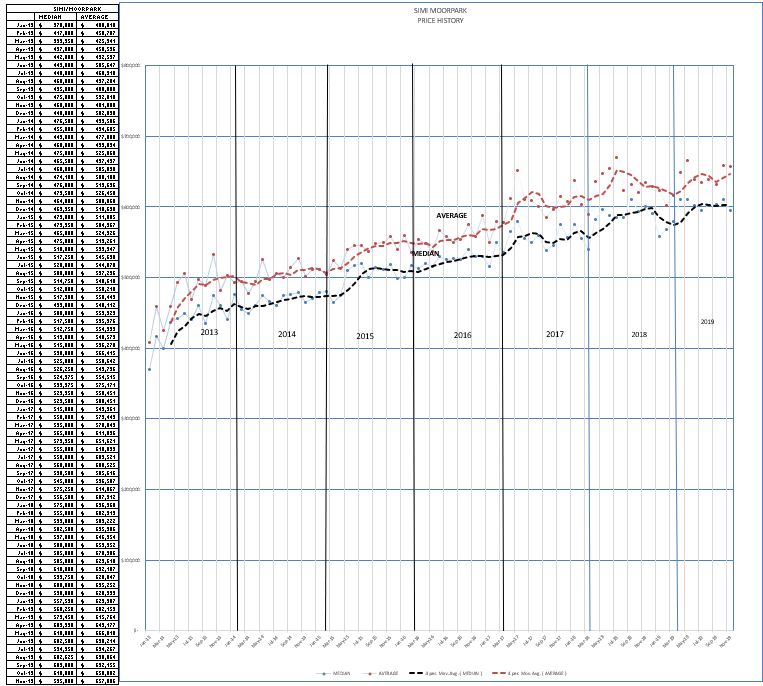
The pricing chart below is populated with monthly sales pries, not averages over three months. The Median price has flattened at $600,000.
The Simi/Moopark market is frankly exciting. Lots going on, with buyers begging for more inventory. There is less than one month worth of inventory overall, and only 2-3 weeks worth of inventory for the under-$750,000 price range.
I wish you personally a happy and healthy new year. Prospects for the market are for continued health in 2020.
Chuck
