As I close out 2019, I am reminded of the threats we faced throughout the year. Talk of recession, the inverted yield curve (twice), deductions limited by SALT, concerns of another bubble, there were lots of black swans. But they all failed to have a lasting effect.
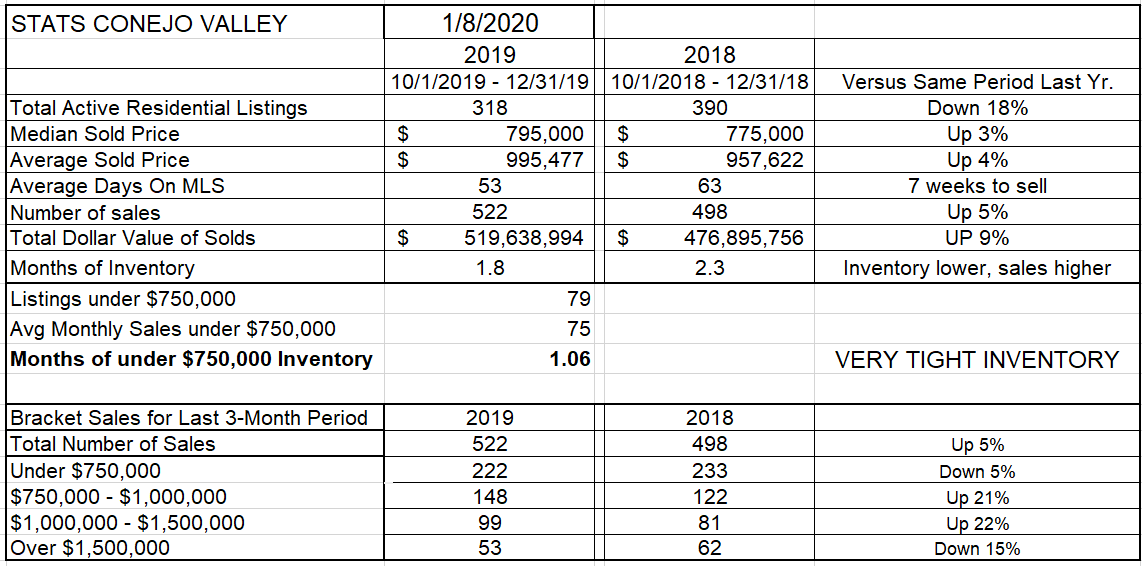
For the Conejo Valley, the number of sales was up 5% in the recent 3-month period compared to last year, with prices up 3-4%. However, for the entire year, sales figures were practically a repeat of 2018, so we started slow but finished strong. If things were turning down, inventory would climb. Instead of building, inventory was down 18%, a positive sign for the future. Homes got sold 10 days faster than they did last year, and the inventory only represents 1.8 months worth of sales, only one month worth of sales for properties priced below $750,000. Even though the number of highest priced home sales were down (by 9 homes) those homes priced between $750,000 and $1.5 million were up 21-22% versus sales last year. A phenomenal report.
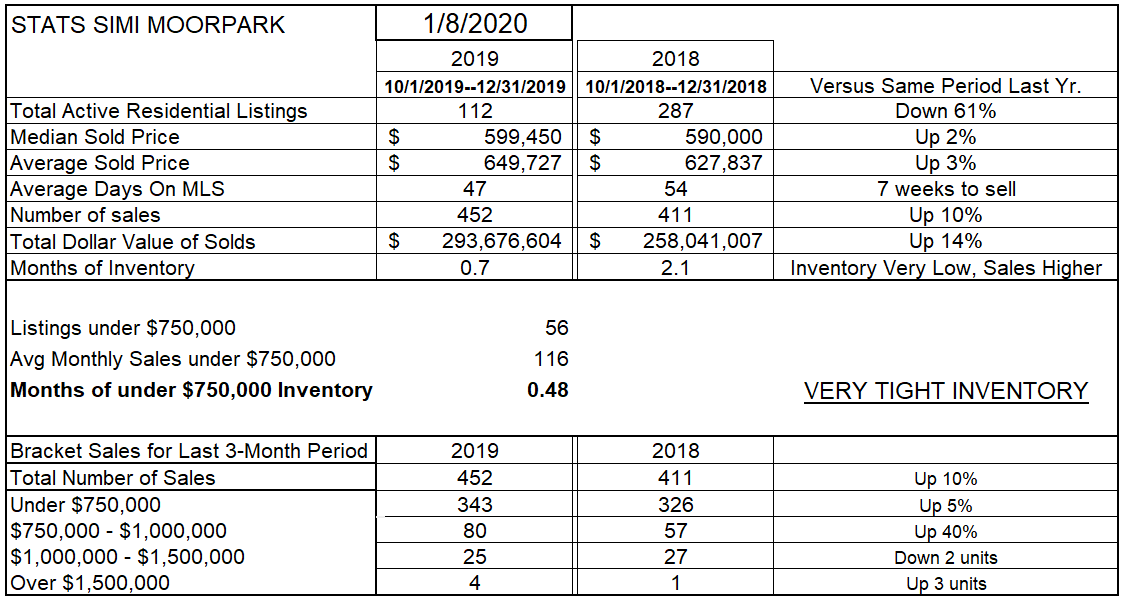
The results in Simi Valley and Moorpark were even more positive. The number of sales was up 10% in the recent 3-month period compared to last year, with prices up a very conservative 2-3%. Inventory is very scarce, down 61% from last year, somewhat of a concern. Hotcakes should sell so fast. Homes got sold 7 days faster than they did last year, and THE INVENTORY REPRESENTS ONLY THREE WEEKS WORTH OF SALES, only two weeks worth of sales for properties priced below $750,000. The lack of inventory is surely a factor in limiting sales from going even higher. For the year, 2019 was basically dead even with 2018 in total sales.
All that good news, lower inventory, higher sales numbers, practically record-low mortgage rates, historically low unemployment, has not caused pricing to skyrocket. If anything, prices are lagging where we might expect them to be. There is no pricing bubble, but there may be a pricing glass ceiling.
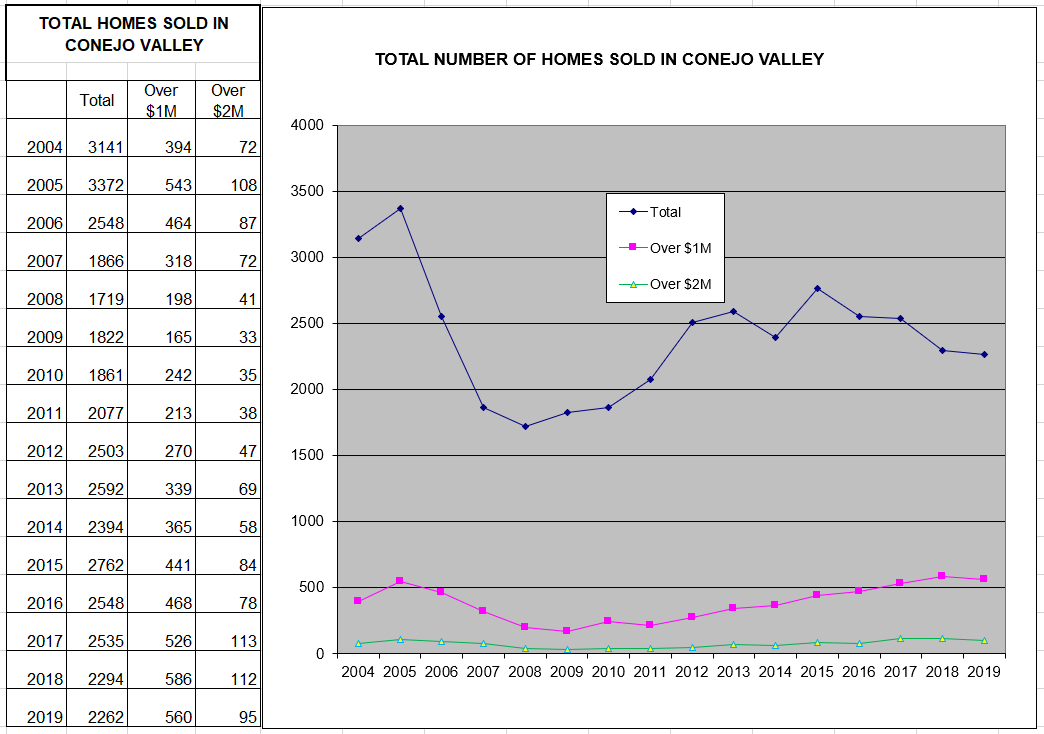
At this time of year, let’s look at how sales activity this year compares to past years. For Conejo, the total number of homes sold each year has been tapering off for four years. However, the number of homes priced between $1-2 million has been steadily increasing. Prices continue to rise, and for the Conejo Valley, the “sweet spot” for home purchases is around $1 million.
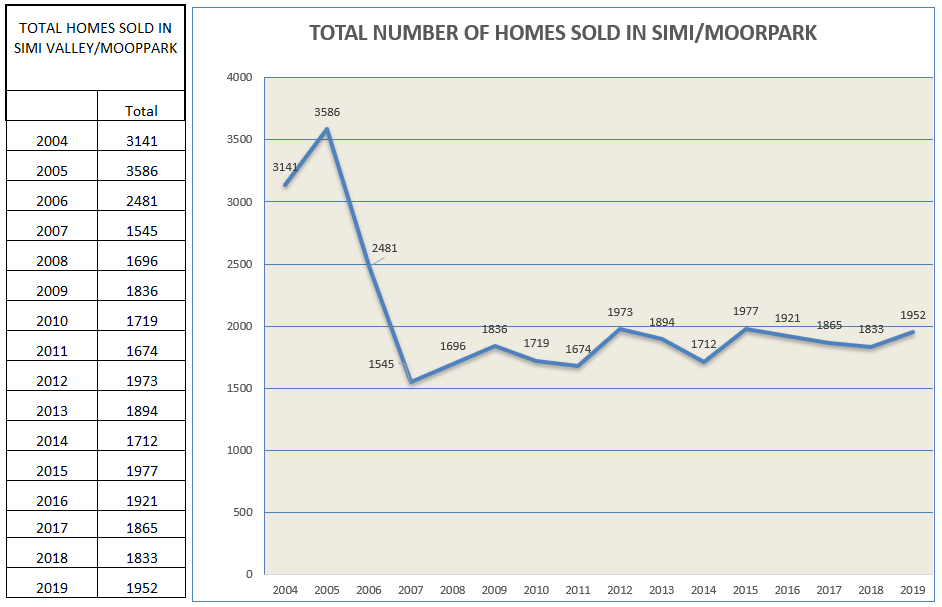
For Simi Valley and Moorpark, the number of homes sold yearly has been pretty consistent, as their median price of $600,000 is more affordable to more buyers. Although Simi/Moopark experienced the same tapering off over the past three years, this last year reversed the trend.
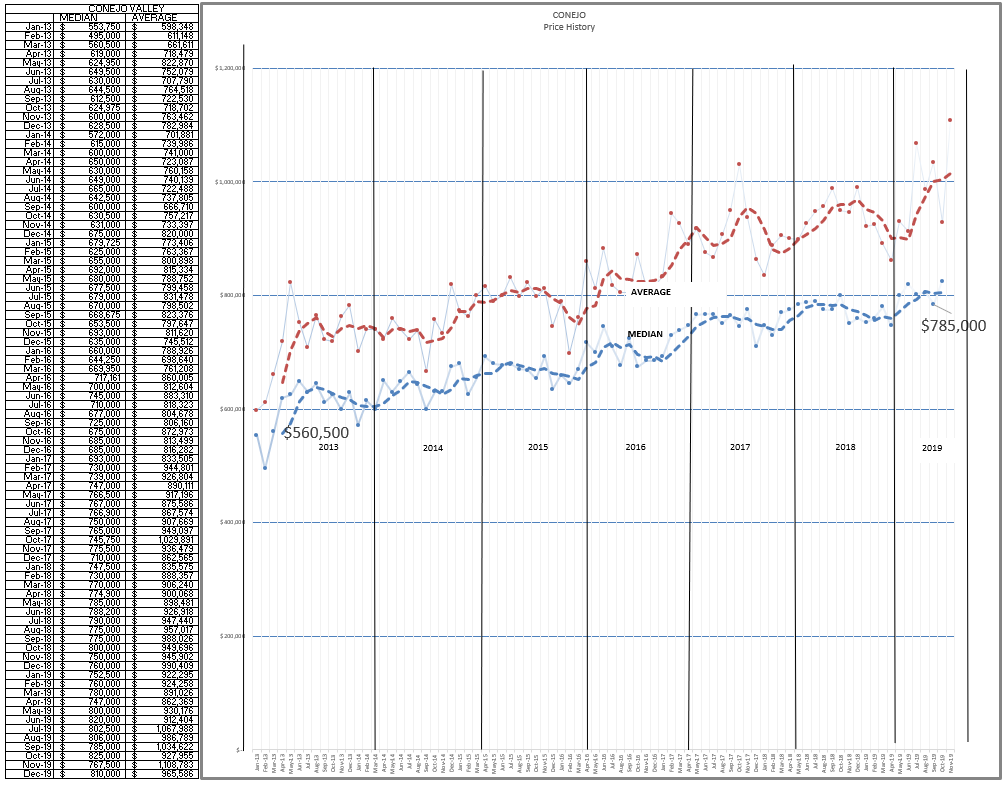
Sales price increases have been fairly consistent for the past 6 years, consistent but moderate. While the Median price has been increasing at a steady and expected rate, the Conejo Average price has been meandering due to the number of high priced homes as a percentage of total home sales, and the difference between the Average and median is now at the largest spread seen over the past seven years. The Median priced home in 2013 ($560,500) now sells for $785,000, a seven year increase of 40% or a rough average of just under 6% per year.
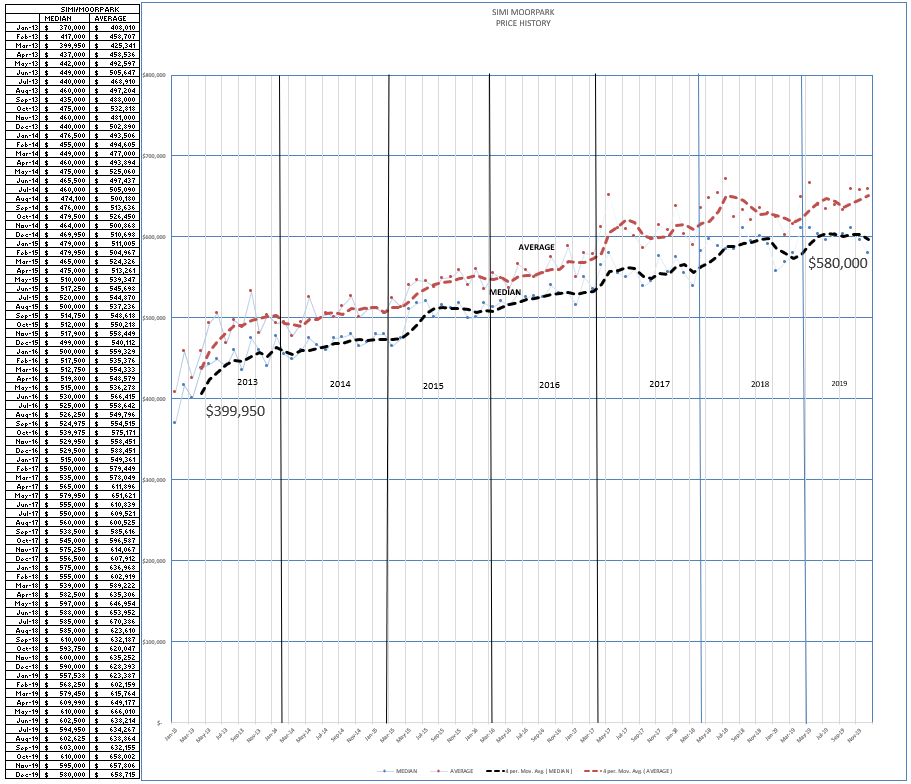
The price chart for Simi/Moorpark is not as influenced by high priced homes as a percentage of total sales, with fewer sales over $1 million compared to Conejo. You can tell your clients that the average priced home in 2013 ($400,000) now sells for $580,000, a total increase of 45% or a rough average of well over 6% per year.
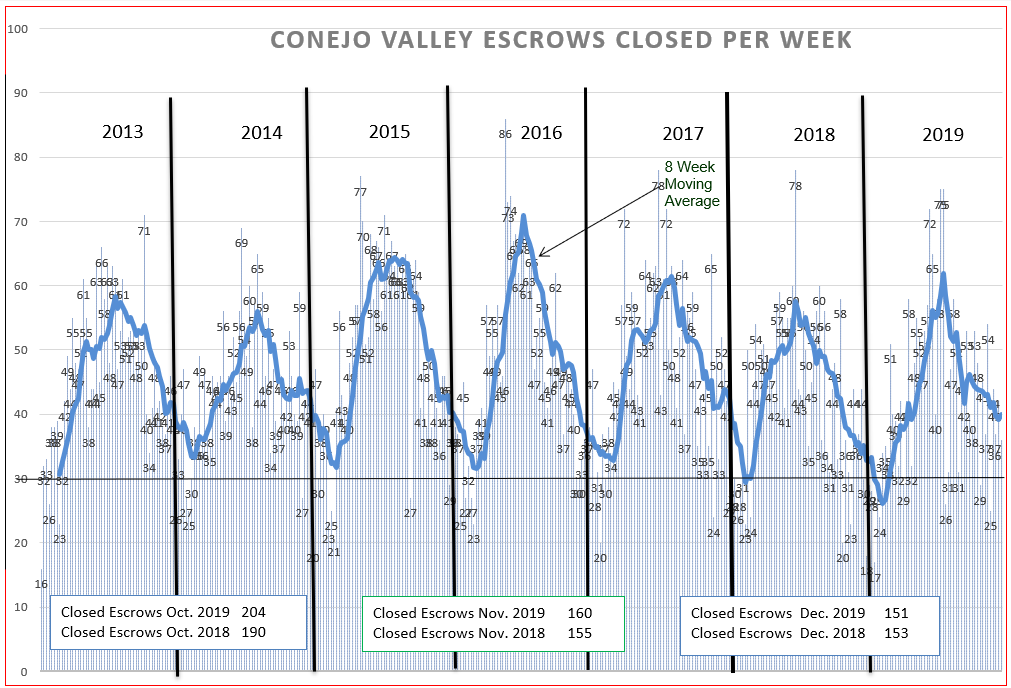
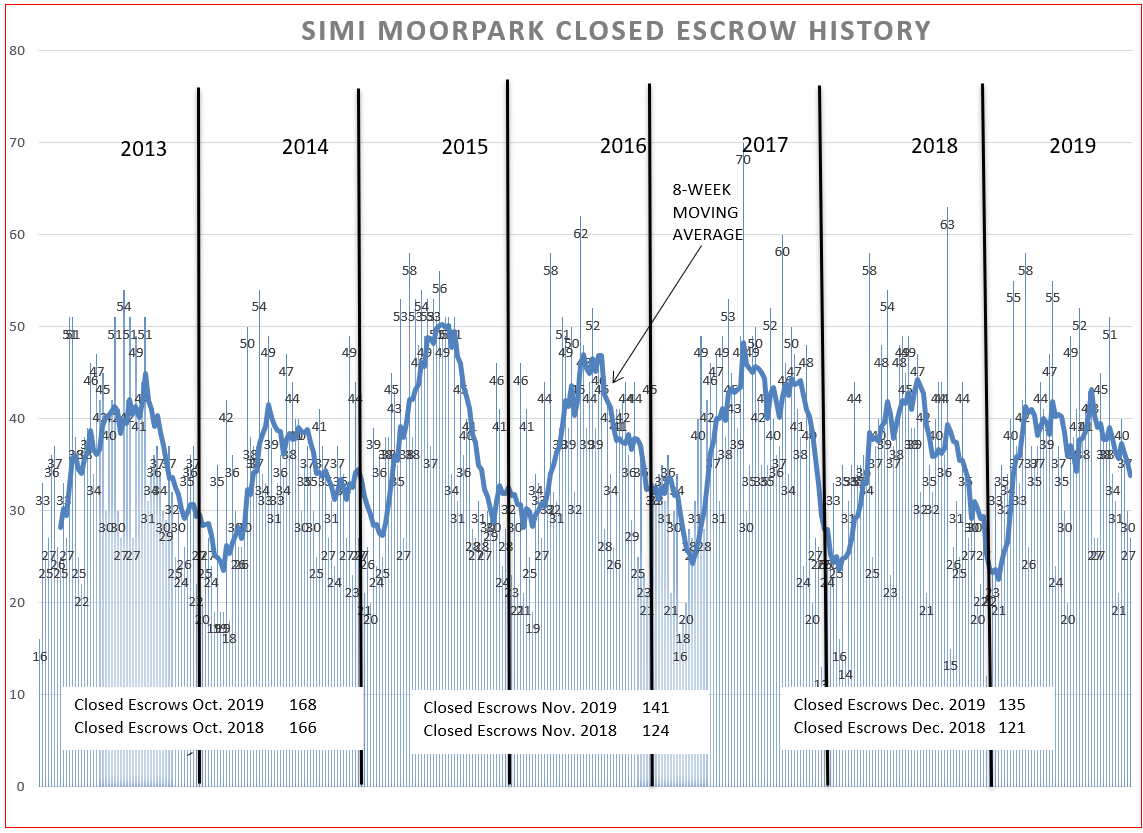
To complete the charts, I want to present a different look to the charts I have been using. The previous chart used weekly sales figures combined with an 8-week moving average to create a picture of the total sales closed. Also included is a box for each of the past three months comparing closed escrows for that month with the same month the previous year.
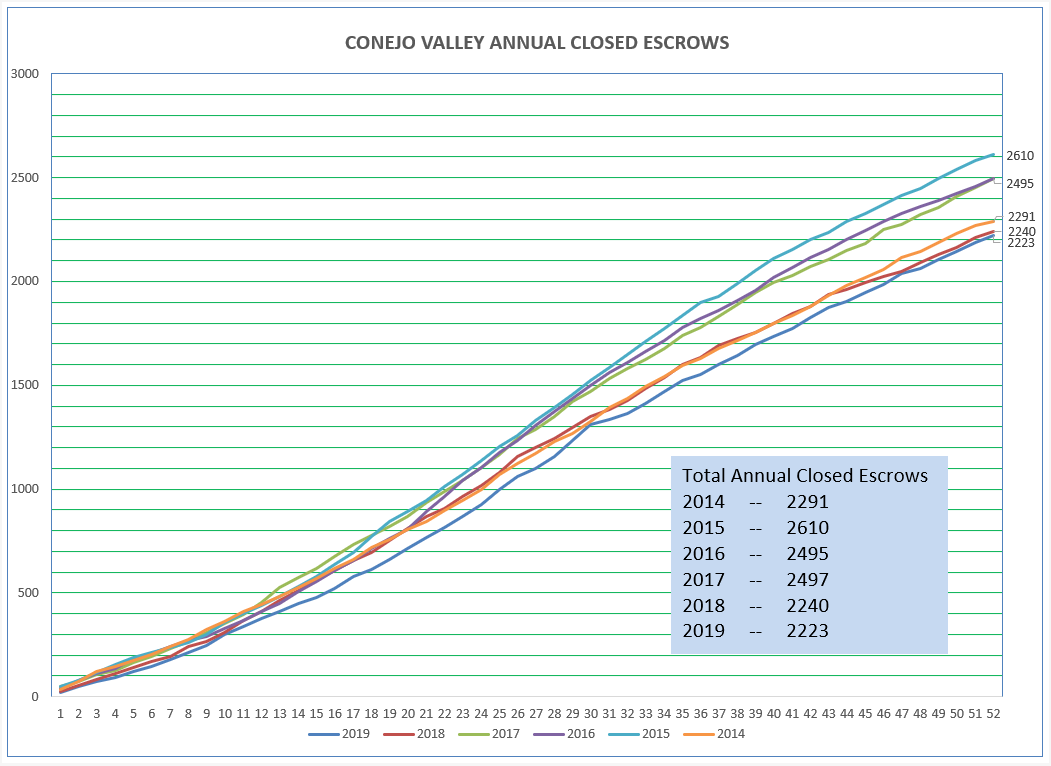
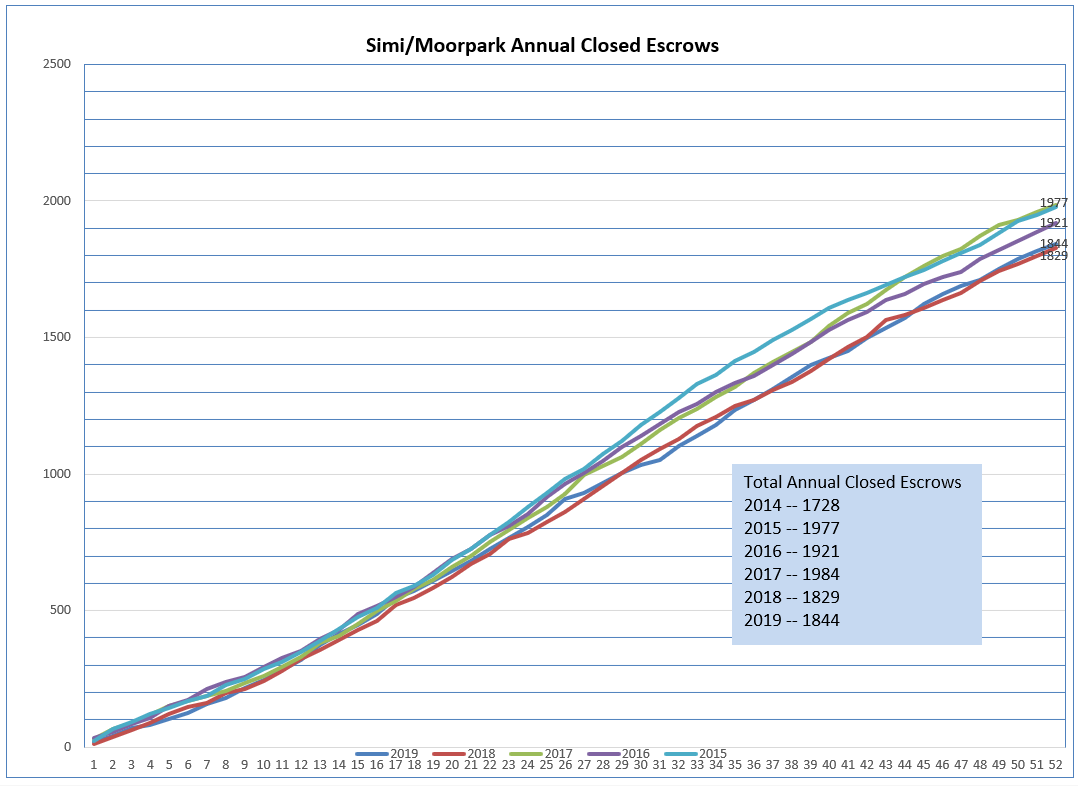
Here is a different way to look at the same data. The chart below tracks the total number of sales to date, with each week providing an increase from the previous total. Even though 2019 ended up a good year, it was the lowest total sales figure for the past seven years, a drop of 15% from the highest year shown, 2015.
The charts for Simi Valley/Moorpark are below.
The above chart shows a strong sales finish to 2019 for Simi/Moopark. Unlike Conejo, 2019 was not the lowest number of sales in the past seven years. The chart below displays that the sales volume in Simi/Moopark is very reliable, varying from a low of 1728 in 2014 to a high of 1984 in 2017. 2019 came in right in the middle, at 1844 transactions, 7% lower than the highest year and 7% higher than the lowest year.
All looks good. Is there anything to worry about? Sure, those black swans are always hiding out. The purchasing managers index still indicates a slowdown, and it is an election year, with Washington trying to continue the good news so they can get re-elected. As we have seen in recent news coverage, anything can happen.
I think this will be a good year for housing. Even though we lack inventory, prices have remained under control. It will be a good year to get a good value for the home you are selling and a good year to get a fair price on the home you are buying.
Have a wonderful 2020.
Chuck
