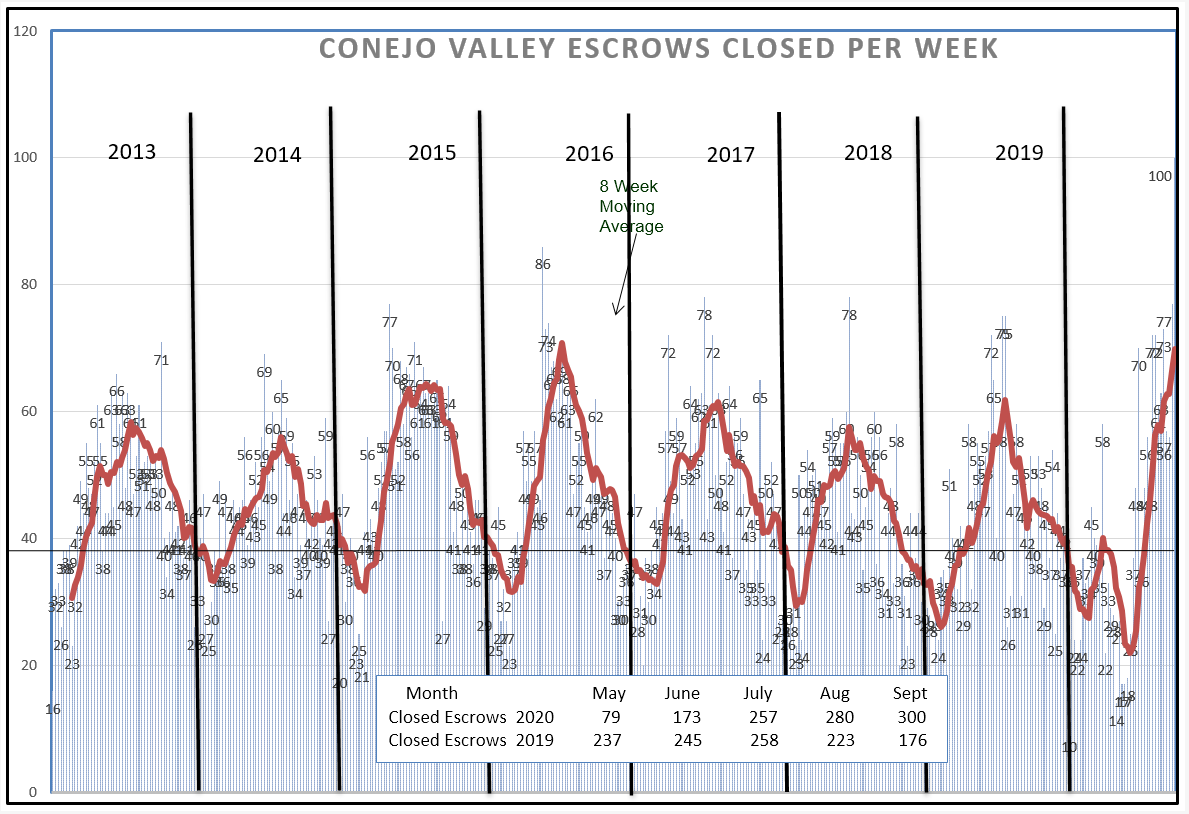
What a year this has been. The best way to begin this discussion is by directing your attention to the box within the chart below. The pandemic began to affect our economy in mid-March. Our real estate market, and most other markets, took a major hit. Compare how many escrows closed in May 2019 ( 237) to May 2020 (79). These closed escrows were opened from mid-March to mid-April, the beginning of the coronavirus shutdown. But then look at what happened in the following months. First, a quick recovery. And now, tending towards what prior Fed chair Alan Greenspan may have termed “irrational exuberance”. In May, we experienced a drastic decrease in closed escrows. Considering how difficult it is to sell homes, including no open houses, unattended inspections, no door-knocking, there seems to be no limit to the desire to buy homes, in all price ranges. Sales levels are the strongest they have been in the past 10 years.
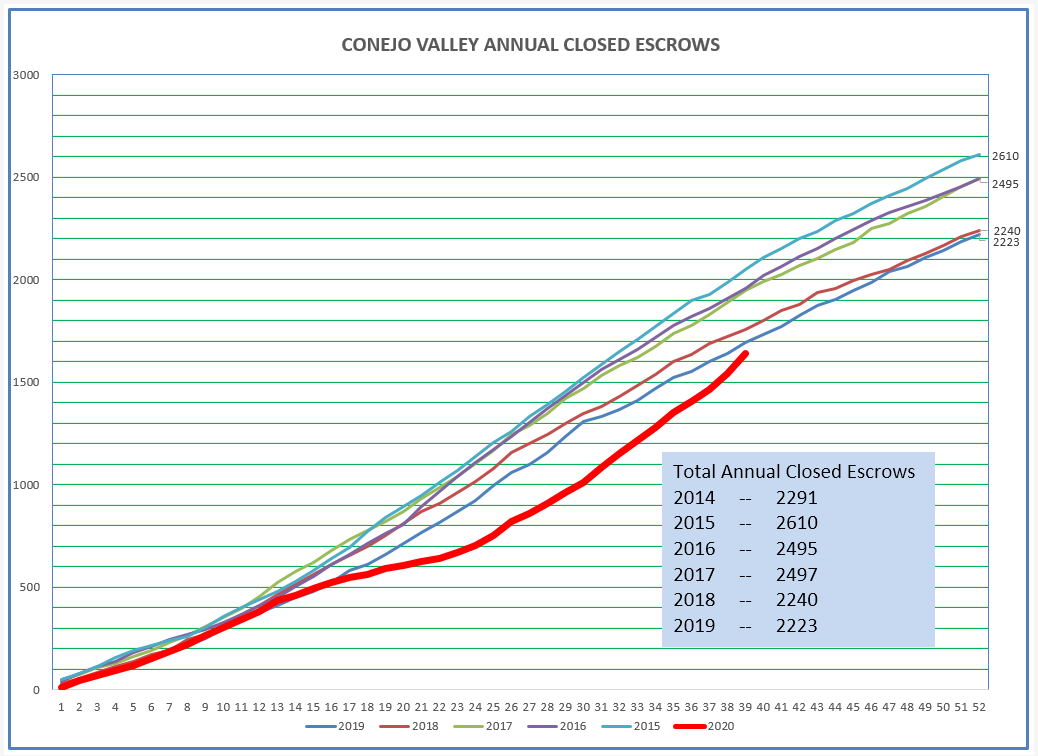
Still looking at closed statistics, below is the same information presented in a different way. This graph shows the total number of escrows since the beginning of the respective years, over time. The 2020 red line displays the dip that began in May, and then the stabilization of sales volume, and recently the strong uptick in sales, much stronger than in previous years. The market is making up the transactions lost due to the April-May slowdown, and now is growing strongly.
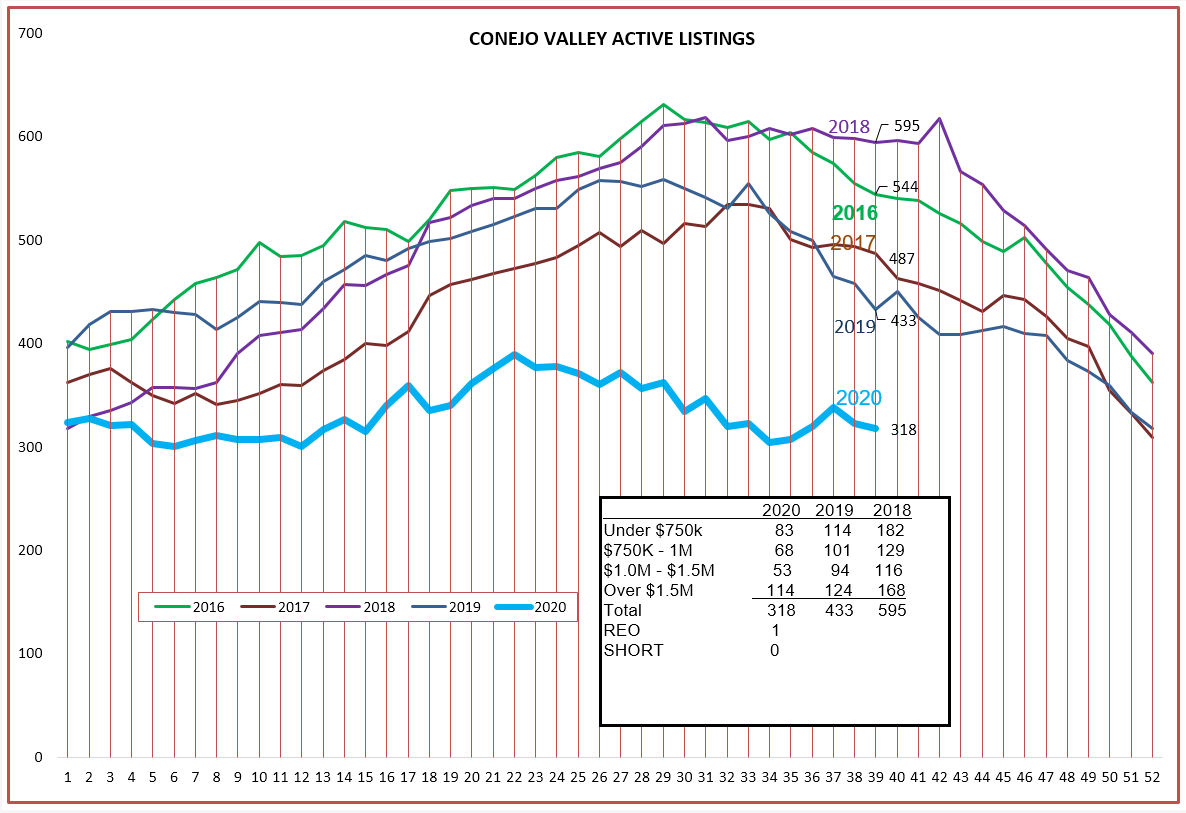
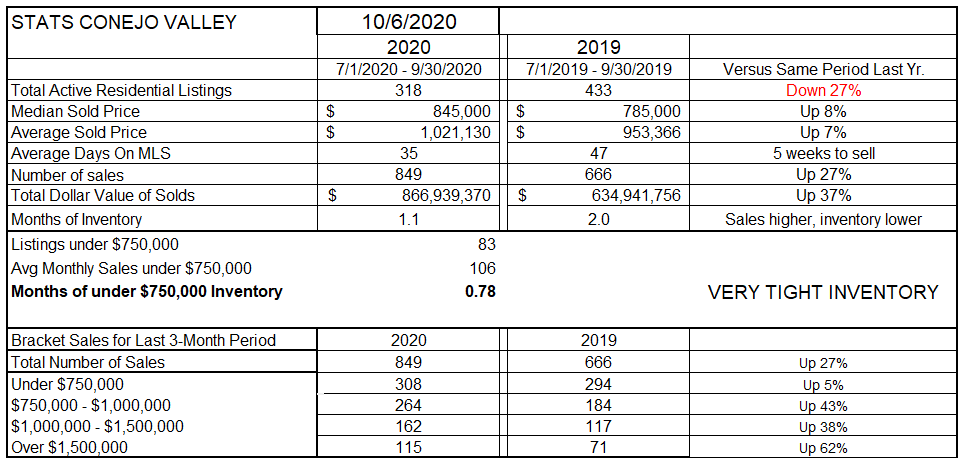
Let’s next look at inventory. Due to strong demand, homes are quickly being sold. In January, the inventory began at a low level, as it did in 2018. However, in 2018 the inventory grew to almost twice the number at the beginning of the year, and at the end of September stood at 595. For 2020, the inventory has not grown at all, ending September at only 318.
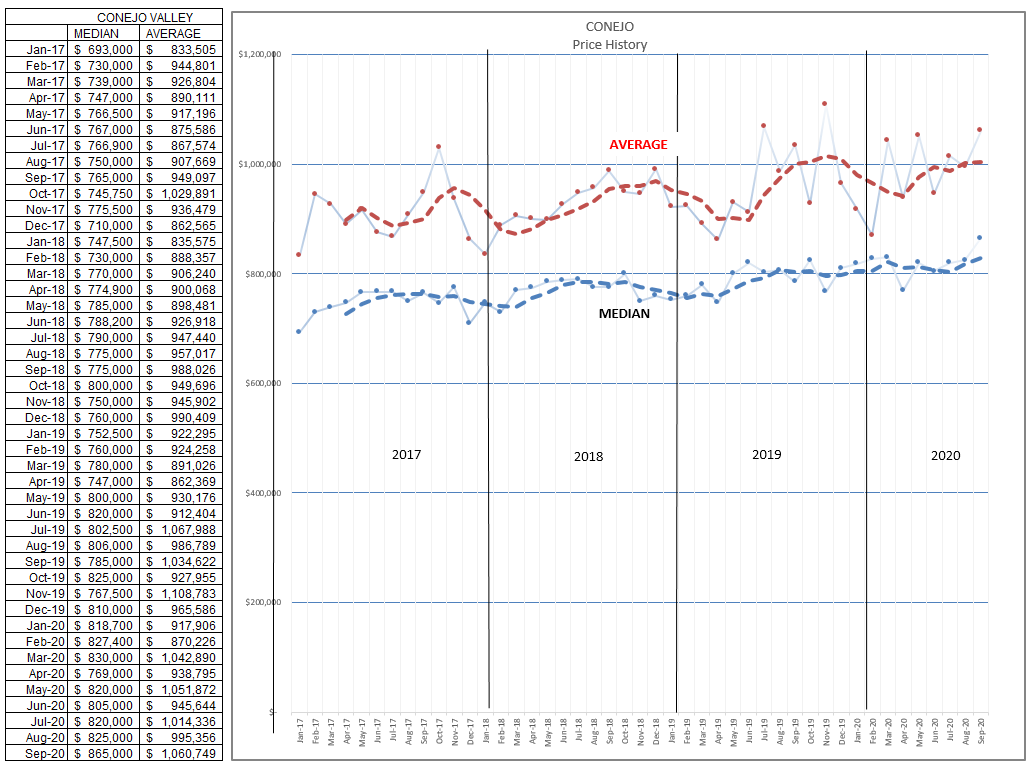
The combination of very strong demand and relatively low inventory should produce an increase in prices (Economics 101). Below is the pricing chart showing the monthly (monthly, not a three-month average) of closed escrows. The January 2017 median price of $700,000 has recently surpassed $865,000, an annual increase of 4-5%. This median has been reasonably stable over the past year at $800,000, but took a large jump during the pandemic. The Average price has reacted strongly during the latter half of 2019 due to extremely strong sales of the highest-priced homes. Prices are strong and trending higher.
The statistics in the chart below are mainly comparisons over the span of three months, compared to the same three months in 2019. For these three months, the drop in inventory of 27% in conjunction with the increase in sales of 27% has resulted in price increase of 7-9%. We only have a one-month supply of homes for sale. Look at the bottom of the chart to see how strong sales are in every price category.
Compare the return on investment of 7-8% with the return on investment return on bonds, with the FED rate close to zero. Certificates of Deposit, currently about the same for 1-year and 5-year terms, are around 0.5% (Bankrate.com). Borrowed money is apparently not in short supply, but homes sure are.
New York and San Francisco are experiencing major declines in rental rates (10%). People are moving to the suburbs, and luckily we are in the suburbs. The pandemic has convince many that working can be done from home, and has changed the equation of where they want to live versus how far they have to drive to work. Not for everybody, but for a significant percentage of our workforce.
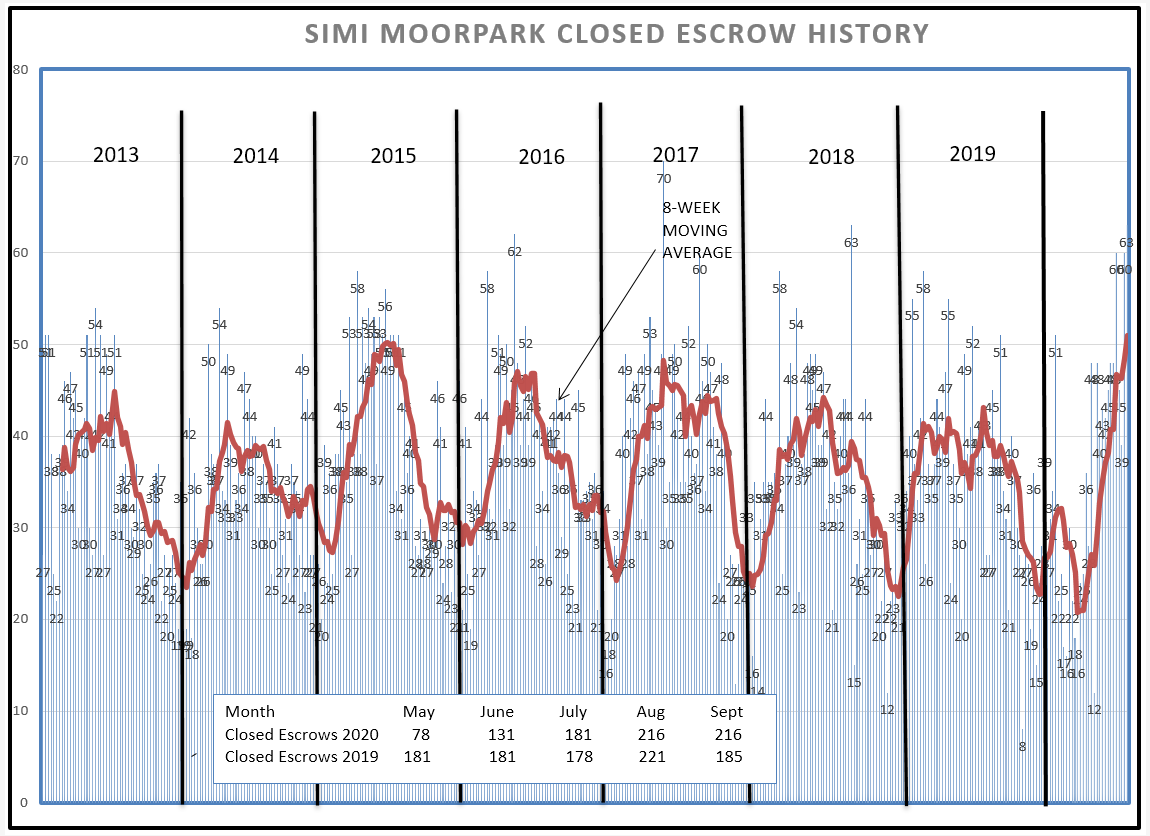
The story in Simi Valley and Moorpark is the same, but different. Compared to Conejo, Simi/Moorpark has historically been lower priced, with a median of $600,000 versus $800,000 for the Conejo. This affordability has created a market in which sales numbers have been restricted by a lack of available inventory. Let’s begin by looking at the closed escrow charts, in particular the box within the chart.
In May, we experienced a drastic decrease in closed escrows. These escrows were initially contracted from mid-March to the end of April, the beginning of the coronavirus shutdown. June began a turnaround from the crisis. But then the market returned to the same levels experienced in 2019. I propose that sales would have dramatically increased were it not for a dire lack of inventory.
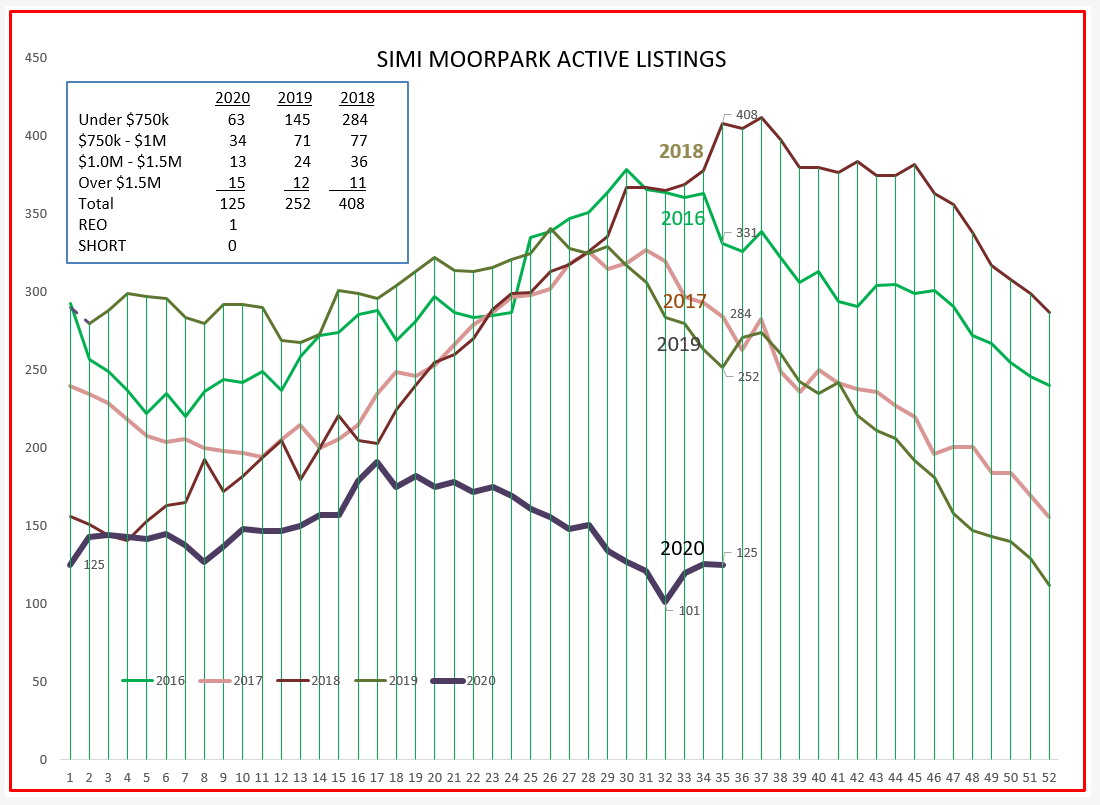
Why haven’t sales levels jumped similar to what was experienced by Conejo? The aforementioned lack of inventory. 125 homes for sale? That is almost no inventory at all.
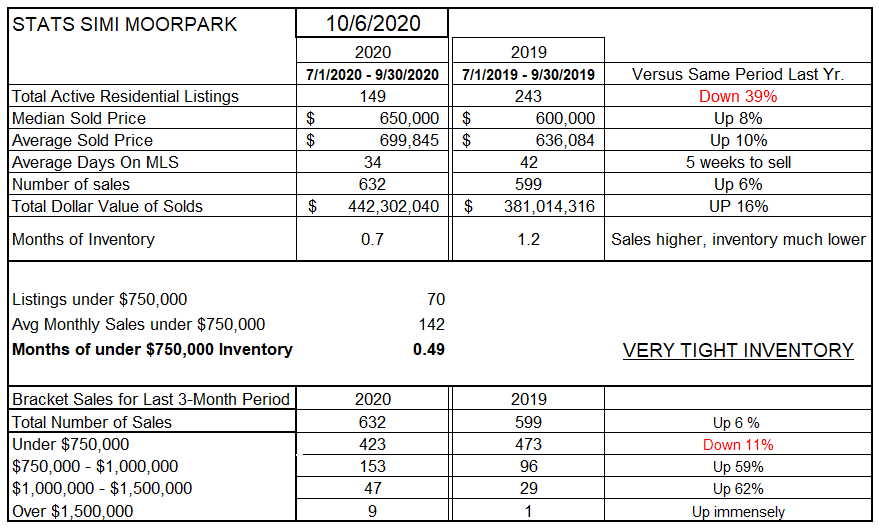
Let’s now look at the numbers without the graphs. Inventory is down 39% compared to 2019. Even with this low inventory, sales are up 6%, resulting in price increases of 8-10%. The inventory of all homes represents THREE WEEKS worth of sales, and the inventory of homes priced below $750,00 is only TWO WEEKS WORTH OF SALES. Over the three month period, sales of homes priced below $750,000 is down 11% from last year. If we could only find more inventory, that would quickly turn around. Sales are down due to lack of inventory, not due to lack of demand.
Even with sales restricted by the lack of inventory, sales have bounced back. The chart graph below shows the total number of escrows since the beginning of the respective years, over time. The 2020 red line displays the dip that began in May, and then the stabilization of sales volume. If inventory were available, this line would surely be quickly surpassing the experience of previous years.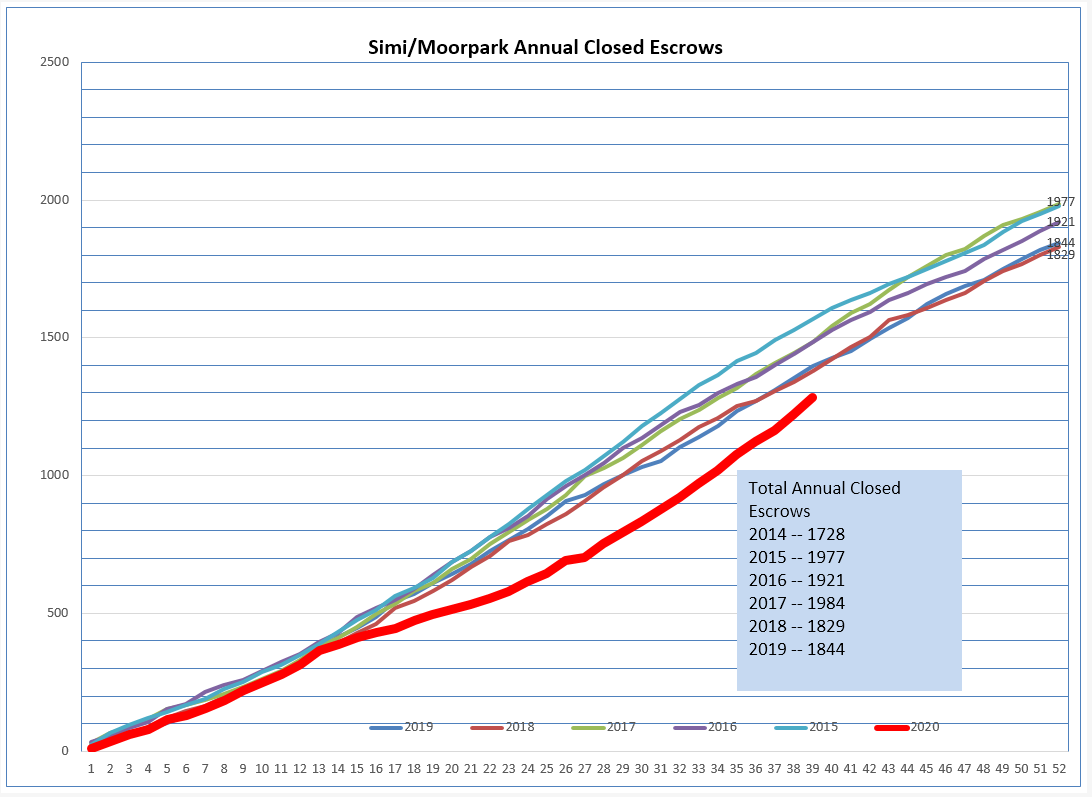
The market is strong. Very strong. This in spite of the difficulty of marketing homes for sale. Everything is virtual. In spite of this, sales continue to be strong. How long can this last? The coronavirus epidemic has served as a catalyst to changes already taking place, decreasing the time over which these changes normally take place. Changes like shopping online versus in malls, working from home, virtual versus in-person, decreasing both traffic and potentially mass transit needs. Lots of changes to how we live and work. Last year no one considered which room in a home was going to be used for Zoom. Long term interest rates are at historically low levels, and are expected to remain there. Agents who used to drive agents around in their cars are now becoming expert at virtual visits. Times they are a-changin’.
Stay smart, stay healthy, and use this time to develop the talents you need for this changing future.
Chuck
