Does Econ 101 still work? Are supply and demand and price still all related?
- When supply exceeds the balance between supply and demand, prices move lower.
- When demand exceeds the balance between supply and demand, prices move higher.
- When prices increase, it usually causes demand to decrease.
Where are we in this move to balance supply and demand and price?
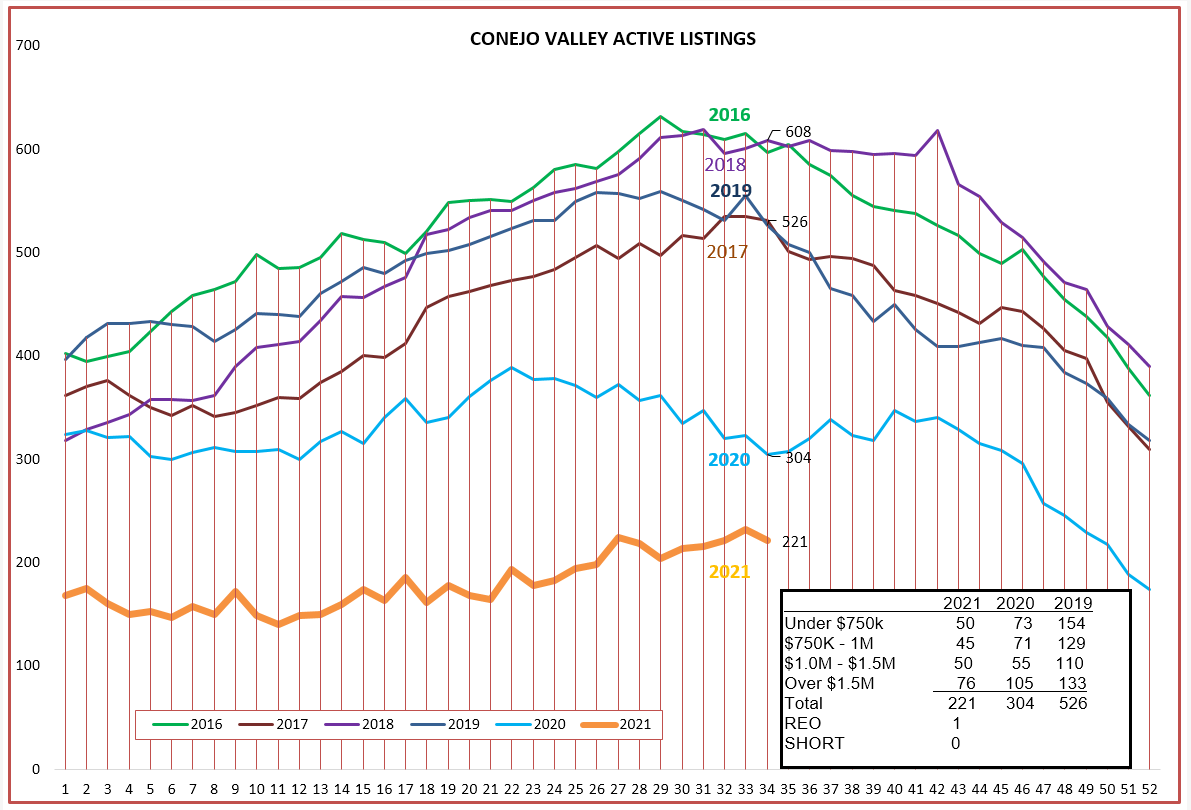
First, let’s look at supply. Static all year. Whatever went on the market sold as soon as it went on the market. The inventory was not increasing as it usually does during the first seven months of the year. Currently, available inventory is the lowest since 2016. Active listings of 221 homes compared to August sales of 275, inventory of less than a month worth of sales.
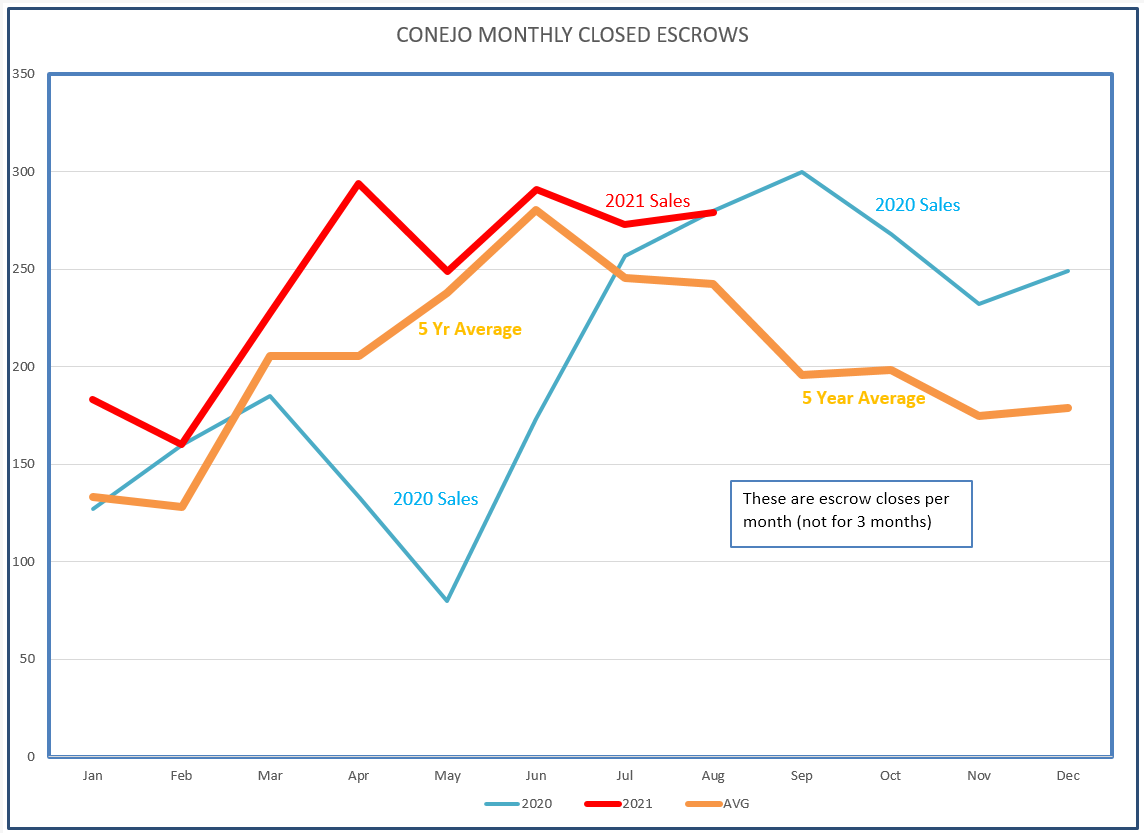
The above chart shows the inventory level compared to previous years. The chart below shows how closed escrows in 2020 and 2021 compare to the 5-year average sales curve, as shown by the orange line. Compare this to the blue 2020 line. The beginning of COVID in March 2020 caused a dramatic drop in closed escrows felt in May 2020. By July, Sales returned to what normally would be expected and then climbed solidly past the average of previous years. Next, compare the orange average sales line to the red 2021 sales line. Sales continued strongly in 2021 and then began to follow the average figures. As a result of major price increases, I expected 2021 sales to follow the orange 5-year line. However, 2021 sales now continue above expectations, with August sales extending the strong July number. Demand in our housing market remains very strong.
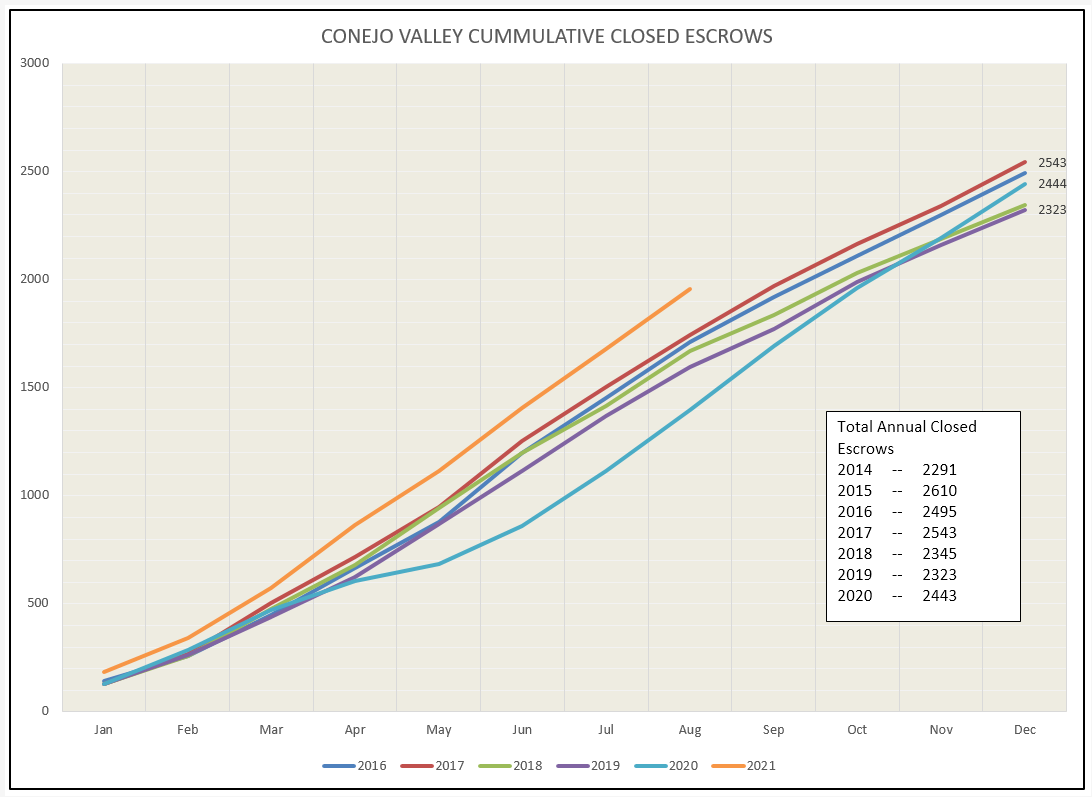
Another way of looking at sales in comparison to other years is through the cumulative escrows chart below. It basically displays the running total of closed escrows as the year progresses. 2021 is proving to be a record-setting sales year.
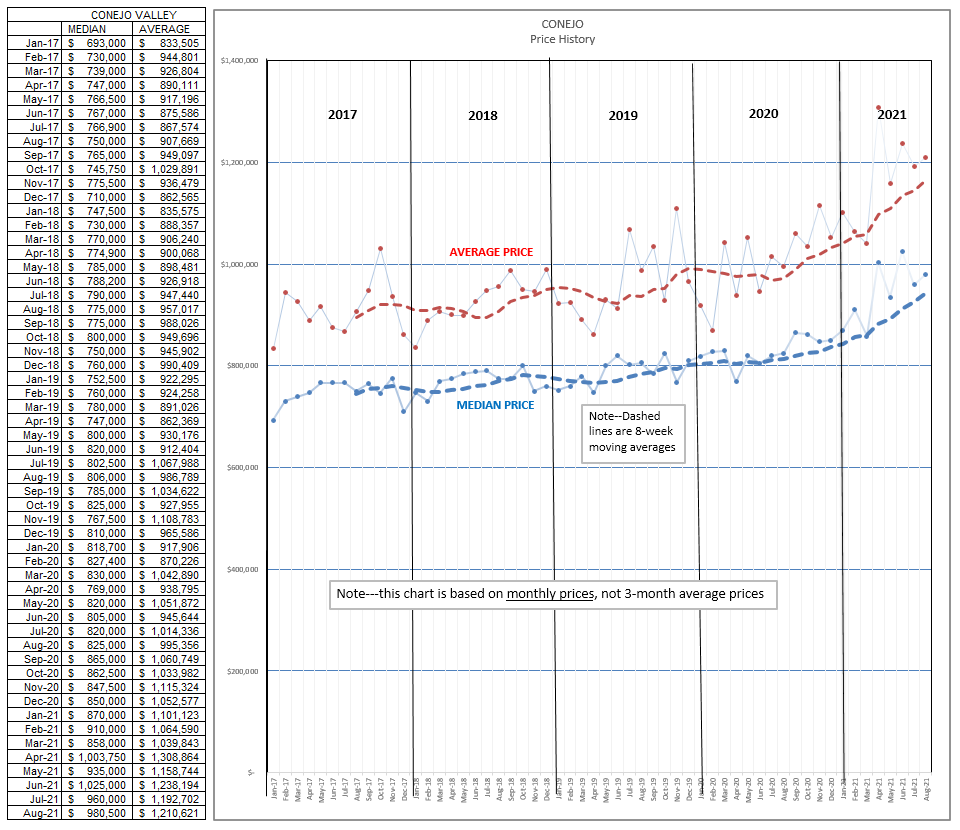
With low inventory and strong demand, Econ 101 says that prices should rise strongly, and they have. The median price in the Conejo Valley is flirting with $1 million. (The actual percentage of price increase will be found in the next table.)
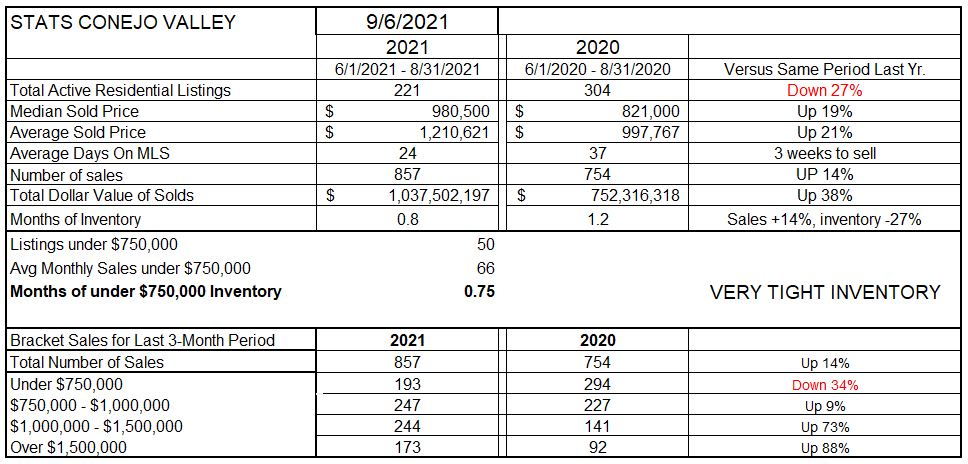
As you can see in the chart above, prices vary considerably from month to month. That is why I decided to use a three-month span to determine price increases, rather than a single month, in the table below. Median prices are up 19% year over year, average prices up 21%. The difference is due to the mix of homes sold. As you can see in the bottom half of the chart below, even though sales in total units were up 14% from the three-month period last year, sales of homes in the higher price ranges were up significantly more. Homes priced below $750,000 are harder and harder to find in the Conejo Valley, and the considerable price increases have moved sales from one pricing level to the next higher level. Also significant is the speed with which homes sell, from 37 days last year to only 24 days in 2021. For the month of August, the total value of homes sold actually exceeded $1 Billion, up 38% from a year ago, even though the number of sales only increased 14%. We are selling more expensive homes.
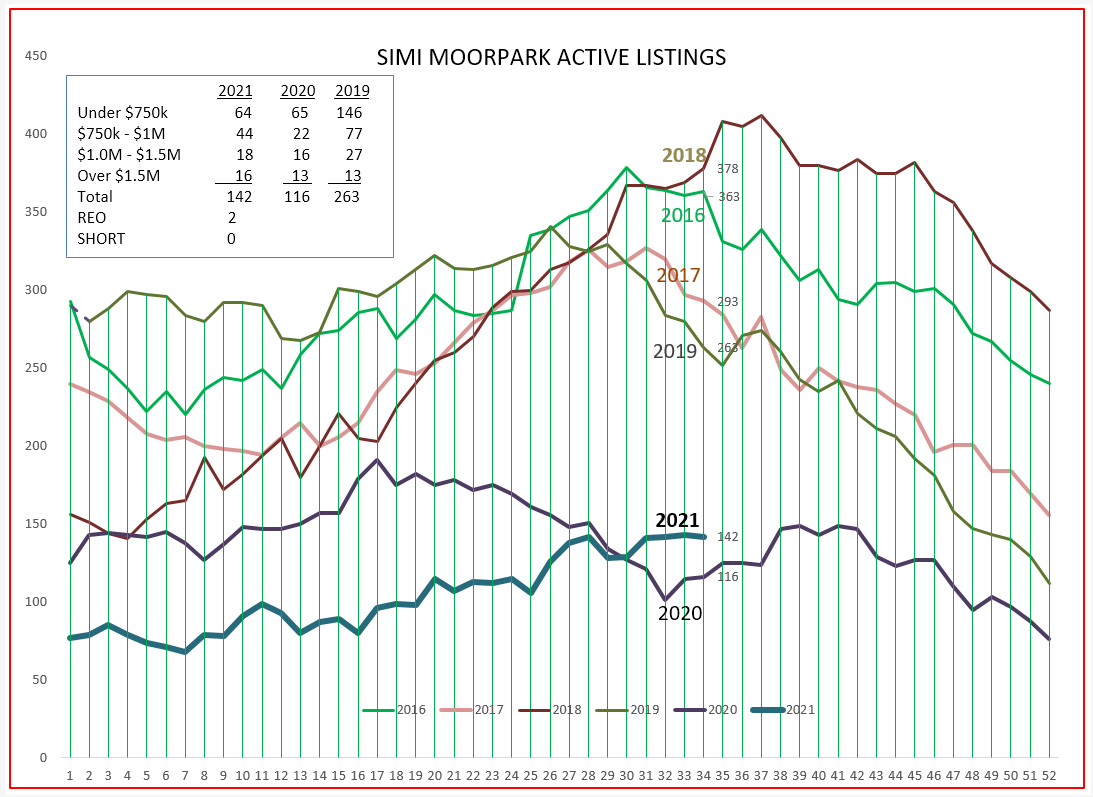
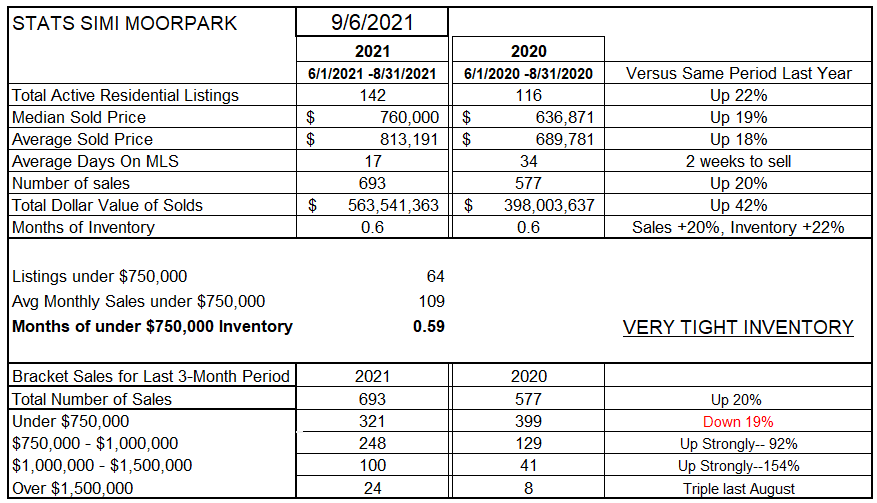
For Simi Valley and Moorpark, the story is similar but different. 2020 was a very tight inventory year in Simi/Moorpark. 2020 inventory dropped so low in the spring of 2020 that the 2021 inventory is actually higher now than it was last year. Simi/Moorpark experienced an earlier rise in sales, an earlier drop in available inventory, and an earlier increase in prices compared to Conejo. Supply was basically static through the year. Whatever went on the market sold as soon as it went on the market. Each week, the inventory was not increasing as it usually does during the year. Currently, we have only 142 active listings compared to August sales of 221, only a couple of weeks worth of inventory.
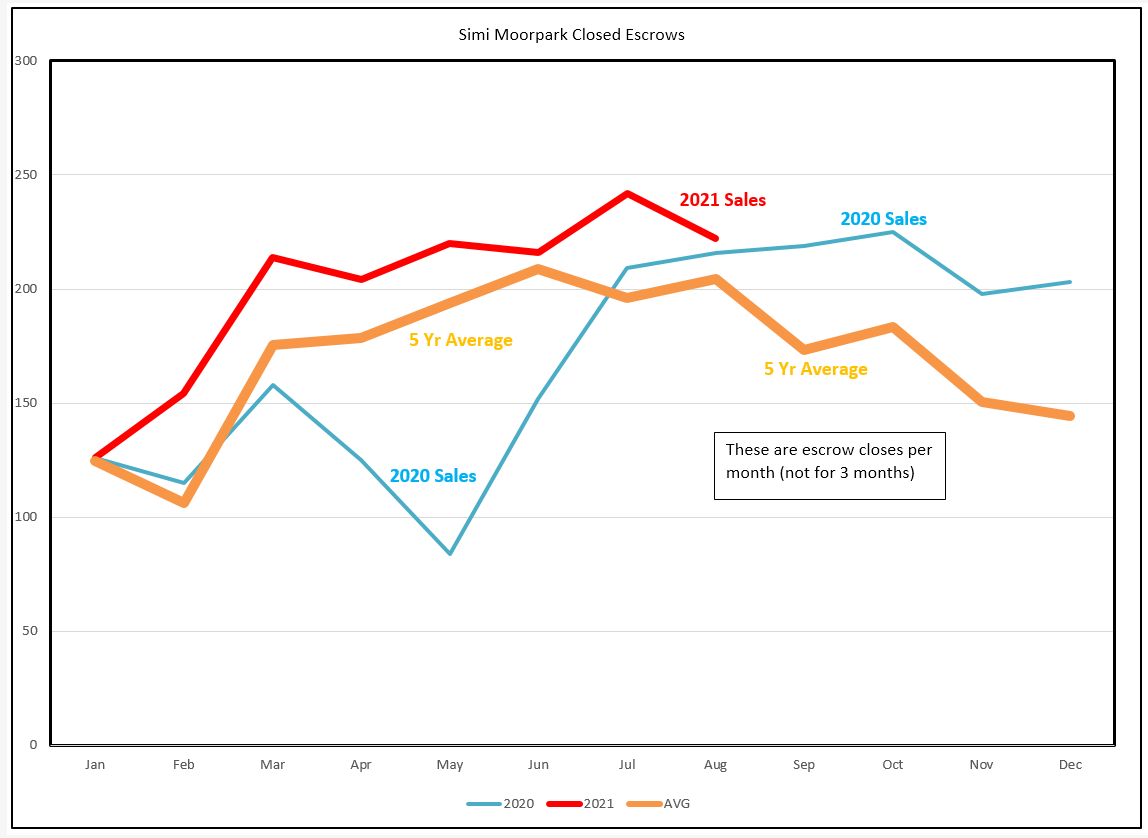
The above chart shows the inventory level compared to previous years. The chart below shows how closed escrows in 2020 and 2021 compare to the 5-year average sales curve, as shown by the orange line. Compare the 5-year average orange line to the blue 2020 line. The beginning of COVID in March 2020 caused a huge drop in closed escrows in May 2020. By July, Sales returned to what normally would be expected and then climbed solidly past the average of previous years. Next, compare the orange 5-year average sales line to the red 2021 sales line. Sales continued strongly in 2021 and then began to follow the average figures. As a result of major price increases, I expected 2021 sales to follow a similar path as the orange 5-year line. However, 2021 sales still continue above expectations, with both July and August sales exceeding expectations.. Demand in our housing market remains very strong.
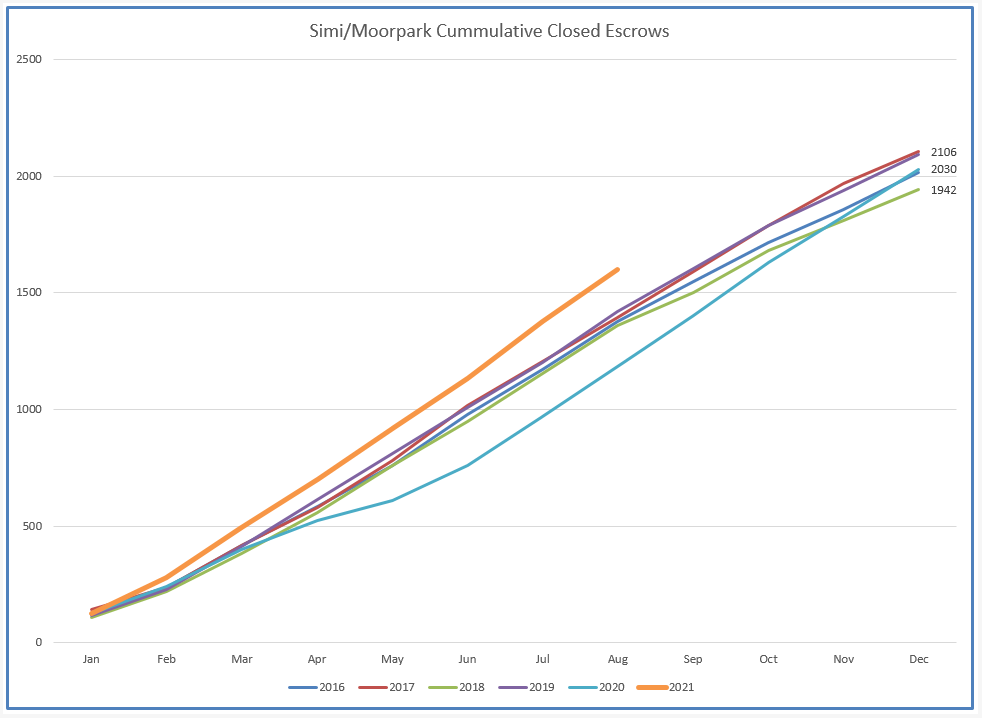
Another way of looking at sales in comparison to other years is through the cumulative escrows chart below. It basically displays the number of total annually closed escrows as the year progresses. 2021 is proving to be a record-setting sales year, with the difference between the orange line below and the previous years continuing to expand.
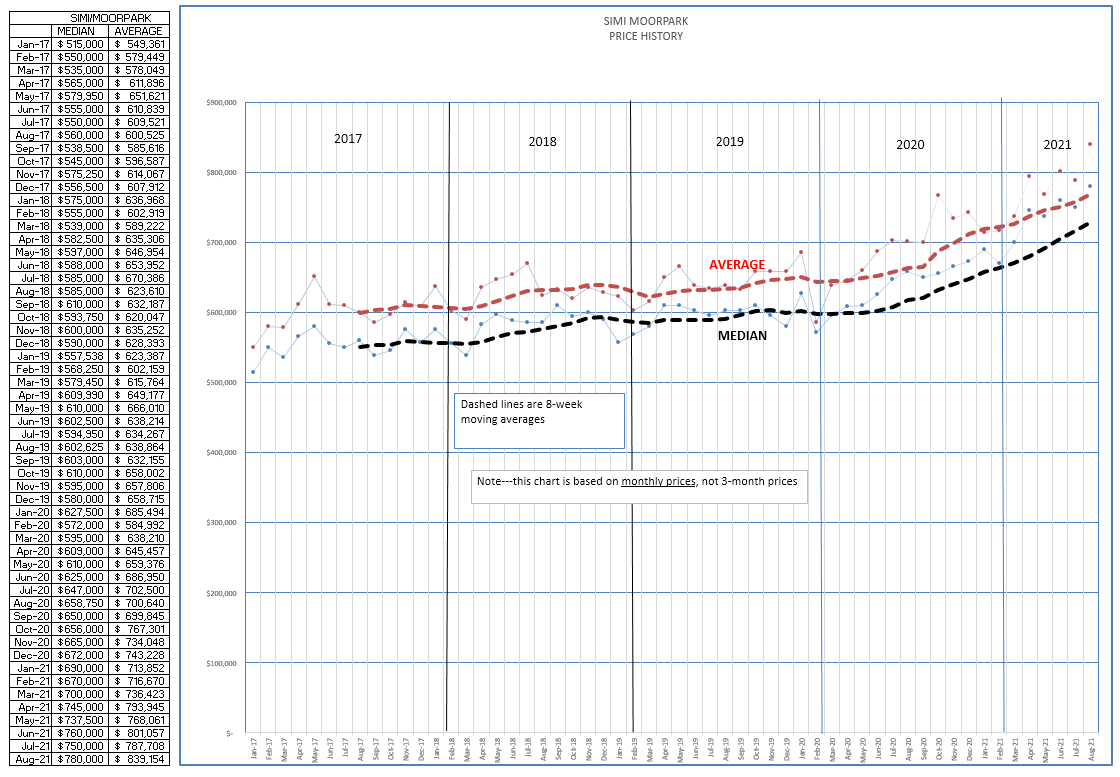
With low inventory and strong demand, Econ 101 says prices should rise strongly, and they have. For 2019 and the first half of 2020, the median price in SImi/Moorpark was $600,000. It is now flirting with $800,000. (The percentage of price increase percentages can be found in the next table.)
As you can see in the chart above, prices vary considerably from month to month. That is why I decided to use a three-month span to determine price increases, rather than a single month. Median prices we are up 19% year over year, average prices up 18%. The difference is due to the mix of homes sold. Even though homes in the highest price ranges increased dramatically, the number of these homes as a percentage of total home sales in Simi/Moorpark is lower than in the Conejo. Homes previously priced below $750,000 are now moving to the next pricing bracket. That is the reason why sales in the under-$750,000 bracket actually decreased by 19% year to year, while the next bracket increased by 92%. Also significant is the speed with which homes sell, from 34 days last year to only 17 days in 2021. The total value of homes sold increased by 42% from a year ago, even though the number of sales only increased 20%. Sales remain extremely strong.
Why did this happen so quickly? I have to go back to another class, Chemistry 101. In that class, we learned that reactions can take place when the right elements are put together. But sometimes a reaction can be speeded up by the use of a catalyst. That is what COVID has been for the housing market, a catalyst. And not just for the housing market, it has been a catalyst for how we work and how we market and sell homes. All this was going to happen, in the future, but the COVID catalyst caused it to happen much more rapidly.
And what of the future?
What is COVID doing right now? It insists on sticking around, waiting for everyone to get vaccinated, and transforming into variants that may cause future problems. We all are ready to be done with COVID, but apparently it is not yet done with us. Things are better, but things are not normal. So stay safe, get those shots if you have not yet received them. Certain of us are even looking forward to the booster.
What other important elements will be affecting the market?
Low interest rates have been a major catalyst to sales, allowing homeownership at a lower interest rate. There has been talk of interest rates rising, but that was based on controlling COVID and the economy getting back to normal. Plans and timelines continue to change. Will this slow the market, or will rates continue at this extremely low level?
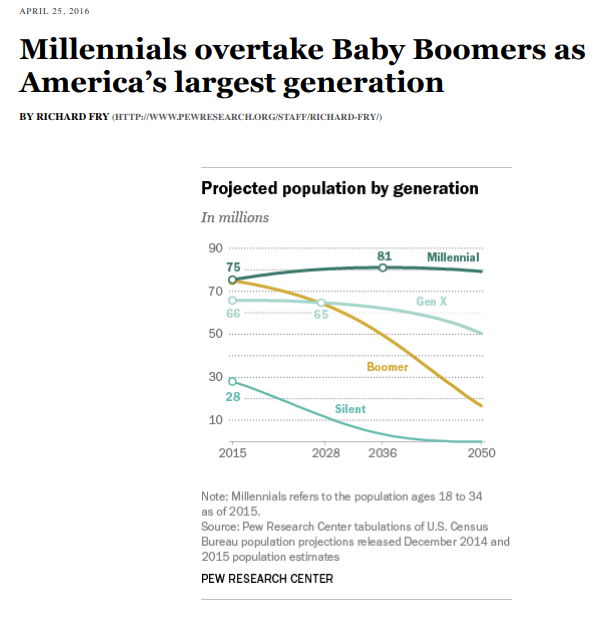
Working remotely has pumped up our local market. In addition, there is a whole generation of new homebuyers that is very well equipped to stay working remotely. Millennials. The Boomer generation that currently owns most of the homes is sadly decreasing, moving on, and the Millennials, those now 24-40 years old, are in their prime home-buying years, and represent the larges segment of the population. For that reason, demand will remain strong.
Some unknowns may balance that out. COVID continues, but government subsidized unemployment payments just ended. The Mortgage Forbearance Program began with 7.2 million homeowners participating, and today 1.7 million remain enrolled. Due to significant equity in their homes, we will not see the wholesale walking-away from homes that we saw in 2008. However, 1.7 million still remains a significant number. This program expires the end of September, this month. To contrast, the inventory of homes for sale today in the U.S. is 600,000. The end of this year may experience an increase in inventory due to some foreclosures, or short sales. How significant remains to be seen. It will not be 1.7 million, but there will be some addition to inventory. Anyone out there have a better crystal ball than I do?
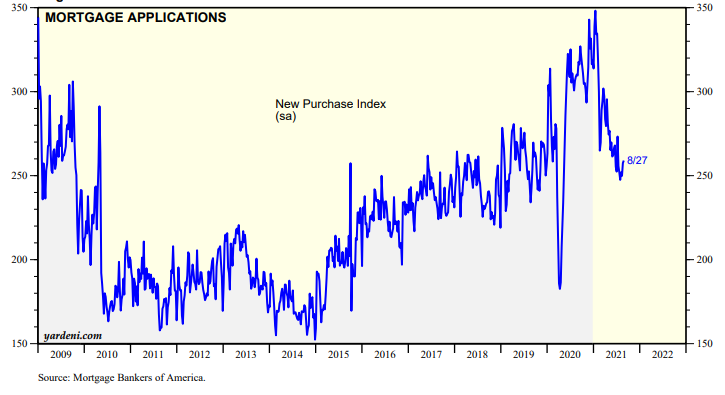
Looking at mortgage applications as foretelling future sales, the chart below indicates sales will soon moderate to more like 2019 levels.
Now for the one thing I can forecast: How we sell real estate will not return to normal. It has changed forever.
If you are not comfortable with virtual tours and all paperwork being done electronically, you have some catching up to do. The future will require not only doing things electronically and virtually, but blending those skills with the personal client skills you have always relied on and that will be so necessary going forward. It will be more important than ever to exhibit those skills in finding the right home for your buyer, in marketing to the widest range of buyers, and to guide and explain the transaction as it proceeds, assisting both buyers and sellers with your knowledge and skills. Their trust in you will grow as you lead them through this monstrously important transaction. Our work is all about trust, perhaps best explained by our fiduciary responsibility. Why has this happened so quickly? Covid, the catalyst.
Stay safe and stay smart.
Chuck
