2021 has proven to be one of the strongest real estate markets in memory.
Is there anything to cause the market to change in the future?
Joel Singer, CEO of the California Association of Realtors (CAR) made a very interesting statement some two years ago. I don’t have the exact quote, but it was basically this: In the future, getting homeowners to list their homes for sale may be a problem, not because they are in love with their homes, but because they are in love with their mortgage rates.
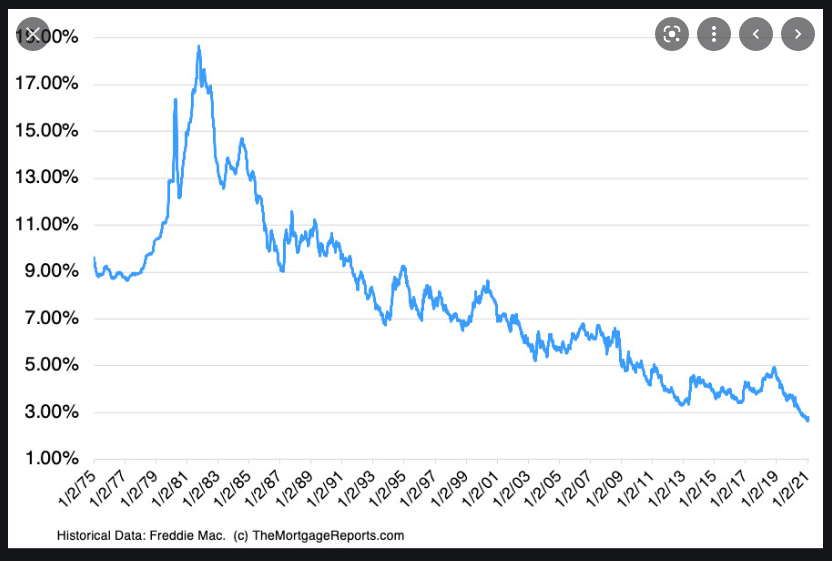
We have enjoyed 3% mortgage rates for quite some time, and those historically low rates have made housing very attractive, even in spite of the tremendous increase in home values. New owners have very low rates, and existing owners have mostly refinanced to have very low rates.
The Federal Reserve has provided stimulus by supporting extremely low interest rates, including by buying both government and mortgage-back securities. (monetary policy)
The Federal Government has dealt with the pandemic by providing strong stimulus, including cash payments, to the economy. (fiscal policy)
These are the fiscal policy measures passed in 2020 to boost the economy flattened by Covid:
- Coronavirus Preparedness and Response Supplemental Appropriations Act, became law March 6, 2020 $8.3 Billion
- Families First Coronavirus Response Act, became law on March 18, 2020 $192 Billion
- Coronavirus Aid, Relief, and Economic Security (CARES) Act, signed into law on March 27, 2020 $2,200 Billion
- Paycheck Protection Program and Health Care Enhancement Act, signed into law on April 24, 2020 $484 Billion
- Consolidated Appropriations Act (CAA), 2021, signed into law on Dec. 27, 2020 $900 Billion
All the above were signed into law by President Trump. SUBTOTAL $3.784 TRILLION
- The American Rescue Plan Act of 2021, was signed into law by President Biden on March 11, 2021 $1,900 Billion
BILLS ALREADY PASSED—FUNDS ALREADY SPENT SUBTOTAL $5,684 TRILLION
Still to be approved are the following bills pending in Congress:
- Bipartisan Infrastructure Bill 2021 estimate $1,200 Billion
- Larger human infrastructure Bill 2021 estimate $1,700 Billion
Grand Total All stimulus Bills: $8.584 TRILLION
Compare this to the entire 2019 Federal Budget:
- Revenues $3.462 TRILLION
- Outlays $4.447 TRILLION
- Deficit ($0.984 TRILLION)
In short, a tremendous amount of money was shoveled into the economy to keep it working. The good news—it worked.
However, whenever this much money is put into the economy, the usual result is inflation. (Econ 101).
The central bank signaled last year that it would likely start tapering its $120 billion-a-month purchases of Treasuries and mortgage bonds once the economy had made “substantial further progress” toward the Fed’s goals of maximum employment and 2% average annual inflation.
In October, the unemployment rate fell to 5.2% and overall inflation was reported as 5.4%. The Fed’s goals have been reached, or exceeded.
The Fed hasn’t hinted at how fast it will taper the purchases, but it is widely expected to pare its purchases of Treasuries by $10 billion per month and mortgage-backed securities by $5 billion per month. These purchases have been keeping interest rates low.
Inflation has now surged as consumer spending increased, and disrupted supply chains have combined with spending demand to create shortages of semiconductors, cars, furniture, electronics, food, and almost everything usually targeted by Christmas shoppers. California laws pushing for a $15 minimum wage have become inconsequential as fast food restaurants are now offering $17 and higher for employees, and still having problems hiring needed workers. The Consumer Price Index rose 3.6% in July from a year ago, the largest increase since 1991.
Prices for goods and labor are taking off. I don’t believe it is temporary. The Fed remedy for inflation is to raise interest rates. In their last meeting, the Fed’s policymaking committee indicated that it expects to start raising its benchmark rate sometime next year, with probably three increases.
While we have experienced inflation in housing prices far exceeding inflation in other areas of the economy, higher interest rates will result in higher mortgage rates for new purchases. New mortgage applications will require a higher payment per month, and that will dampen both home sales and price increases. The good news is that, since the economically tragic recession of 2008, the vast majority of mortgages have been made at fixed rates. Most existing variable rate mortgages have been refinanced. Mortgage payments are now fixed for the vast majority of current homeowners. Rising interest rates should not cause current homeowners to face default.
This is what I believe we are facing in the future. What of our current market? Our market currently remains very healthy.
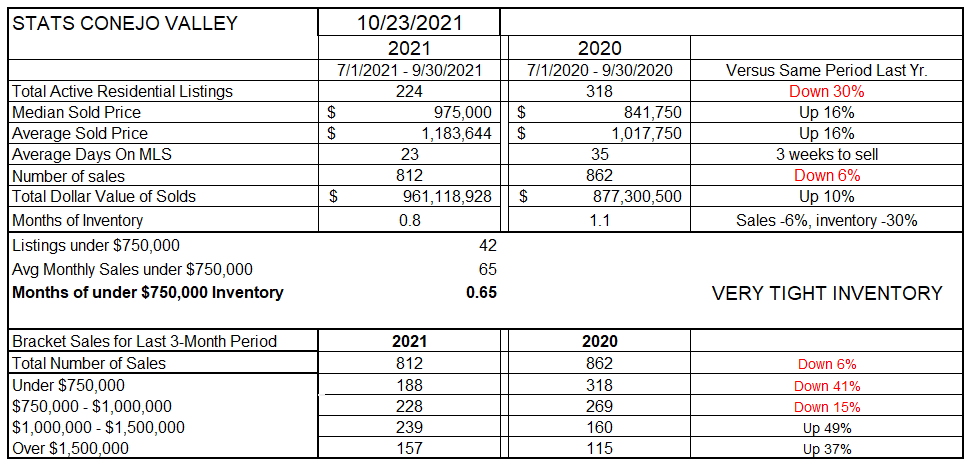
STATISTICAL TABLE
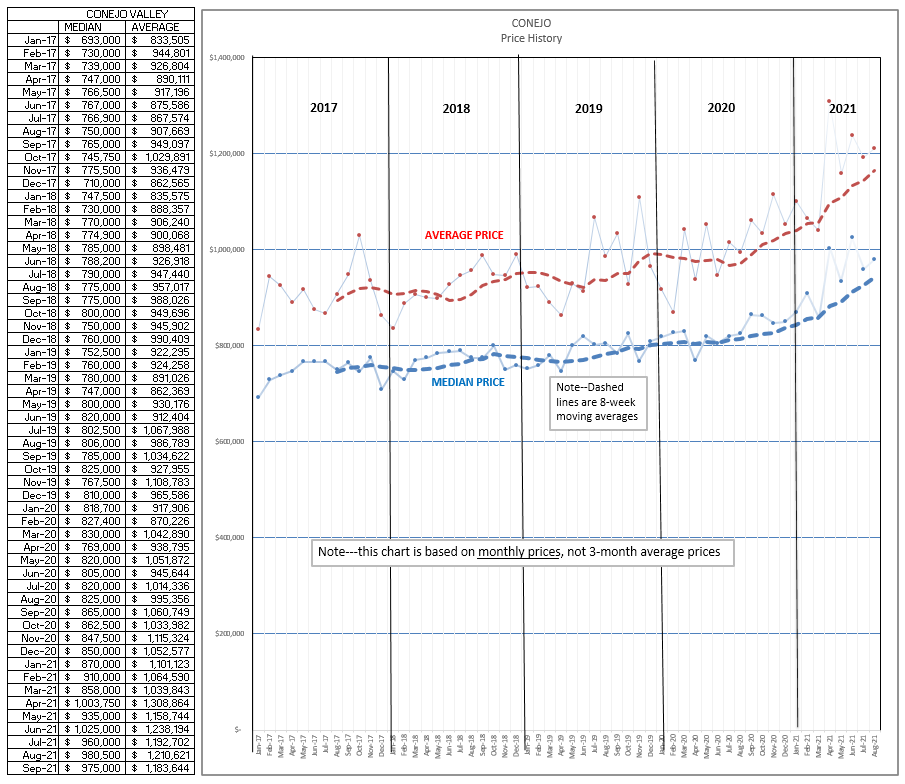
Price increases have begun to moderate, although still very strong at 16% higher than a year earlier. The number of listings is down 30% from last year, and the number of sales is down 6%. This is a combination of a slight weakening this year as compared to very strong sales last year. With a median sales prices just under $1 million, the bottom of this table shows the strength in sales of homes priced above $1 million, mainly due to the 16% increase in value year over year. See the Closed Escrows chart below for a better picture. The active inventory compared to current sales volumes represents only 3 weeks worth of sales.
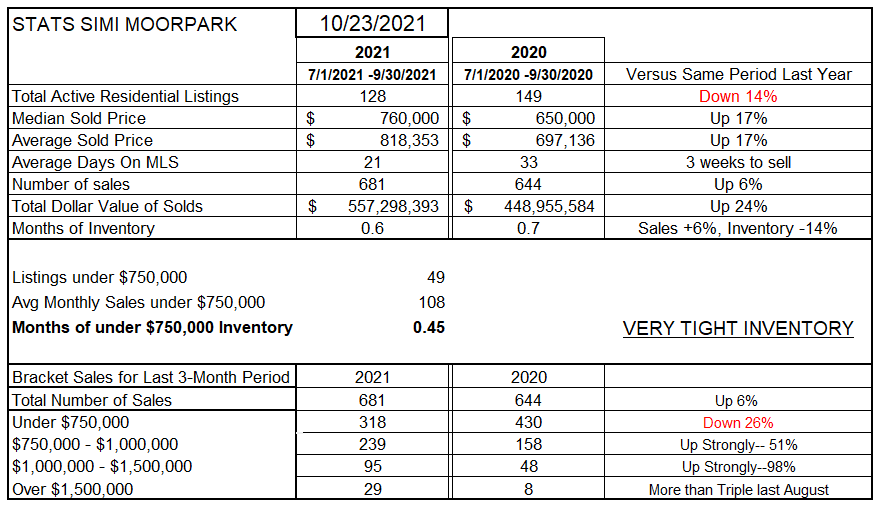
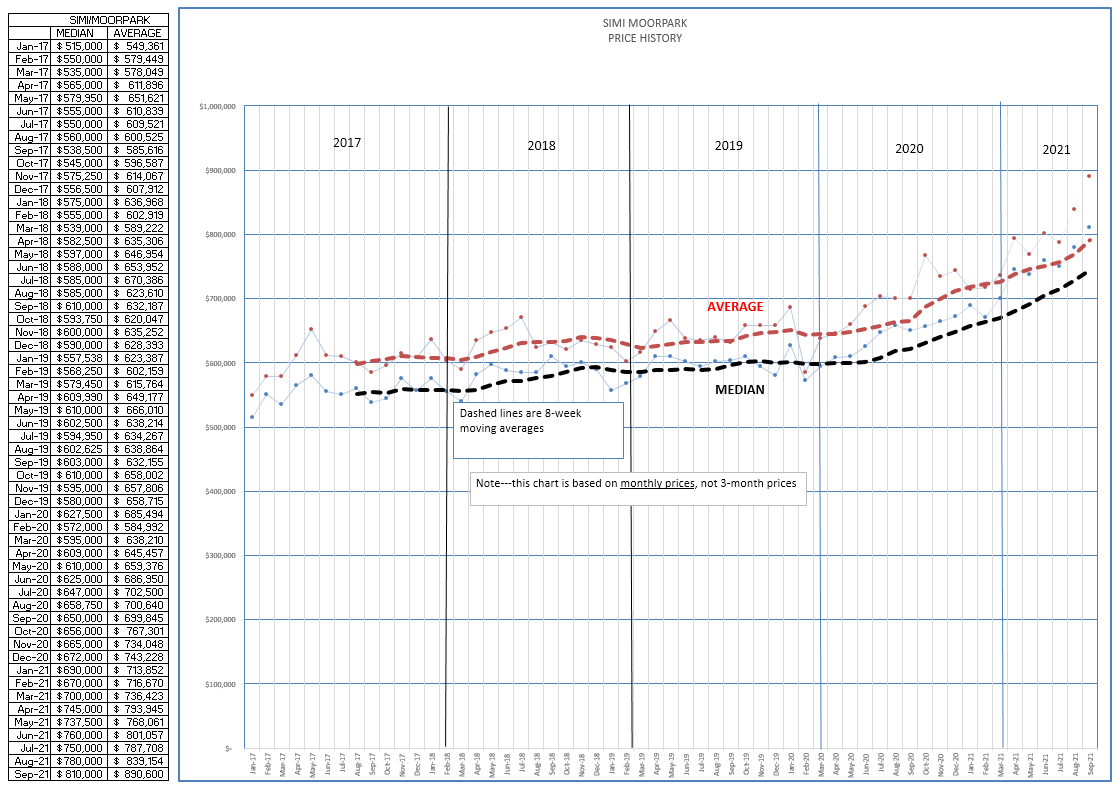
The stats for Simi Moorpark are similar, but since the median price is lower for this area, $760,000, and therefore homes more affordable to more buyers, sales remain higher by 6% with prices up 17% year over year. The active inventory is just above 2 weeks worth of current sales. With median prices now higher than the lowest segment of sales (homes priced below $750,000), the bottom of the table shows how sales have moved to the next higher segments. Note that in October, the median price for Simi/Moorpark hit $810,000 in the price chart further below. The price listed in the table below is a three-month average.
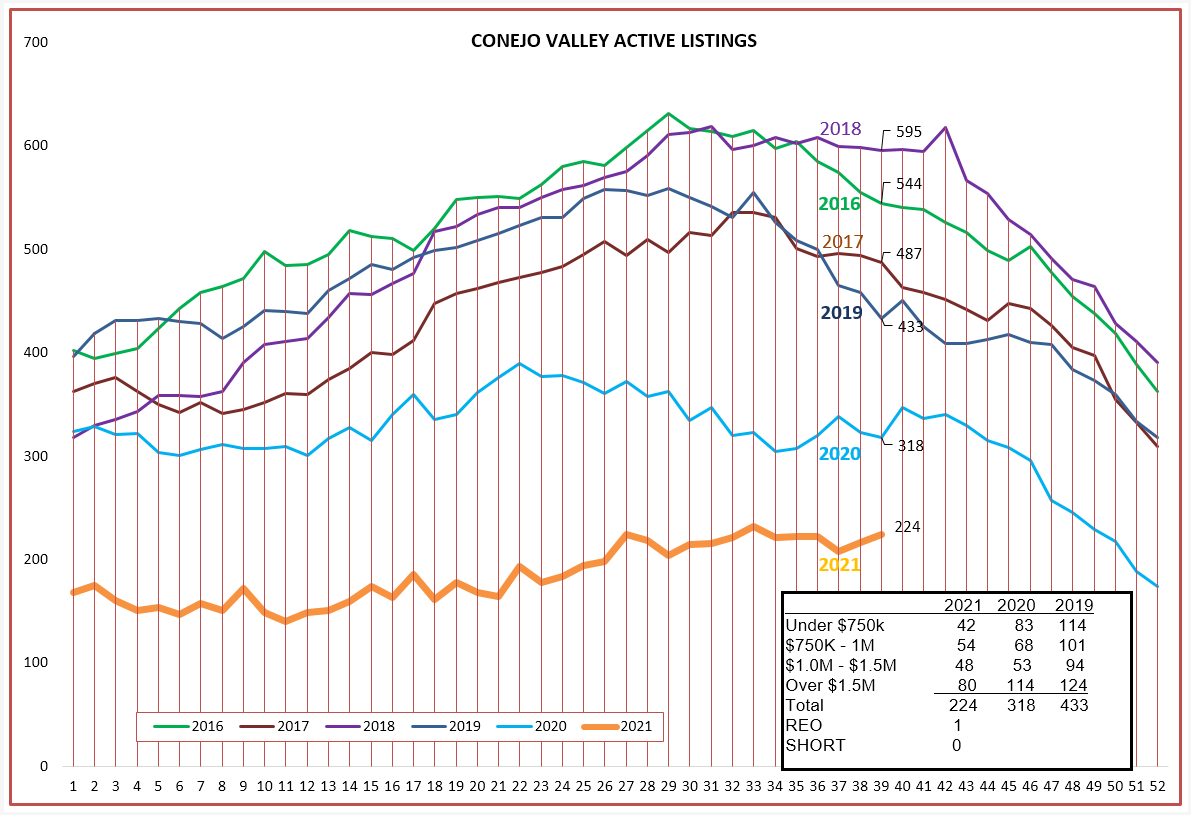
ACTIVE INVENTORY
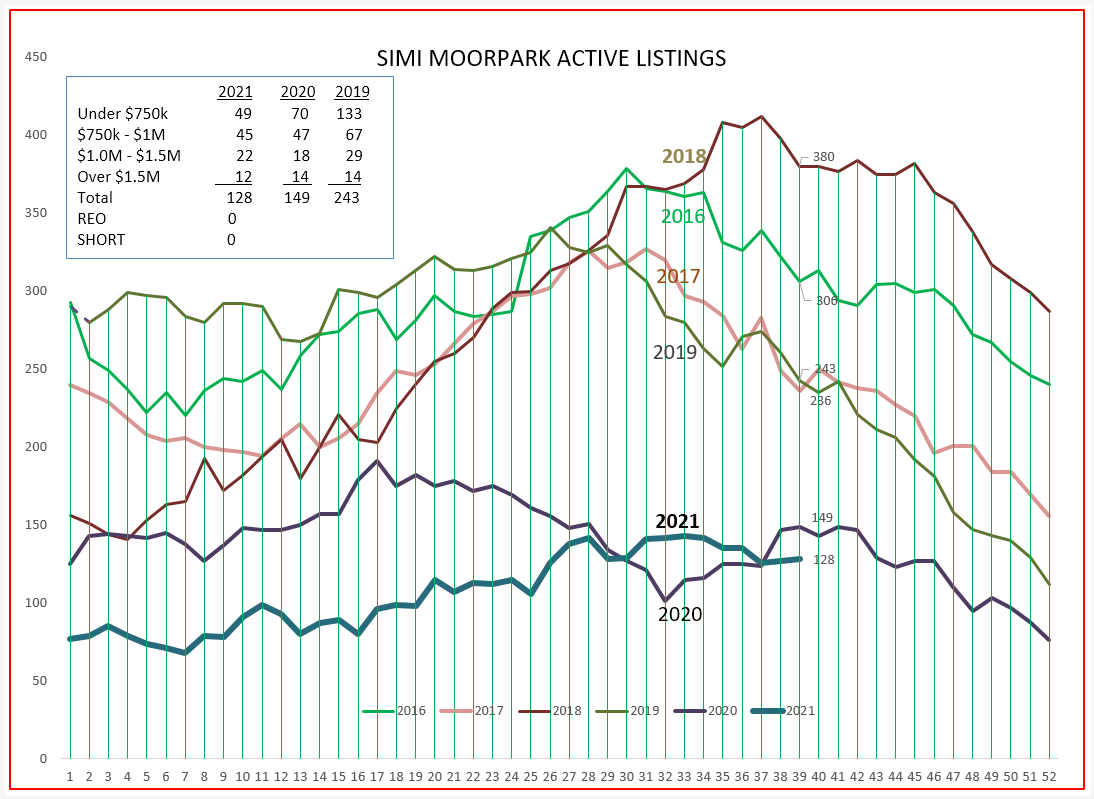
The inventory has basically been static throughout the year, unlike the usual annual rise into the summer months and decrease toward the end of the year. I see no reason why inventory should not decrease, as usual, as the year end approached.
Simi Moorpark is experiencing their second full year of extremely low inventory, with both 2020 and 2021 not exhibiting much rise or fall as the year progressed. Look for inventory to remain constant in Simi Moorpark as the year ends, since sales remain strong for these more affordable homes.
SALES–CLOSED ESCROWS
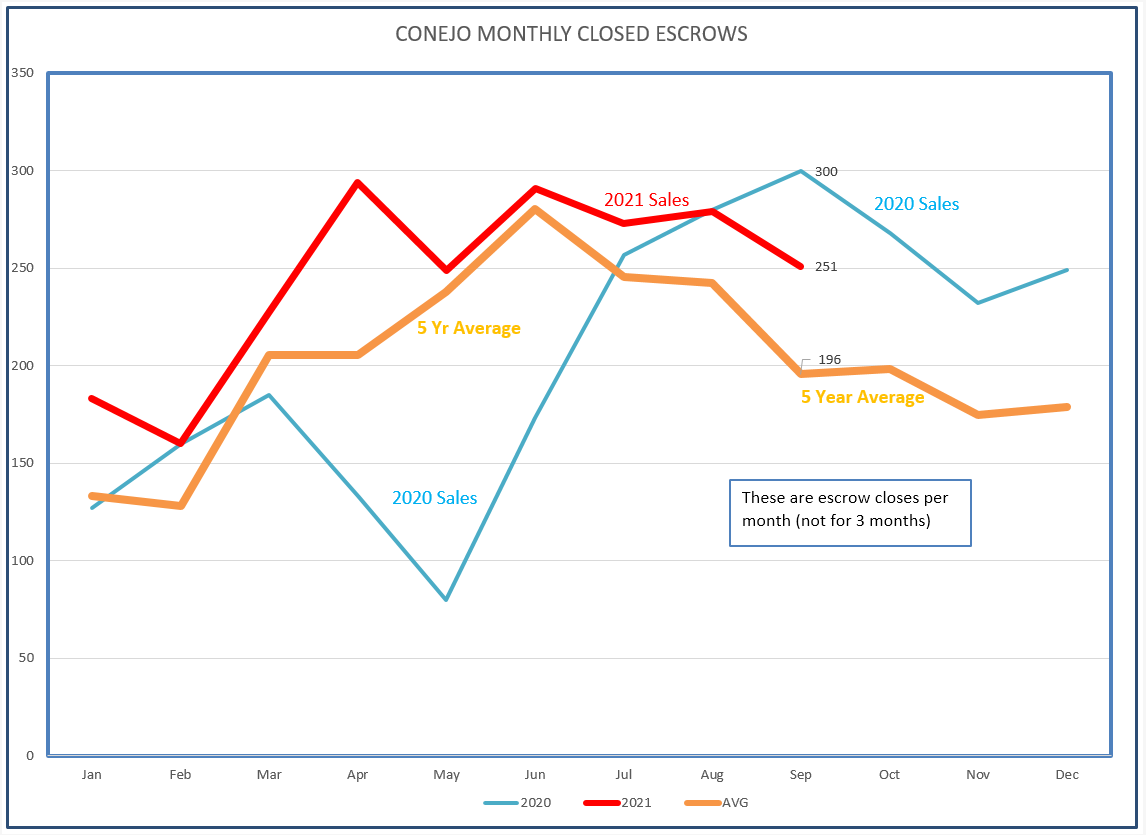
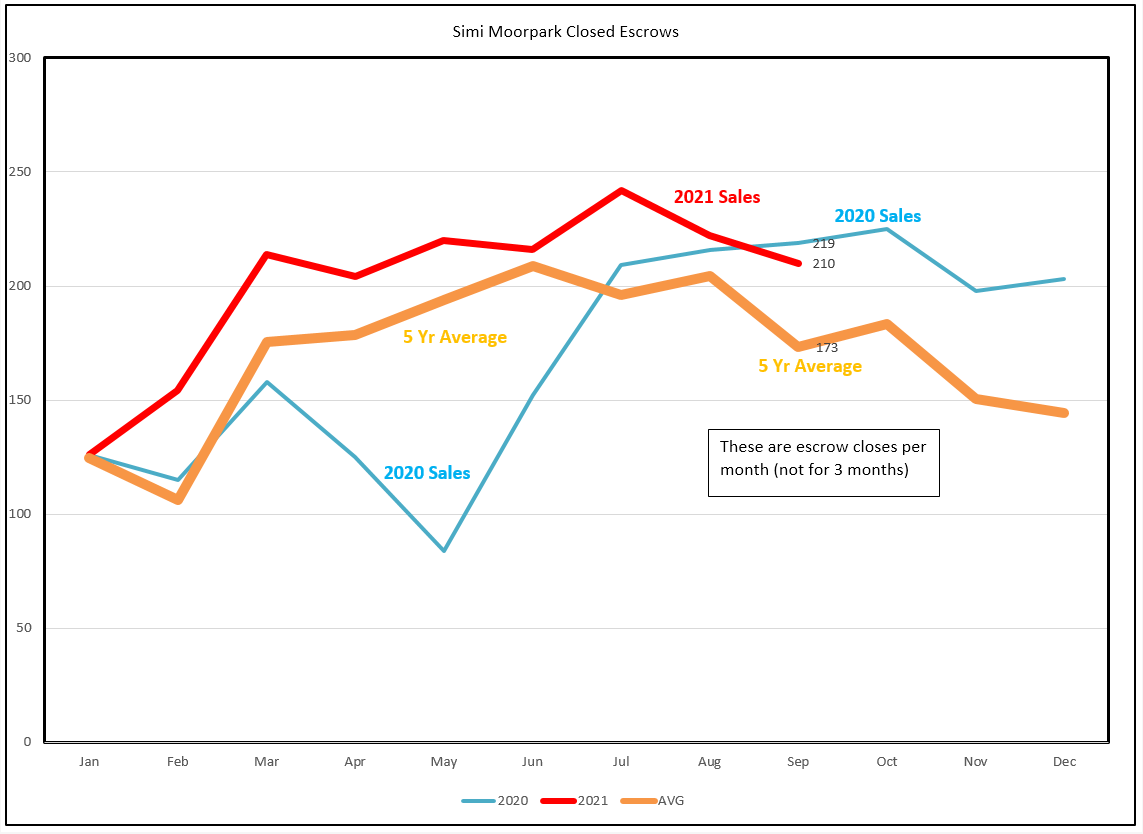
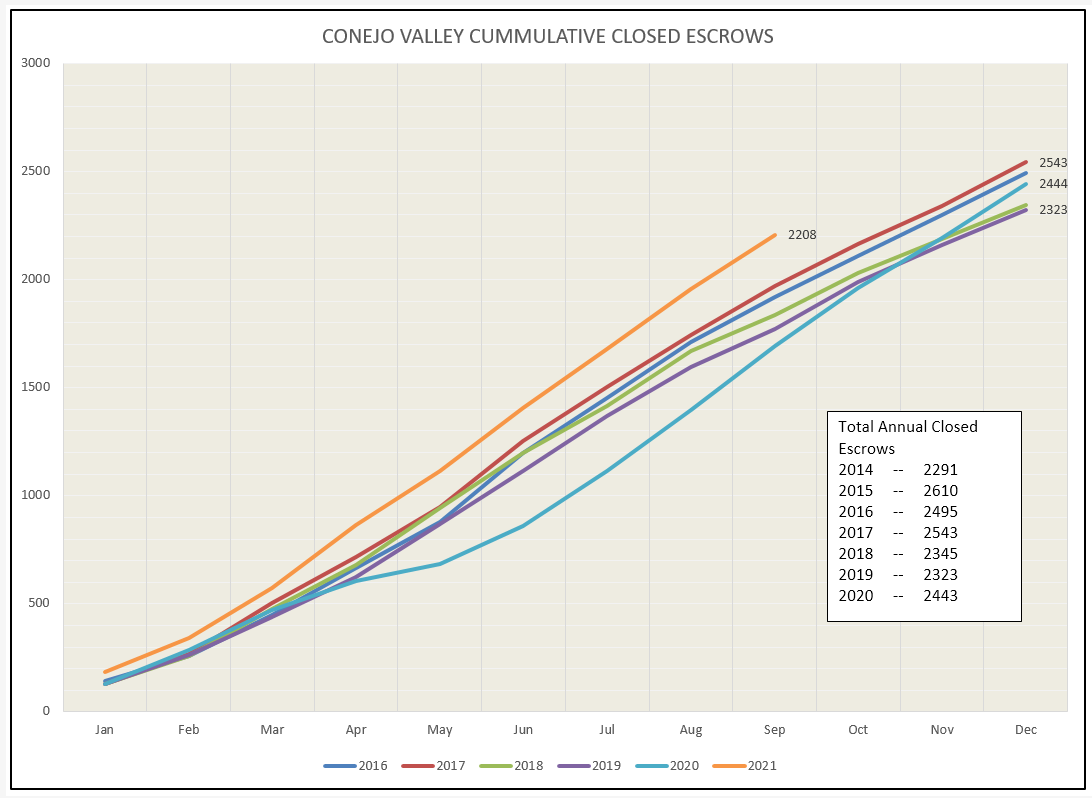
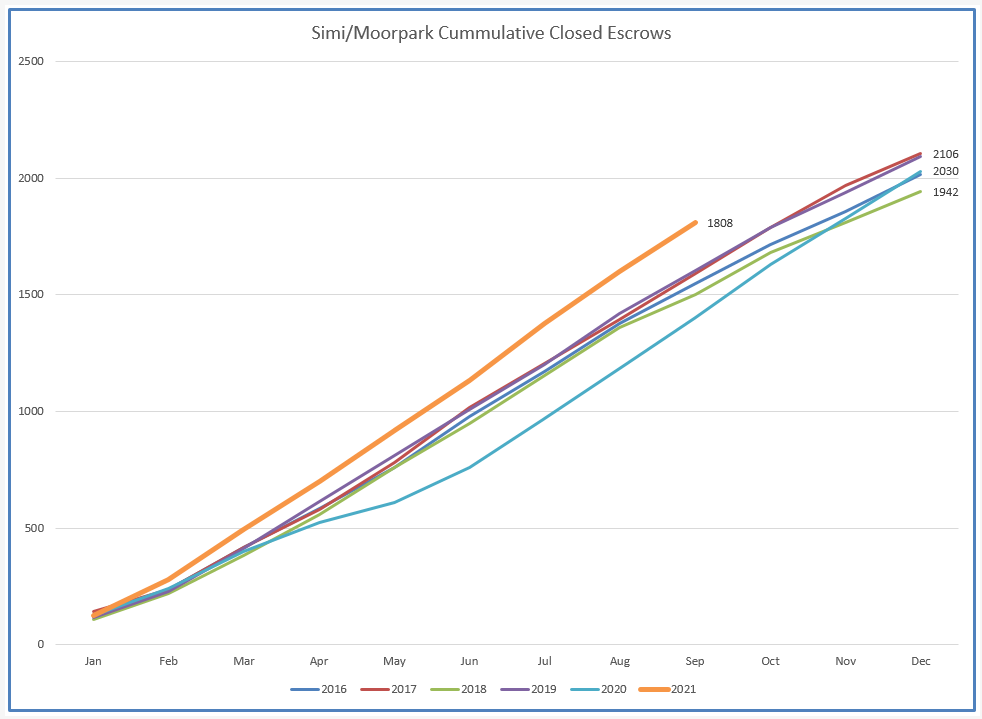
Unlike the anomaly in 2020, 2021 closed escrows are following the usual 5-year average pattern. The cumulative charts further below display the strength of this market compared to past years.
PRICES
Price increases continue to show strength in both valleys.
That is the story for this month, a little late in publishing.
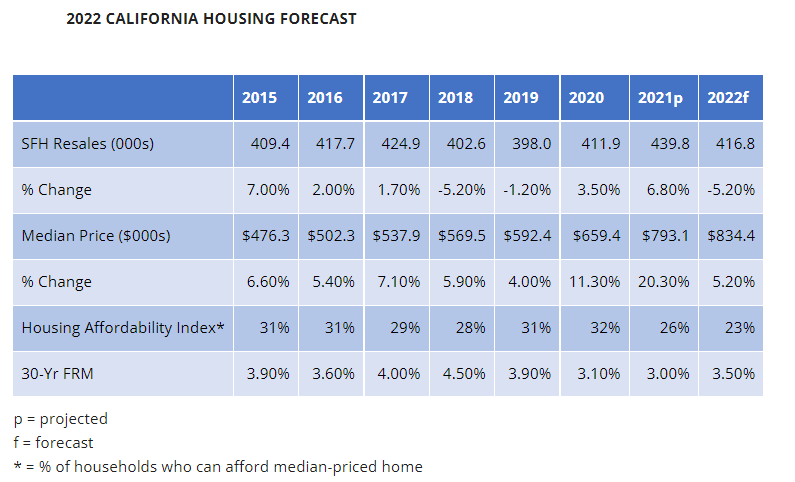
For those who have not seen it, I would like to show you the forecast from the California Association of Realtors economists, real economists, unlike me (your local amateur).
According to CAR: 5% fewer homes sold, 5% increase in prices, and mortgage rates averaging 3.5% for the year.
As we come out of this pandemic, and get back to “normal”, remember to continue using the tools you were forced to learn. You will be much more efficient by doing so, and your business and service to your clients will continue to grow.
Stay well and stay healthy
Chuck
