The market is changing. In what way?
I want to start out by sharing a few slides from our renowned C.A.R. economicsts, Jordan Levine and Oscar Wei. They share an enormous amount of data. Today, I want see how their data for the state compares to our area of eastern Ventura County (most of the Conejo Valley, Simi Valley and Moorpark), and a sliver of western Los Angeles County (Agoura Hills).
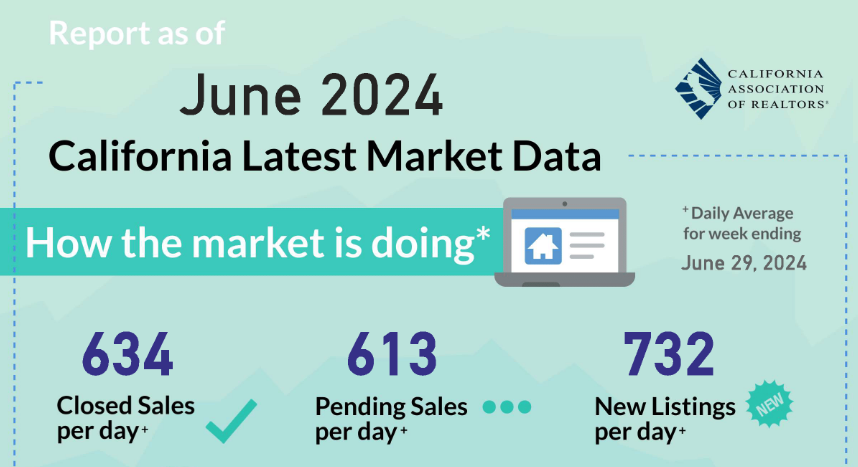
Below is a chart that incorporates some of the major State housing market metrics. Note: the numbers are a daily average for the week ending June 29, 2024. We can see that new listings coming onto the market are exceeding the number of closed sales. Inventory is growing. And Pending sales, which become closed sales, are signalling a further slowdown in sales. Listings are growing, sales are slowing.
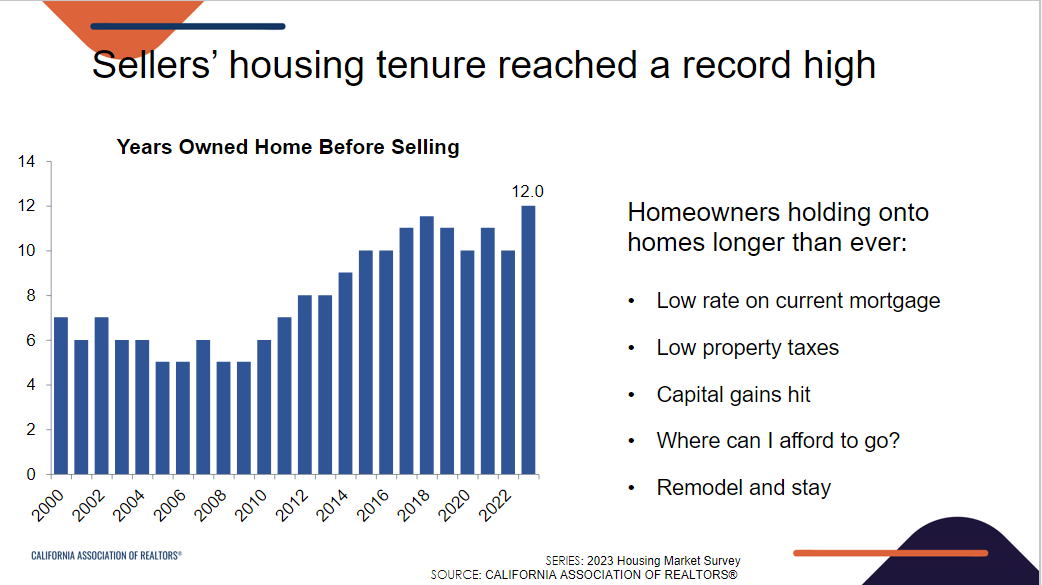
The major reason prices have been rising is due to a lack of inventory. Too many buyers have been chasing too few properties. Owners have been holding onto their properties because their next purchase would most likely require a much higher mortgage interest payment, often double their current payment. As a renowned C.A.R. CEO once said: we are in an era in which people like their homes but the absolutely love their mortgage rates. When my family moved here in 1978, homeowners were moving to larger and better homes every 5-6 years on average. The C.A.R. chart below show how that has now doubled, moving on agerage only every 12 years.
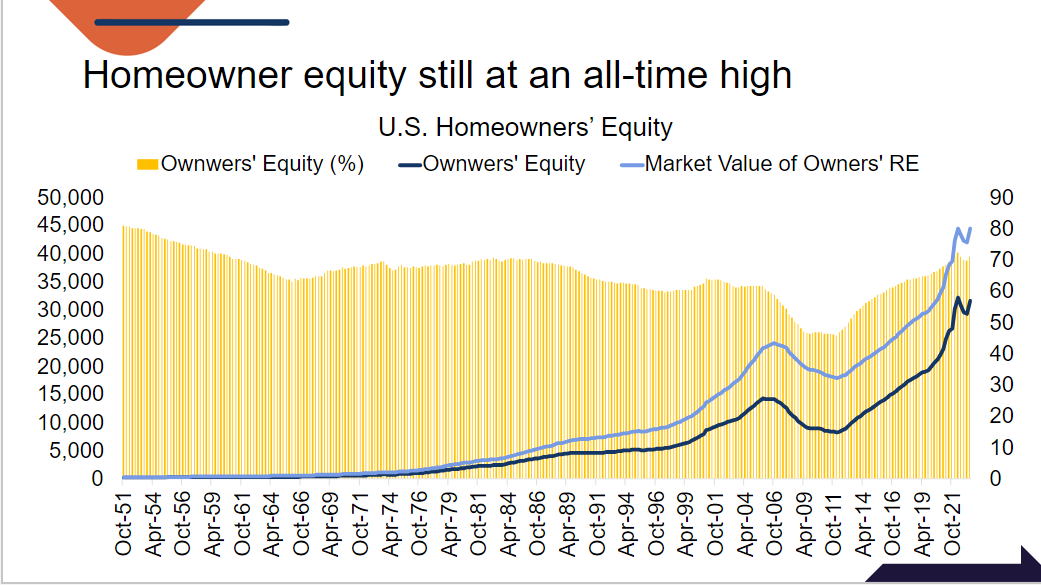
One benefit of staying longer in their homes means that current homeowners have a lot of equity in their homes. The Great Housing Recession of 2007-2011 caught a lot of people flat-footed with adjustable home loans. Loans had very low teaser rates for the first 3-5 years, and buyers were relying on continually increasing home prices. When those loans adjusted their very low teaser rates to market rates, payments doubled and many lost their homes. The preponderance of adjustable loans and the drop in home prices caused many to lose their homes to foreclosure, causing a downward spiral in home prices that fed on itself. Owners with no equity walked away from their investments.
That is no longer the case. Most homeowners have fixed-rate 30-year loans. While prices strongly outpacing the rest of the economy brings concern of an overheating market, the current housing market is well insulated from another spiral price drop. This chart also exemplifies the financial benefits of home ownership.
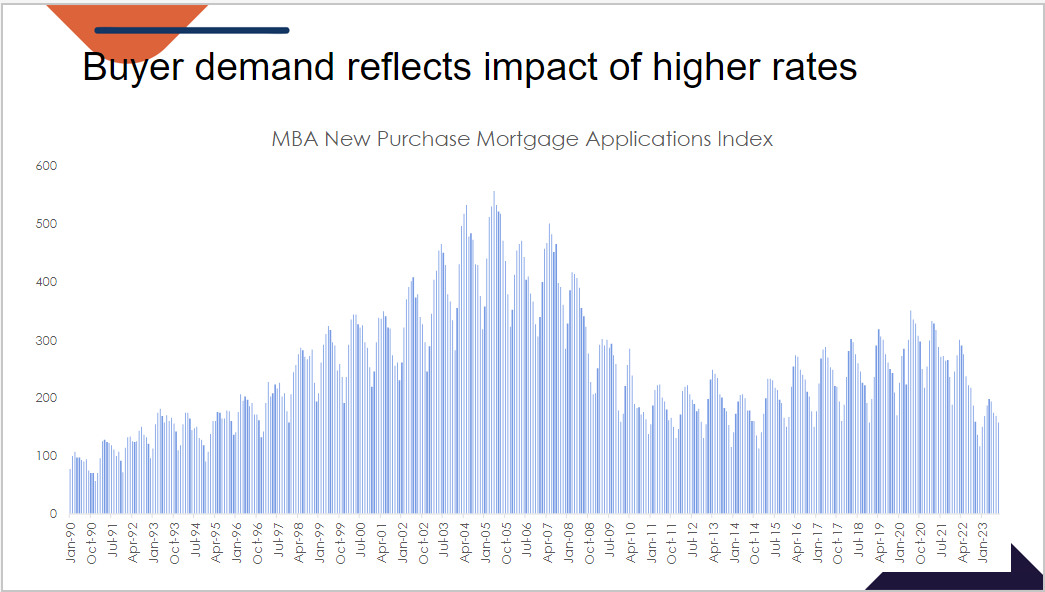
The next C.A.R. State slide displays the measure of buyer demand since 1990. COVID and work-from-home fostered a movement to the suburbs, lessening the requirement to live close to the office in order to avoid lengthy commutes. This dynamic began to change dramatically when the FED decided to fight inflation by increasing (more than doubling) interest rates. The C.A.R. State chart below, from Mortgage Bankers Association data, displays the recent slowdown in buyer demand.
That is how the California State market is doing.
But All Real Estate Is Local. What is the market doing locally?
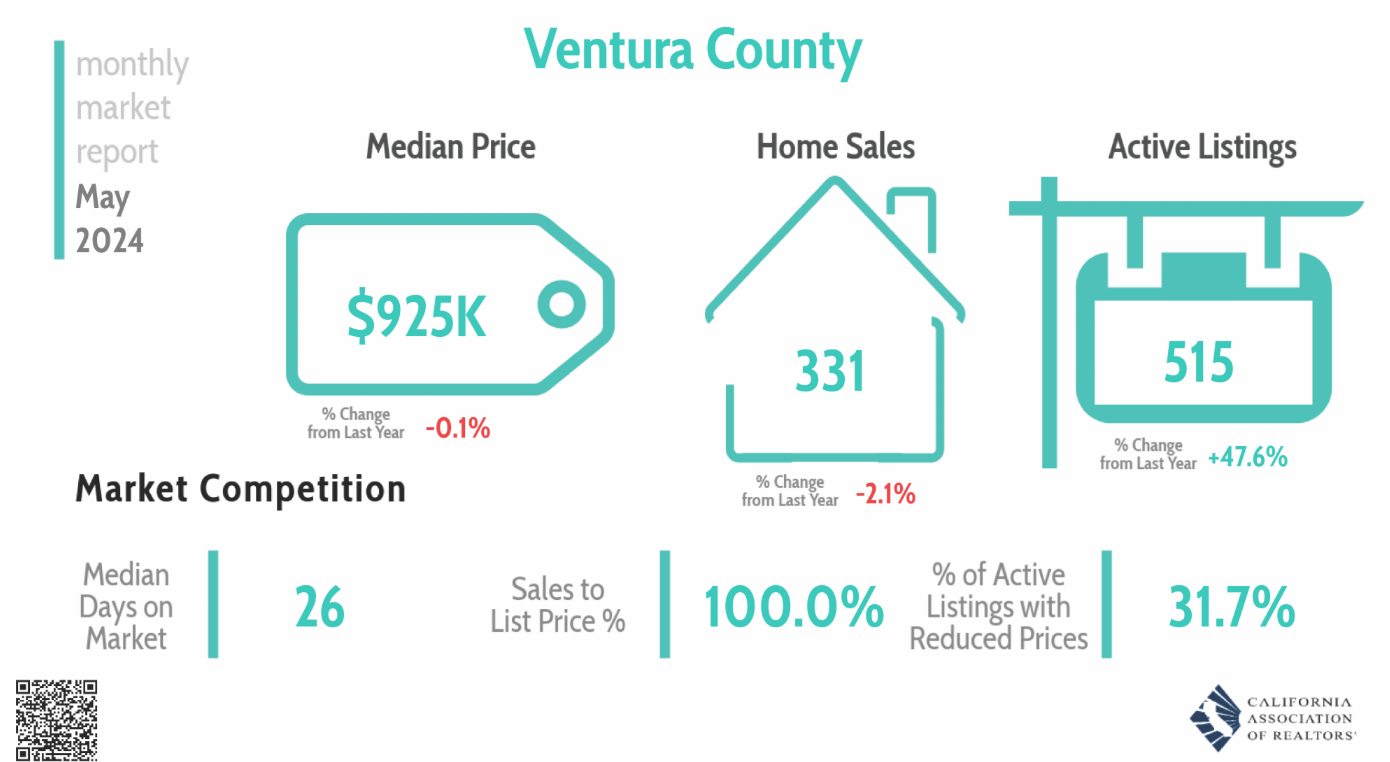
Below is a final one-page statistical report from C.A.R. for Ventura County for May 2024. Note that Median Price is the same as a year ago, sales numbers are down 2% from a year ago, and Active Listings are up 47% from a year ago. The final statistics I want to point out are the sold price versus listing price percentage (100%) and the percentage of active listings with reduced list prices (31%). For the county, this report records a market slowdown. Prices flat, sales receding, listings up, sales over list price disappearing, and discounts to list price happening.
Now on to our market areas, the Conejo Valley and the combined Simi Valley/Moorpark areas.
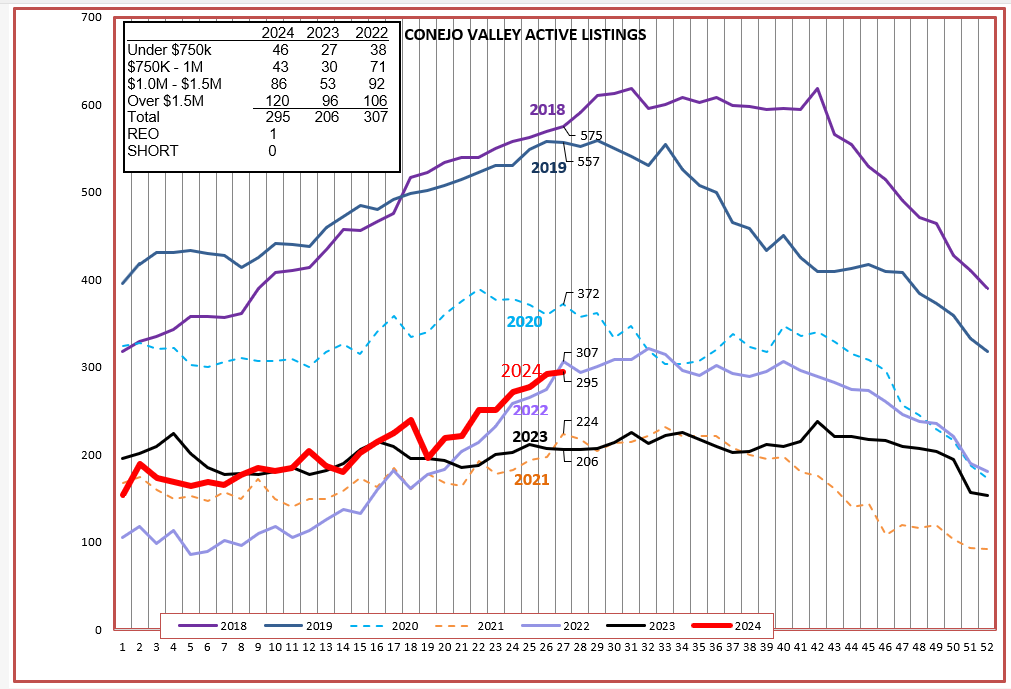
Let’s begin with inventory. The normal shape of inventory progression over the year is best represented by the uppermost lines, 2018 and 2019. That is what inventory reports looked like when mortgage rates were very reasonable and there were no COVID-like influences. At this time of year, our market would normally be in the area of 500-600 listings. On July 1 we had 295, only half of normal. During the COVID years of 2020-2021 (the dotted lines) inventory started out low and remained that way throughout the year. 2022 looked like it was going to be a normal year until the FED got involved, and that turned 2023 into an abysmal year as measured by the number of listings. That also led to a mediocre year as measured by the number of sales. Since not many homes were coming onto the market, the number of listing remained extremely low in 2023.
Inventory has two contributors, owners putting their homes up for sale and buyers taking them off the market by purchasing the available inventory. 2023 was flat, or maybe best desribed as an equal number of people listing as buying. When looking at listing numbers, 2024 is showing a strong increase, with the curve resembling the “normal” expectation pattern. More people are listing than are buying, and inventory is rising. But inventory levels are still historically low. This continues to provide upward price pressure.
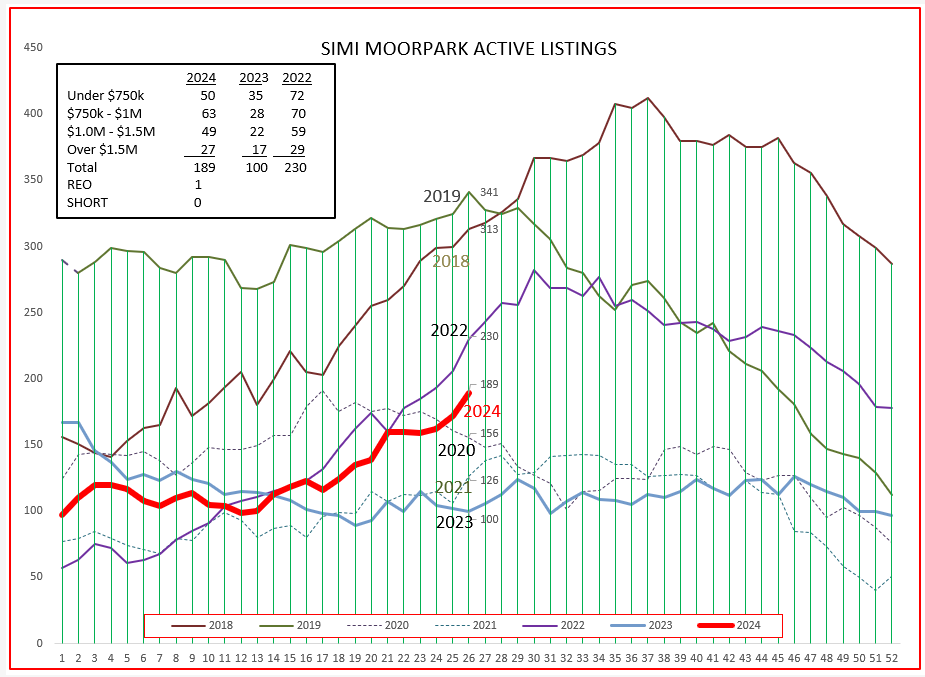
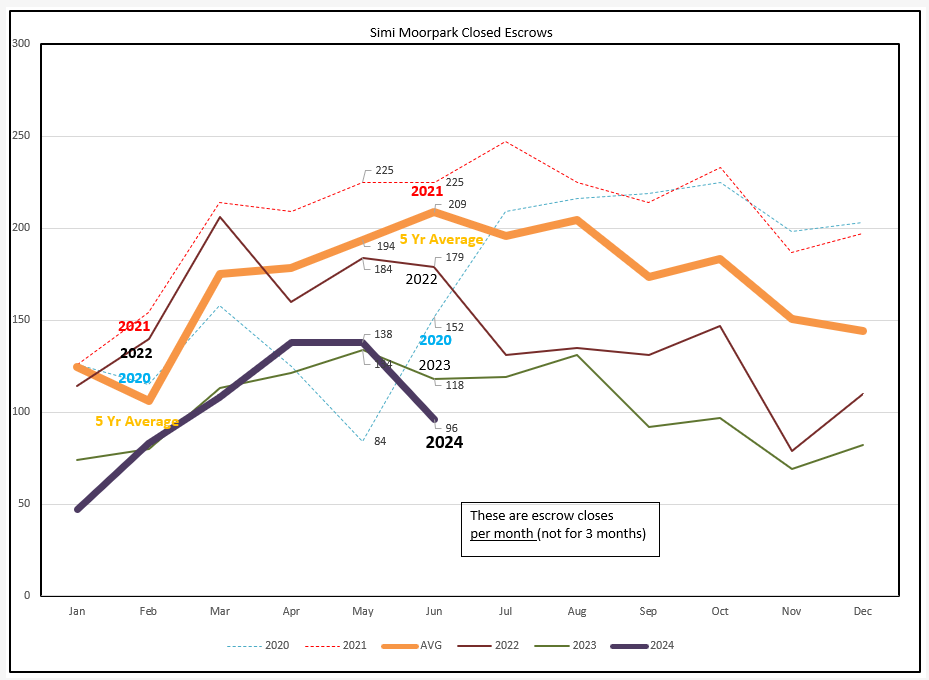
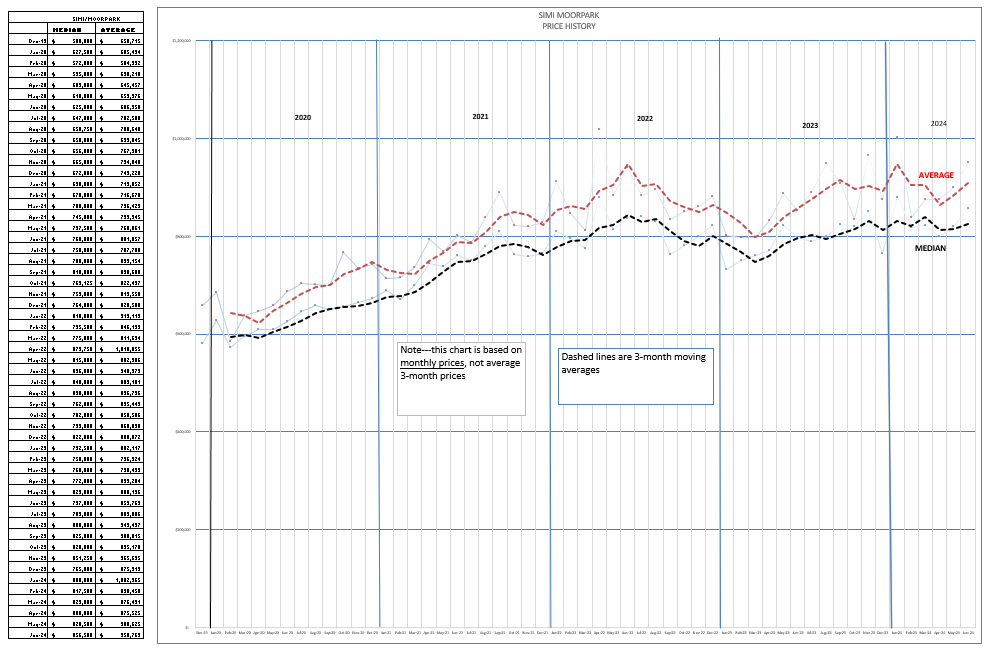
Simi Valley and Moorpark show similar dynamics. The normal (pre-COVID) years 2018-2019 reported inventory of between 300-350 compares to the much lower July 1, 2024 inventory of 189, and is growing rapidly, following the 2022 pattern. Inventory grew strongly in 2022. So did sales. Unfortunately, 2024 sales are not following that comparison.
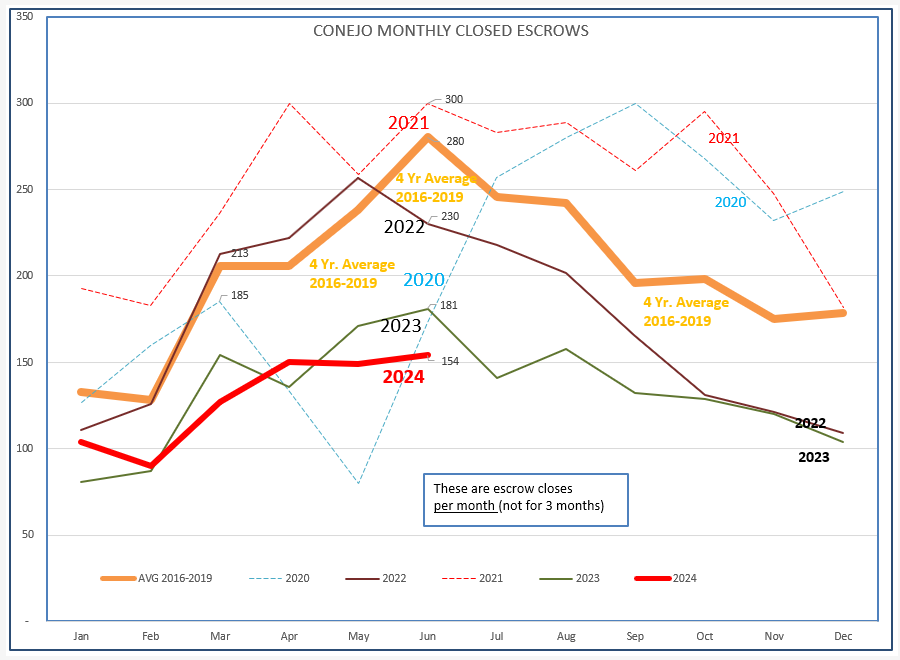
The chart below displays the number of sales as the year progresses. The heavy orange line is the average of sales occuring during 2016-2019. Let’s call that “normal”.
The dotted lines are the COVID years. They were wild. 2022 progressed normally, a very good sales year as measured by the number of sales. 2023 was influenced by rapidly increasing mortgage rates even while home prices were increasing. Many buyers decided to quickly lock in housing prices and mortgage rates. Although the shape of the graph progressed in a normal fashion, the number of sales was significantly lower. 2023 ended up being the lowest total number of sales since 2011, during the Great Recession. And now 2024 is following at an even lower level of sales. The 4-year average of 280 sales normally expected in June resulted in only 154 sales for June 2024.
For Simi/Moorpark, the number of June sales plummeted, from the usual June average of 209 to only 96, even lower than 2023’s low level of 118. The net result is that inventory is growing while sales numbers are slipping.
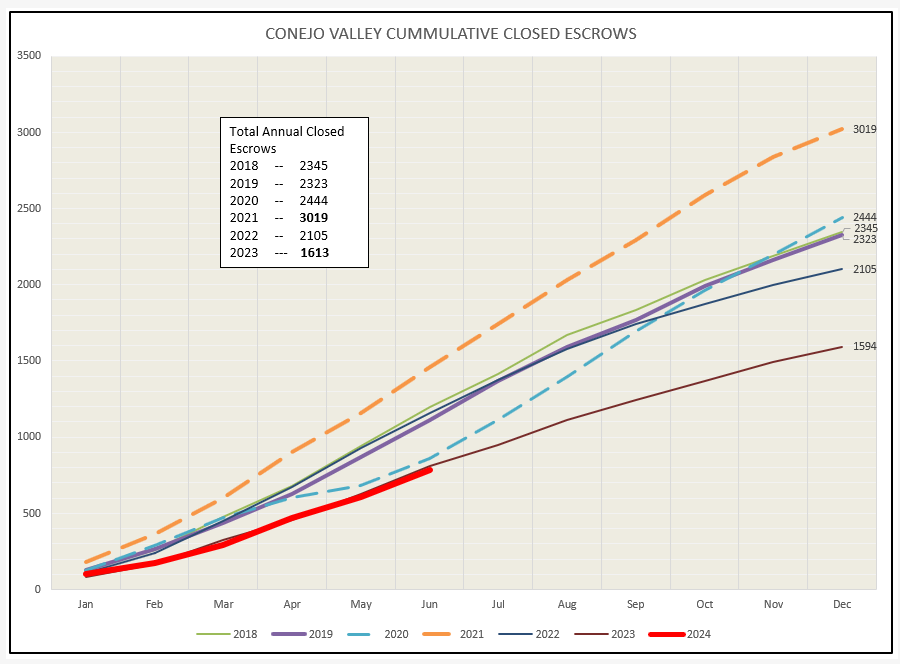
Looking at the same information in a different way, the charts below view sales as a running total as the year progresses. 2023 was one of the lowest years on record, only about half the number of sales experienced in 2022. Unfortunately, 2024 is now following the same pattern. Normal would be around 2400 annual sales, compared to only 1600 last year, 33% fewer sales and only half of 2021.
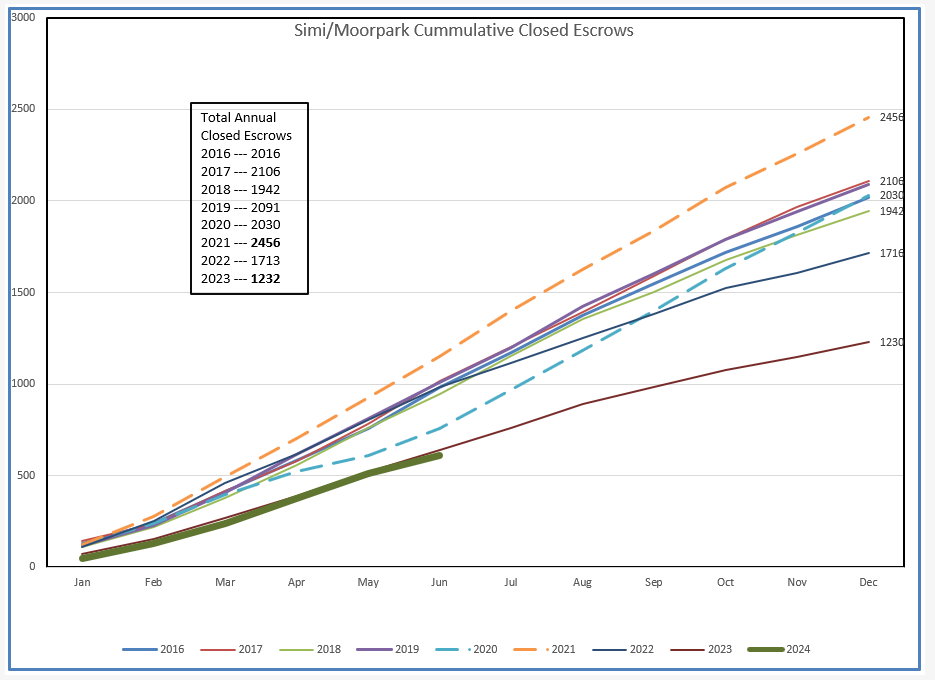
Simi/Moorpark sales would normally be in the area of 2000-2100, but for 2023 were only 1200, a drop of 40% from normal expectations and only half of the record year of 2021.
There is a 3-way relationship between inventory, sales, and price. It is rooted in economic theory postulated by Adam Smith in 1776, as old as our country. How are prices doing based on the above confluence of supply and demand?
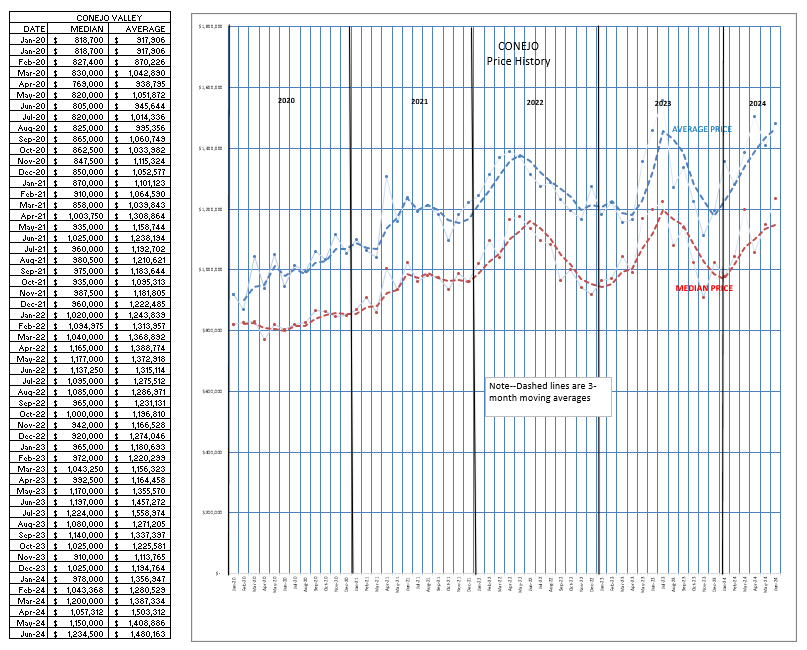
Prices seem to be following the normal annual pattern of the housing market, the same as inventory and sales, increasing as the summer approaches and falling as the year ends. The pattern has always been there, but never this pronounced. While this takes place every year, 2022 and 2023,have been very hyper, with dramatic highs during the summer and dramatic decreases as the years ended. It looks as if 2024 is following the same pattern. The old adage of a picture being worth a thousand words immediately comes to mind. But while I can see the picture, I have difficulty explaining it. My suspicion is it is heavily influenced by the number of high dollar sales. High dollare sales are not as dependent on mortgage rates, as they can be either all-cash or involve shorter-term loans involving with lower adjustable rates. I will have to do more research, but would be very interested in your explanation of what this picture is showing.
Looking at the price chart for Simi Valley/Moorpark causes a little more confusion. The 2022 line matches Conejo’s pricing experience, but not the others. Simi/Moorpark represents a comparatively lower price basket of home prices. The preponderance of sales are closer to the median price. It is also likely that Simi/Moorpark sales are more affected by mortgage rates, and less affected by all-cash buyers.
Until the FED succeeds in its inflation fight, achieving lower inflation by causing a slowdown in the economy and a resultant increase in the unemployment rate , we will not see much change in the direction of the housing market.
Let me remind you of the difinition of “Market”. Per the online Encyclopedia Britannica, MARKET is a means by which the exchange of goods and services takes place as a result of buyers and sellers being in contact with one another, either directly or through mediating agents or institutions.
Adding economic theory to this definition, MARKET prices can go both up and down when influenced by supply and demand. Demand is currently being restricted by the FED. Buyers want to buy, but are demoralized by the wet blanket of high mortgage rates and increasing prices. Both prices and interest rates may have to come down to increase affordability and sales volume. The decrease in prices will not be tragic, foreclosures will not be a major problem. Owners can remain in their homes thanks to their low fixed-rate 30-year mortgages. The drop in interest rates will also not occur precipitously. Look for this year to be like last year, and next year to hopefully to be the year of recovery due to lower rates.
Oh, one final thing. We have a major election in November. Buckle up. Major elections can cause major changes, or not. Back to my dictionary to look up “UNKNOWN FACTORS”.
I would love to hear your read on this market. What do you think is happening?
Chuck