The FED has been trying for over a year to slow down the economy. How does it measure a slowdown? When job creation ebbs and unemployment rises. We finally are seeing pain. Inflation has been heading back towards the 2% FED target, while job creation has been dropping and unemployment has been rising. The FED defines this as progress in the fight against inflation. It does cause pain in the workforce. It does appear they have been successful in slowing the economy.
The stock market tends to agree, the DOW down over 2,000 points between last week and today. It is a forward indicator.
Will any good come of this? The FED will begin to lower interest rates, probably starting next month. That means mortgage interest rates will also begin to come down. It will take a while. A slowing economy causes a decrease in consumer confidence. Even though buyers will be able to get better mortgage rates, it will take a little time for them to feel confident to take out those big loans. It will get better, it will just take a little time.
But will housing prices come down? The housing shortage is a long term problem, not one that canott be quickly solved by interest rate cuts.
NAR economist Lawrence Yun recently shared some very interesting information. Below is a sampling from his presentation.
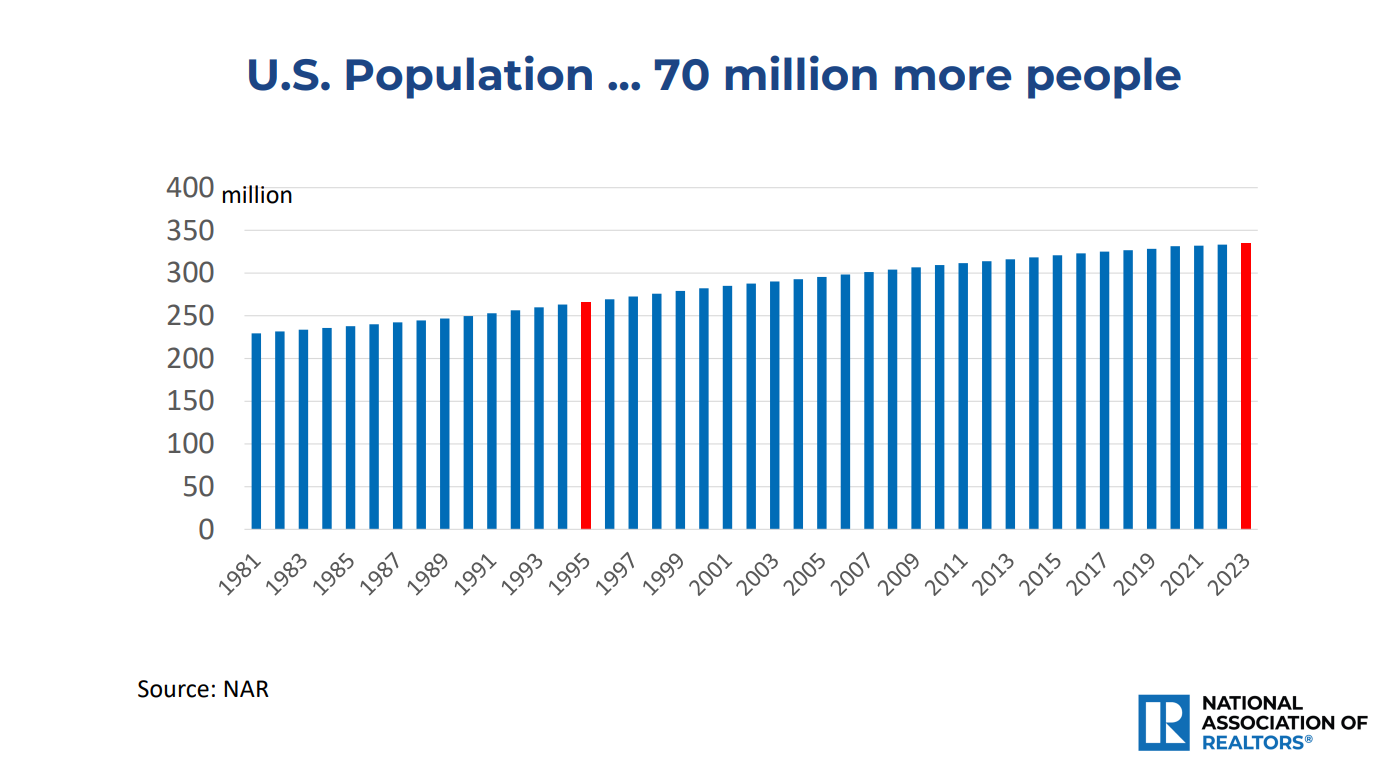
He decided to look at what has transpired since 1995, over the last 30 years. During that time, the U.S. Population grew by 80 million people, from 250 million to 330 million. An increase of 32%. Over 2 .7 million people per year. All those people need places to live.
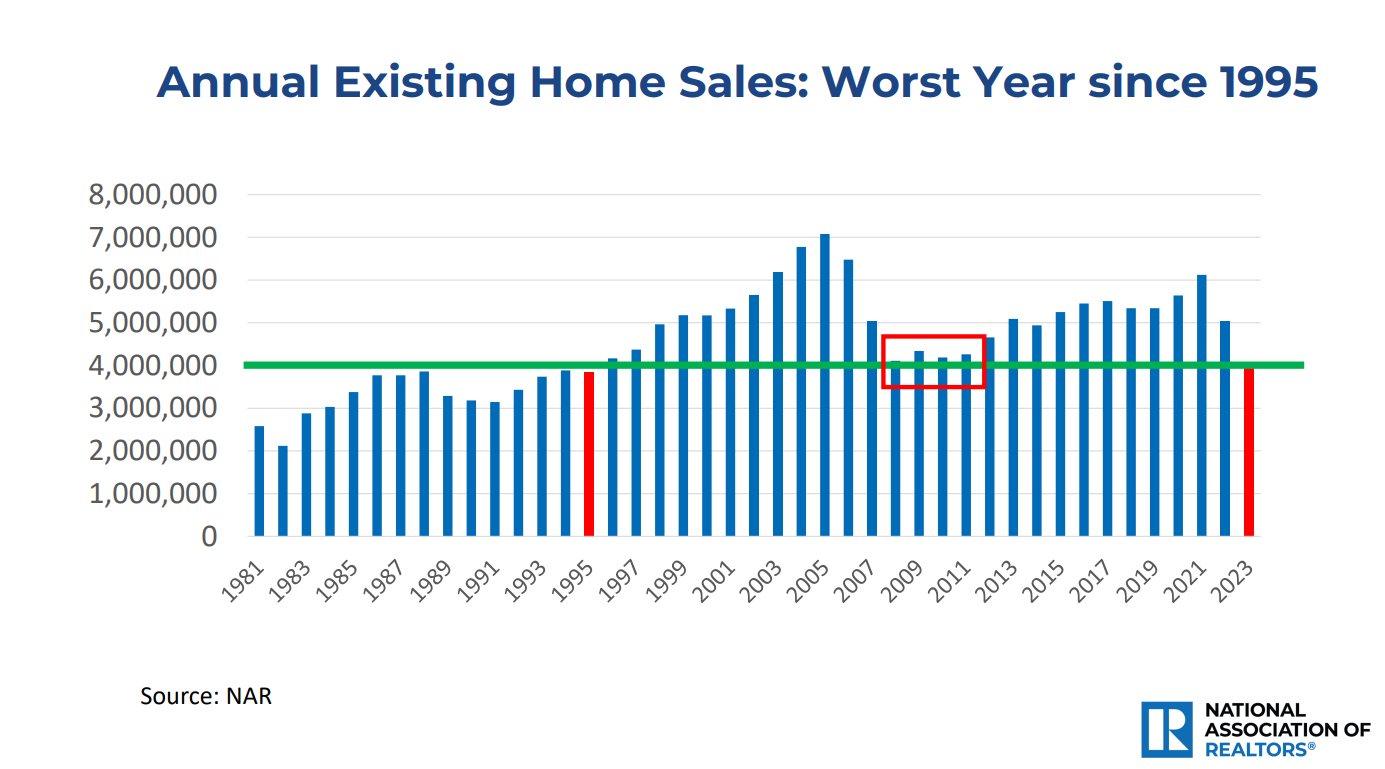
How many homes are being sold to handle that population growth? The chart below may have a lot to do with his choice of dates. 2023 was the worst year for sales since 1995. The low volume of sales mirrors the Great Recession years of 2008-2012. Housing sales have not kept pace with the strong population growth.
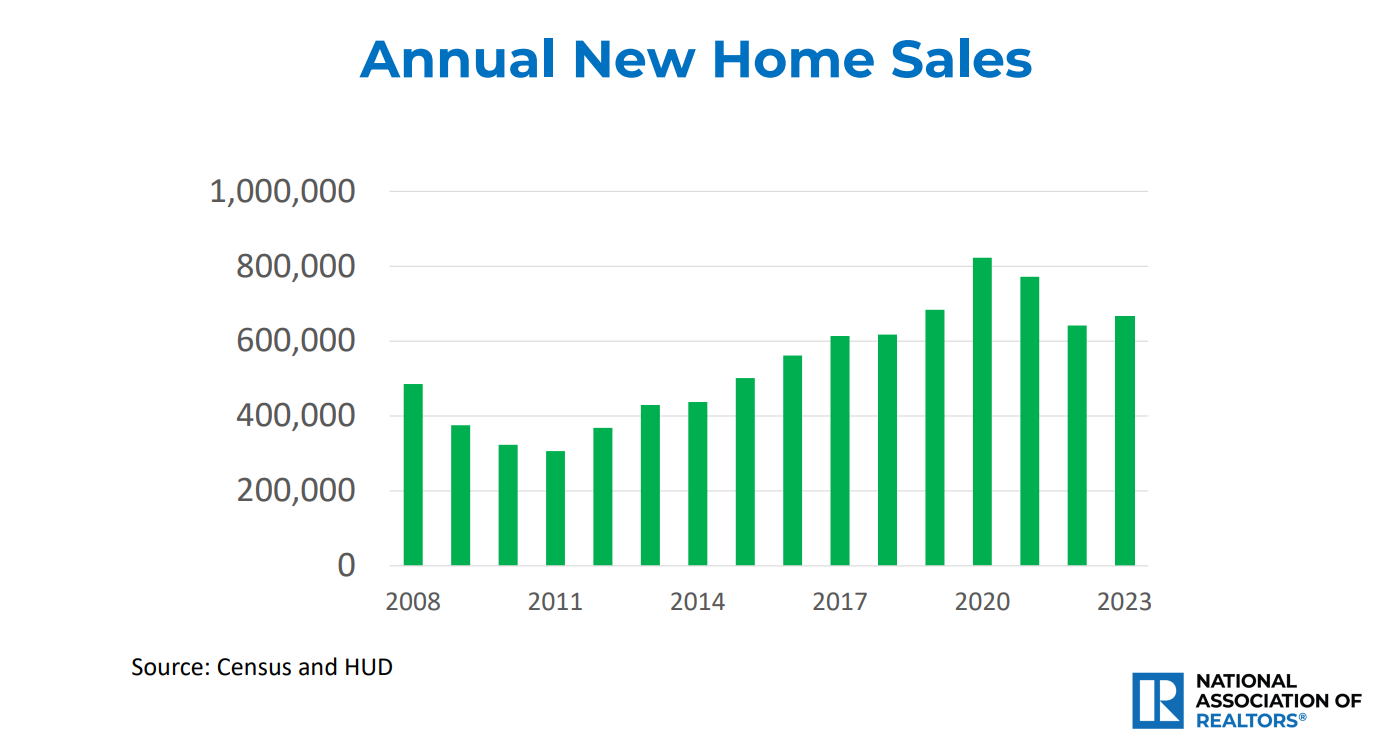
Housing is not a zero sum game There are new homes being builtg every year. But not enough to make a major difference. We are buidling between 400,000 and 600,000 new homes a year. Those 80 million people create roughly 2.4 new families, or 33 million new family units over 30 years. One million plus a year. We should have been building one million new homes a year.
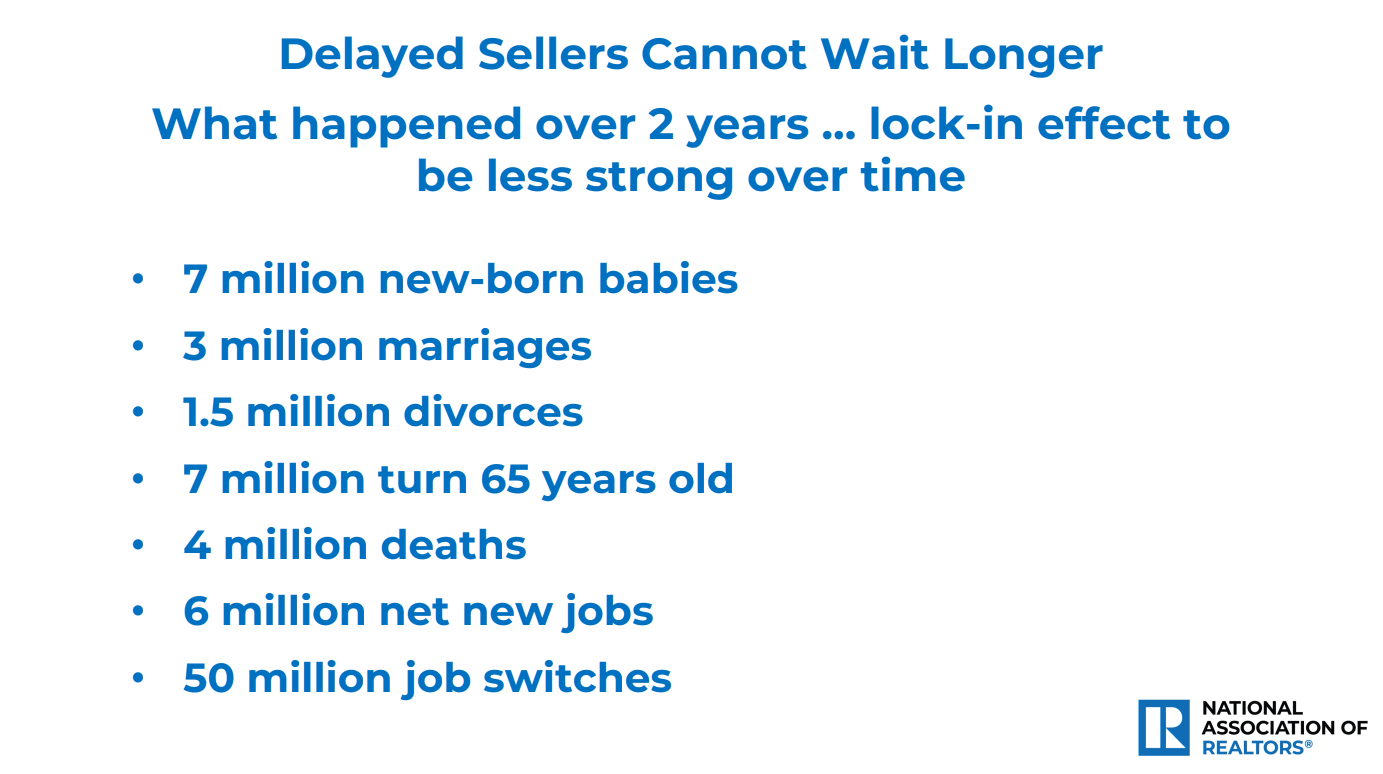
Homeoners like their homes, but currently they also love their low fixed-rate mortgages, sometimes below 3%. They are staying in their current homes. It is called the lock-in effect.
If that’s true, why haven’t sales dropped down to zero.? Home sales are not solely dependent on price and mortgage rates. There are many reasons why homes are placed on the market, and why people move from one home to another. The figures below tells us what happens over the span of two years, why people want to move, need to move, why people want to own a home, and why people have reasons to sell their current home.
Home sales are influenced by many factors. It is an ongoing process of life. During the 30 year span he chose for comparison, how did home sales do? In spite of the increase in population and family units, home sales are having their worst year since 1995, also their worst year since the Great Recession of 2008-2012.
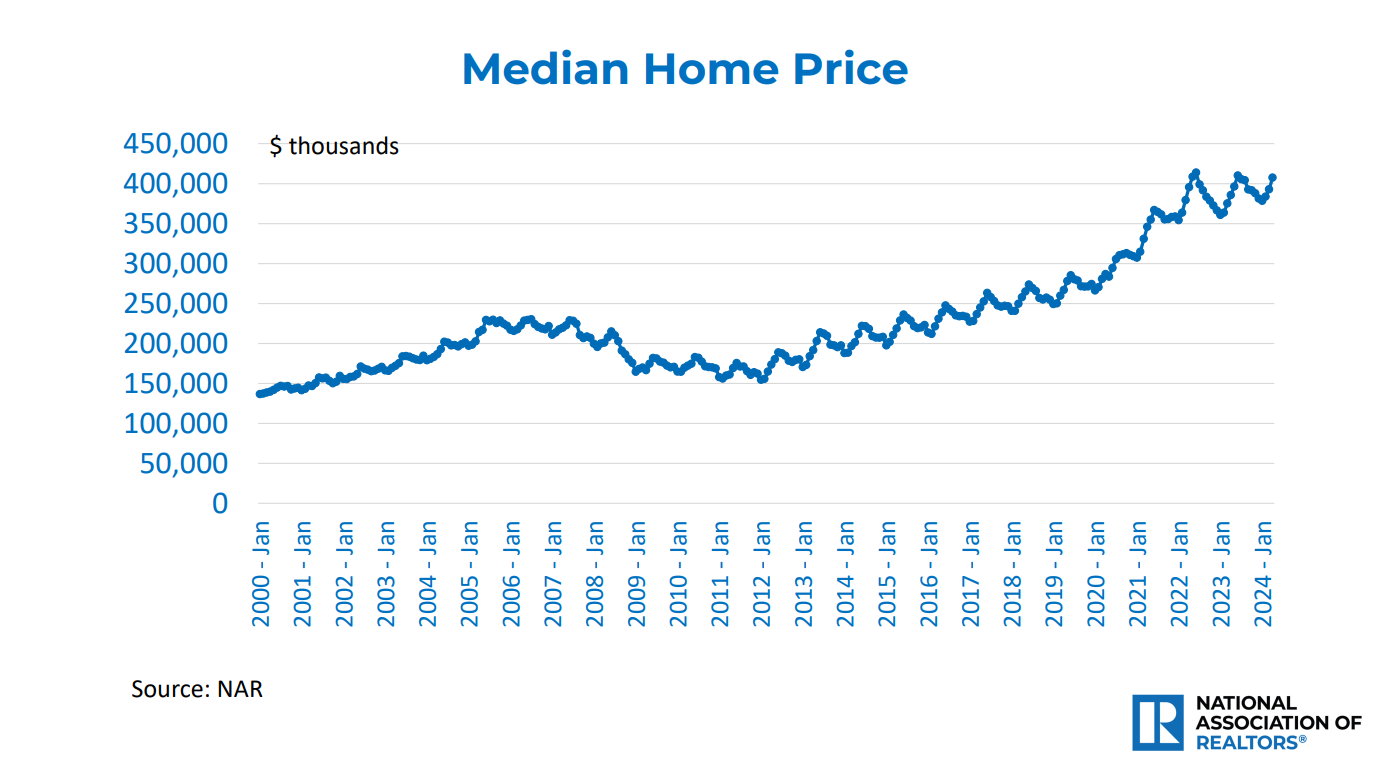
Low inventory of homes available for sale has caused prices to strongly increase. Supply and demand. We will get to our local prices in a moment. For the entire country, how have housing prices tracked? Since 2000, U.S. median home prices have gone from $150,000 to currenly $400,000, almost tripling in value. It is not just California that has experienced strong appreciation in housing prices due to a shortage of homes, the entire country has seen prices rise substantially.
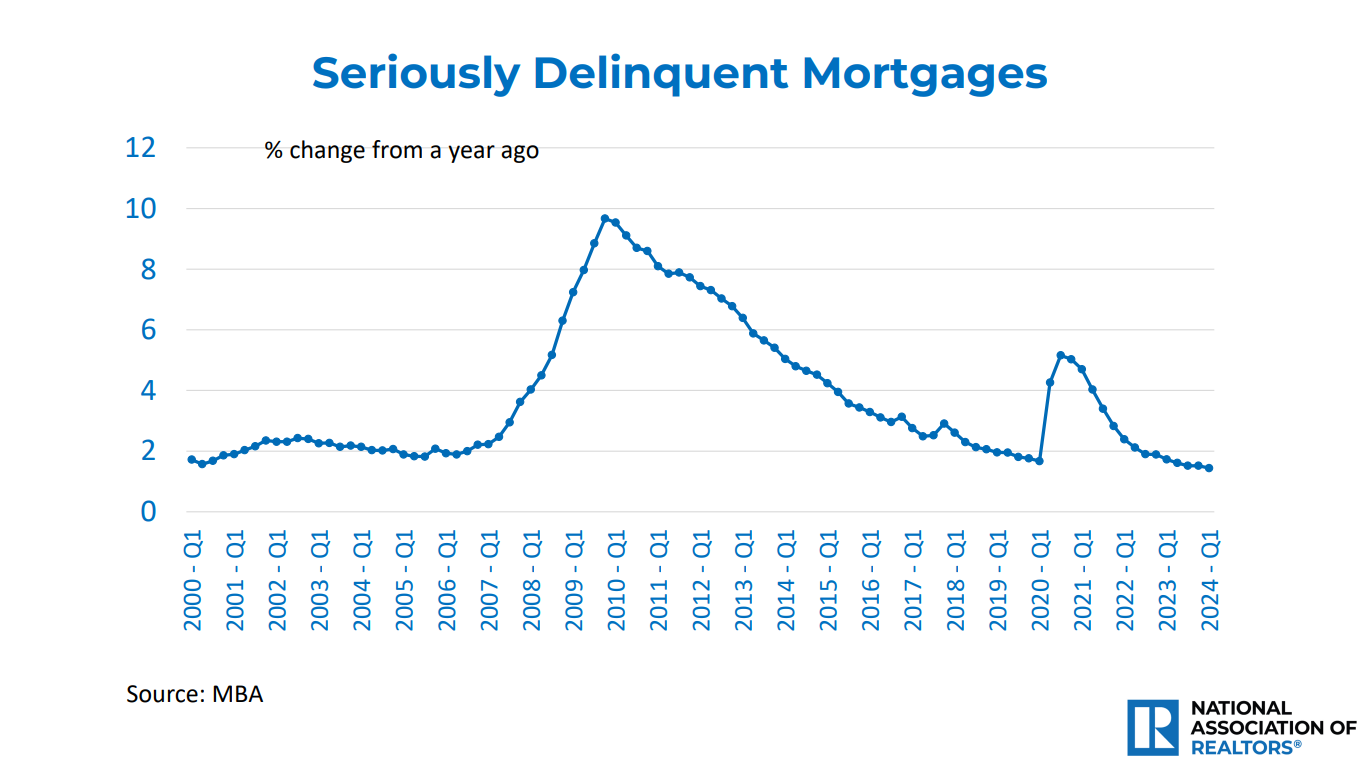
When prices rise that strongly, some suggest a correction is in order. Many are using the Great Recession 2008-2012 as an example. That correction was due to adjustable mortgages, panic selling and foreclosures. The strongest factor preventing that from happening today is the amount of equity homeowners currently have, in addition to the predominance of fixed low-rate mortgages. Adjustable mortgages prevelant during the Great Recession caused people to walk away from their homes as payments became seriously delinquent. Today that is not a factor. Mortgage delinquencies are at historic lows.
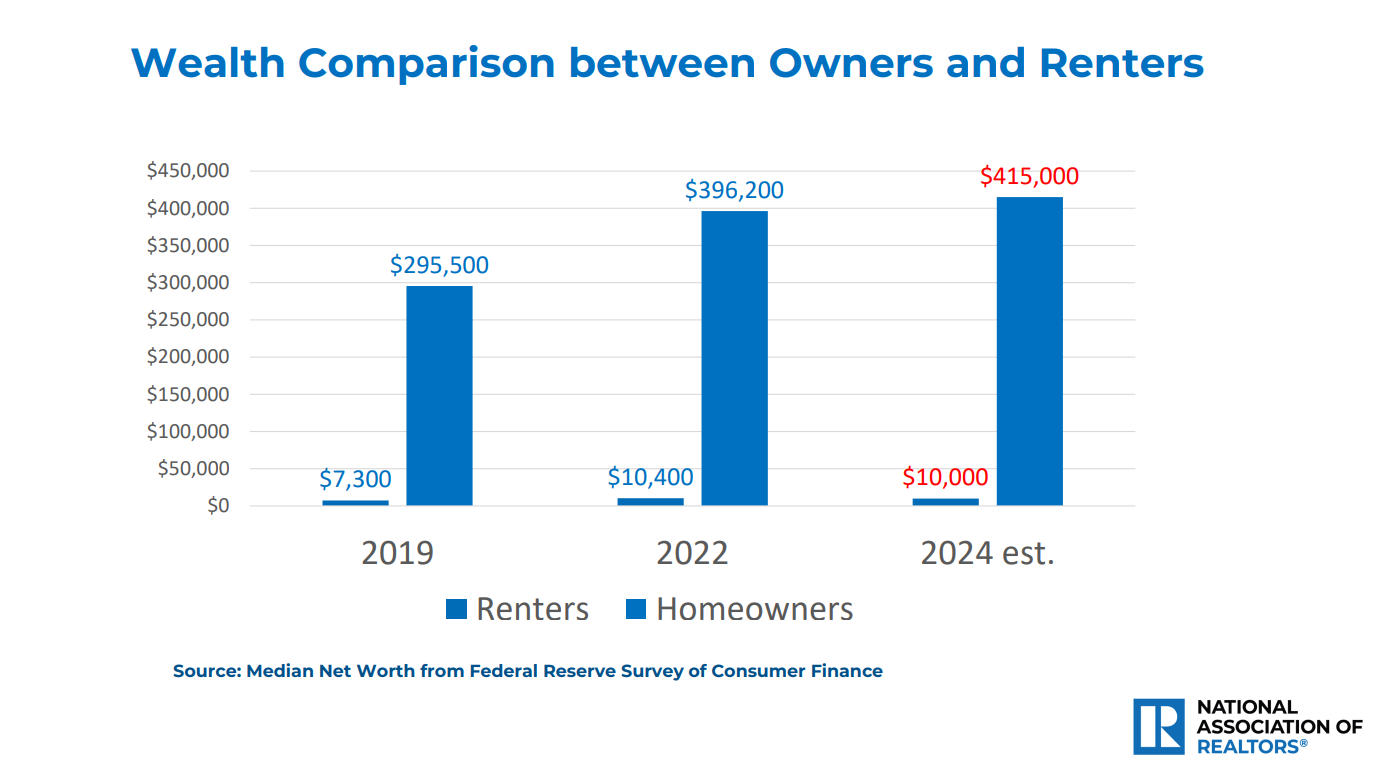
Why do people consider it worthwhile buying their home instead of renting? The chart below highlights the the financial benefits of homeownership. Most homeowners have never seen a better investment. Inflation may be considered a bad thing, but it can also be pleasant when considering the return on investment in a home.
I wanted to share those charts because they point out how housing is a national issue, not just a local or California issue. Let’s see how our local markets have been responding.
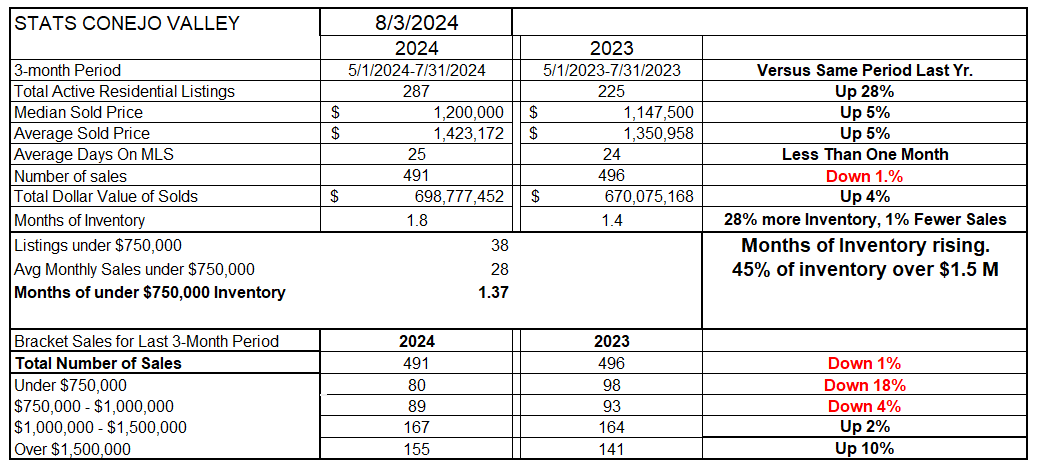
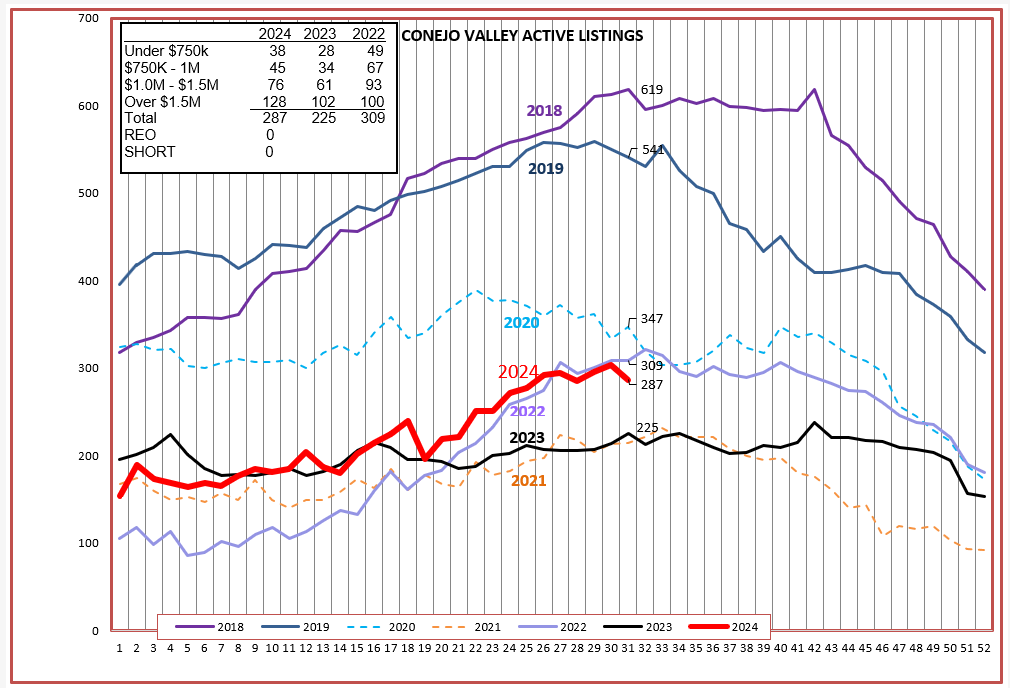
For the Conejo valley, inventory has been growing rapidly, up 28% from the same time last year. Our inventory remains heavily anchored by the highest price tier of homes, with close to half of the inventory offered for over $1.5 million. Price increases have been moderating, still up 5% from last year. Due to high mortgage interest rates, near 7%, sales are down by 1% from a year ago. But remember, last year was a very weak sales year. Sales are down almost 50% from 2022, one of the strongest sales years on record. Sales are trending higher in the highest tranche above $1.5 million, currently representing 31% of all sales. All other sales, below $1.5 million, represent 69%. High priced homes are selling.
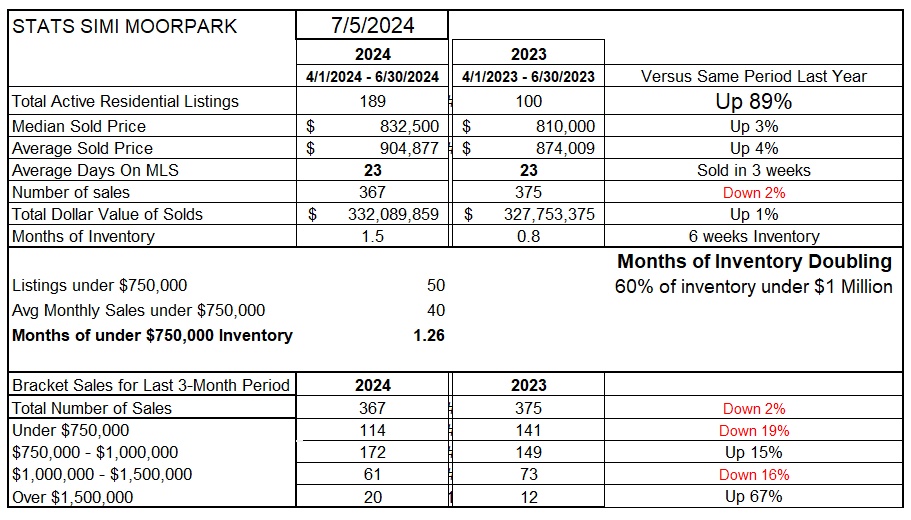
For Simi Valley and Moorpak, inventory is up a whopping 89% from the extremely low inventory levels of 2023. Price increases have moderated, now 3-4% above 2023 prices. Listings are still flying off the market, and although down only 2% from 2023 are down close to 50% from 2022. The combination of inventory growth and slowing sales has seen the computed months-of-inventory number double to 6 weeks. For Simi Valley and Moorpark, 79% of sales are under $1 million.
Inventory in the Conejo has been following the normal seasonal trend, although only half the inventory level of pre-covid 2018 and 2019. The good news is that inventory has been rising, and when interest rates begin to return to normal levels, sales should pick up.
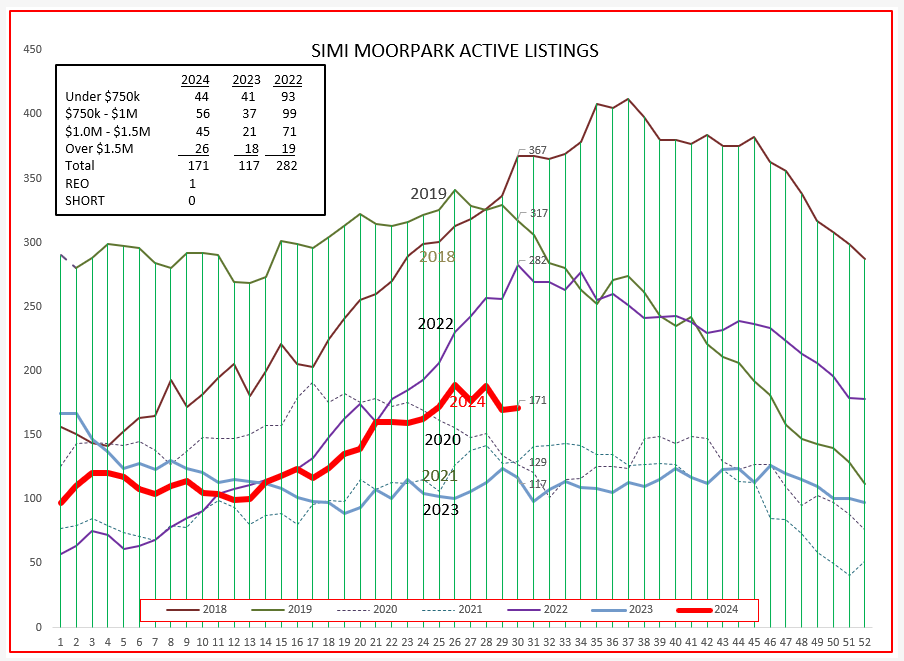
For Simi/Moorpark, inventory has been increasing strongly. Having only one bank-owned property (REO) is another example of how equity and lack of delinquent mortgages have provided good price stability in our marketplace.
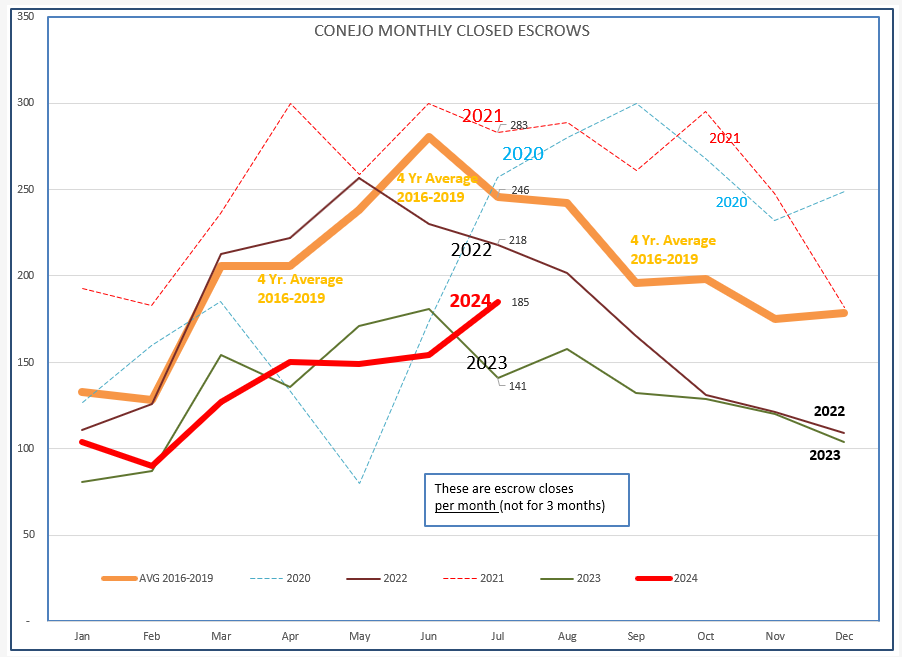
The Conejo sales chart showed strong gains in July, and follows the usual trend of sales we expect, although at a lower level. Sales usually level off as the year ends, but if interest rates do come down, we should see sales break that trend and continue to increase.
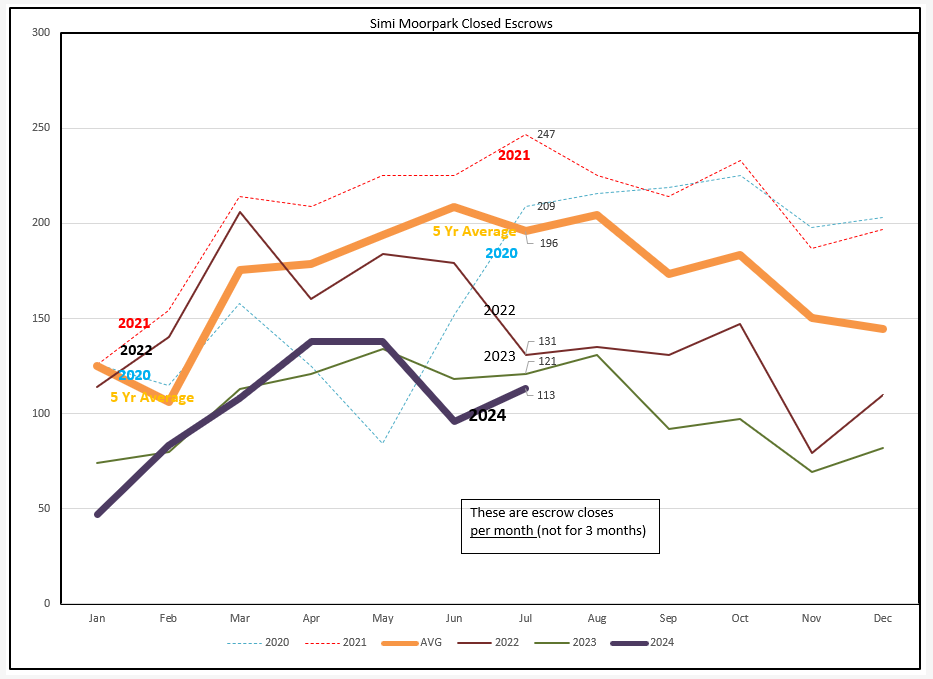
For Simi Moorpark, June and July sales were not as strong. This area is more dependent on mortgages rather than all-cash sales, and the hoped-for decrease in rates should assist sales.
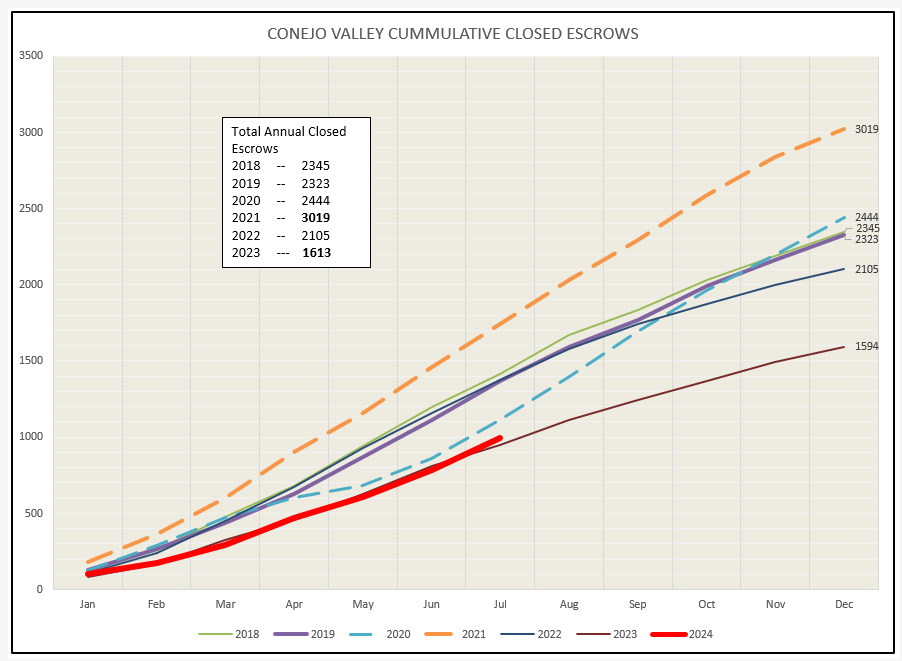
Look at sales a little differently in this cummulative chart, where sales numbers continue to add up as the year progresses. We can see sales breaking down past the very low 2023 line. Hopefully 2023 will set the record for low sales, and 2024 will be the turnaround year. We will have to see what the FED does.
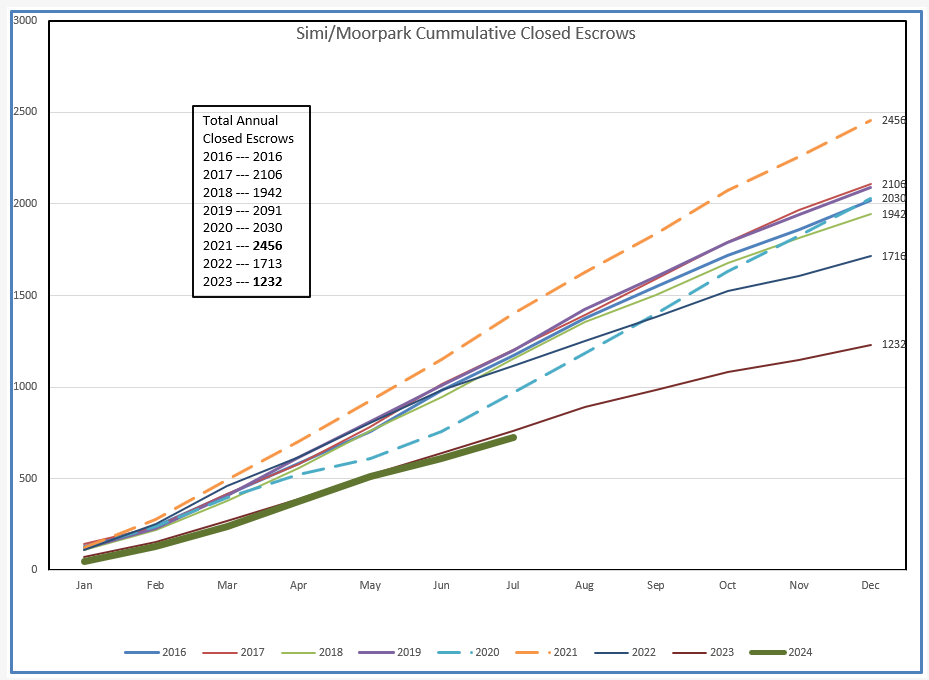
Simi/Moorpark sales are still tracking slightly below 2023. If the FED does not begin to act, we will be setting new low records. It finally looks as if the FED will begin to make lowering moves. My fingers have been crossed for months.
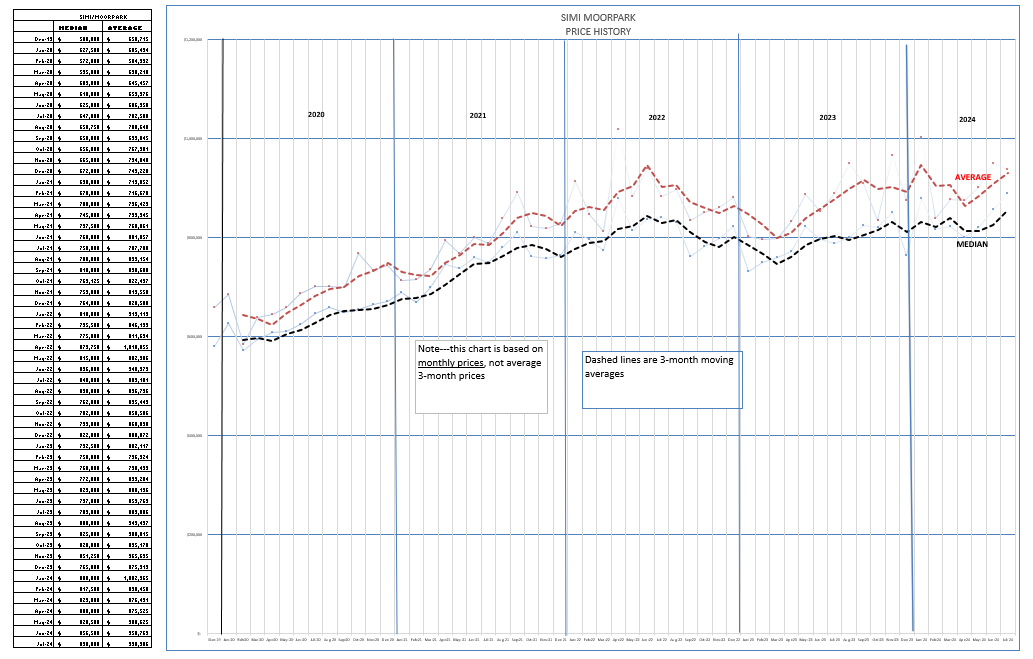
Finally, prices. Still very strong, but also very much following an annual pattern of peaking in the summer and then weakening. This has always been part of our housing market, but never this pronounced. These numbers are individual monthly medians and averages, unlike the three-month averages used in the statistical tables.
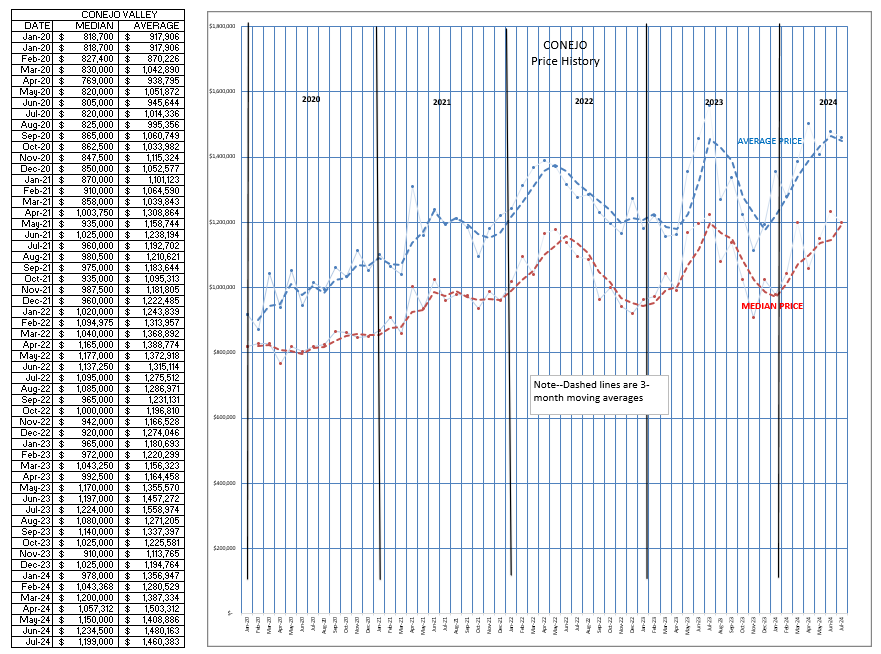
SImi/Moorpark graphs show some anomalies compared to the chart above. For those of you that sell in SImi/Moorpark, perhaps you can enlighten me as to why the charts are so different from Conejo. I don’t have all the answers and would appreciate your insight.
This blog has been longer than usual, first borrowing from NAR national statistics and then drilling down to our local market. I usually compare the state of California market to our local market. I hope this has shown that all our markets are related, dealing with the same issues and market forces.
We are at an inflection point. Finally. Economists have talked for over a year about reducing rates and a soft landing. This month things are beginning to look at a harder landing. Economic weakness is a world-wide issue, with international stock markets reflecting concern for the future and the central banks of most countries reacting with interest rate cuts. Interest rates have been previously described as “higher for longer”. We are in for a change. One that should eventually be good for homeowners, the housing market, and real estate professionals. It will happen over time. As the stock market gurus are advising today, don’t panic.
Hang in there, and be careful out there.
Chuck
Greatly appreciate this information. Difficult to gather this information in one place.
It represents a lot of work and dedication. A big thank you!!