For a variety of reasons, I decided not to publish a blog last month. I wanted to see if the trends were changing, and one point on a graph representing the beginning of this year does not foretell much.
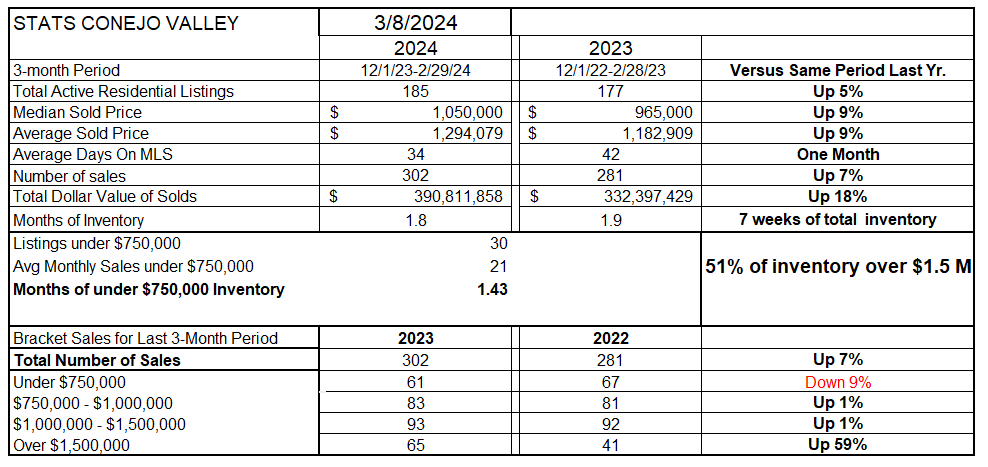
Conejo Valley inventory is still low. Year over year, inventory remains only a smidge higher than last year. Delving deeper, over half (51%) of this inventory is priced in excess of $1,500,000. The remaining inventory totals only 92 listings.
Sales volume is also low, limited by both a lack of inventory and high mortgage rates. And yes, prices continue to be strong. Both Median and Average prices are up from last year by 9% .
Closed escrows are up 7% compared to the same 3-month period last year, and the combination of higher prices and an increase in the number of sales has raised the total dollar value of real estate sold in the Conejo over the past three months to close to $400 million, 18% higher than last year. Based on current sales, months-worth of inventory remains below two months. One thing of note is the resurgence of the highest price segment, closings up 59% over last year’s anemic numbers.
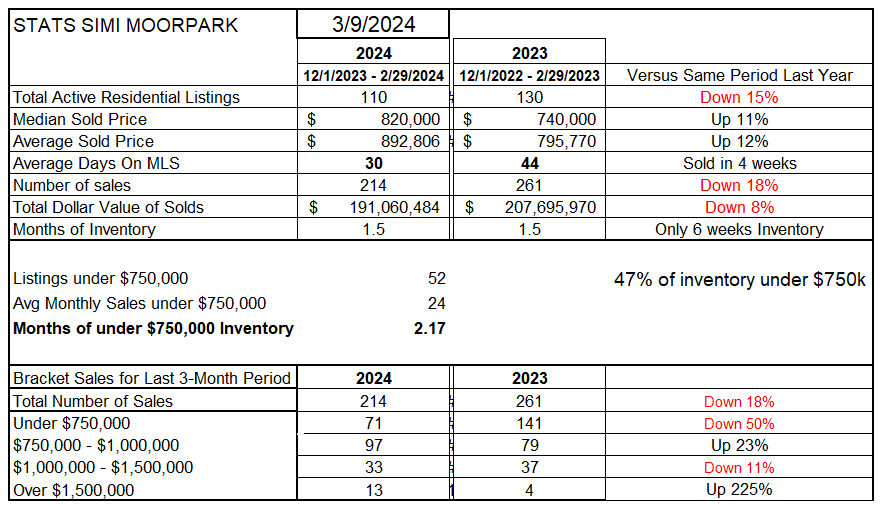
For Simi Valley and Moorpark, inventory continues very low, down 15% from last year. Prices continue to show strength, up 11-12%. Sales happen quickly, sold in 4 weeks.
In contrast to the 7% increase in sales volume experienced in Conejo, the total number of sales in Simi/Moorpark in the past three months is down 18% compared to a year ago. There is enough inventory for 6 weeks worth of sales.
Unlike the high priced inventory segment represent 51% of listings in Conejo, Simi/Moorpark reports 47% of listyings in the most affordable price segment, below $750,000.
Finally, although the numbers are small, the number of sales exceeding $1,500,000 increased a massive 225%, split between 7 sales in Moorpark and 6 sales in Simi Valley.
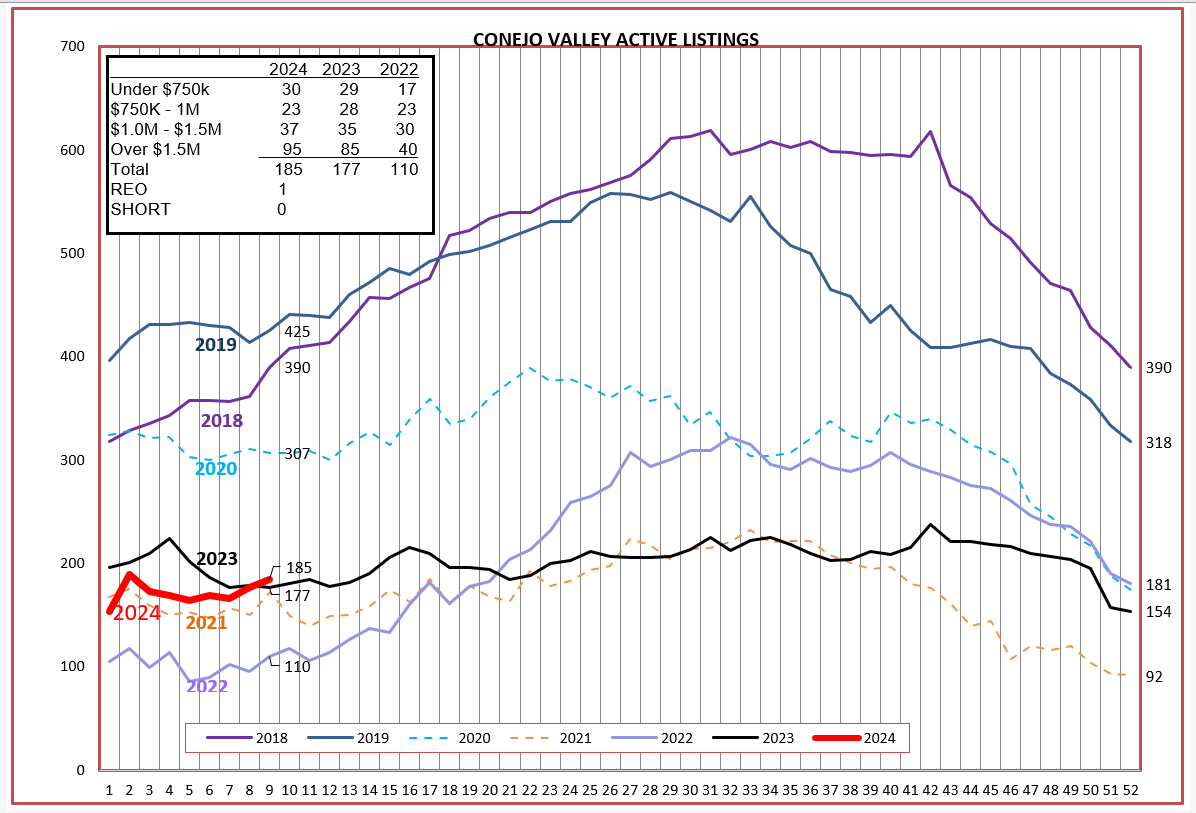
Looking at how Inventory is behaving after the first two months, you can see in the inset box the similarity between 2023 and 2024, versus the extremely low inventory of 2022. There is not yet enough 2024 experience to determine whether we will behave like a “normal” year or flat years like 2021 and 2023. The COVID years of 2020 and 2021 are represented by the dotted lines. 2022 actually acted like a normal inventory year, although iat a much lower inventory level. What happens when inventory is that low? Prices rise.
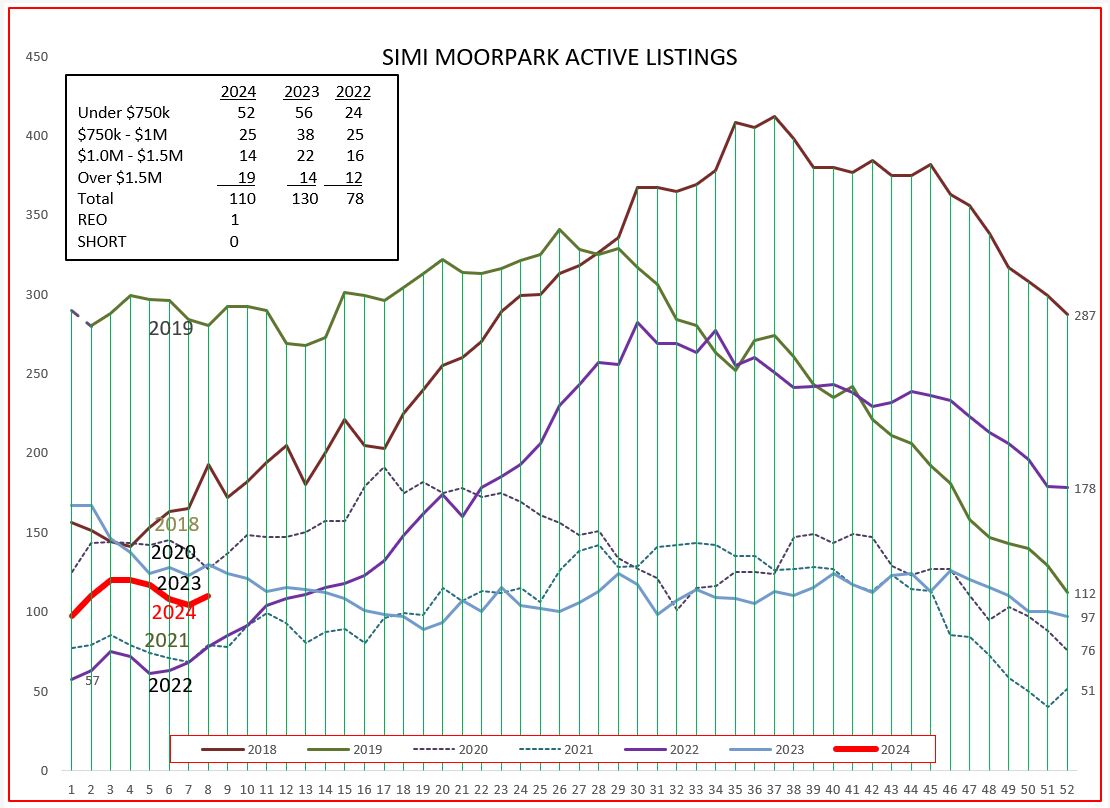
Simi Valley/Moorpark inventory behaved much the same as Conejo. 2020 and 2021 dotted lines were the COVID years. However, unlike Conejo, 2023 inventory never grew in the spring nor did it fall back in the fall. This stagnation contributed to lower sales numbers and higher price increases for Simi/Moorpark, as compared to Conejo.
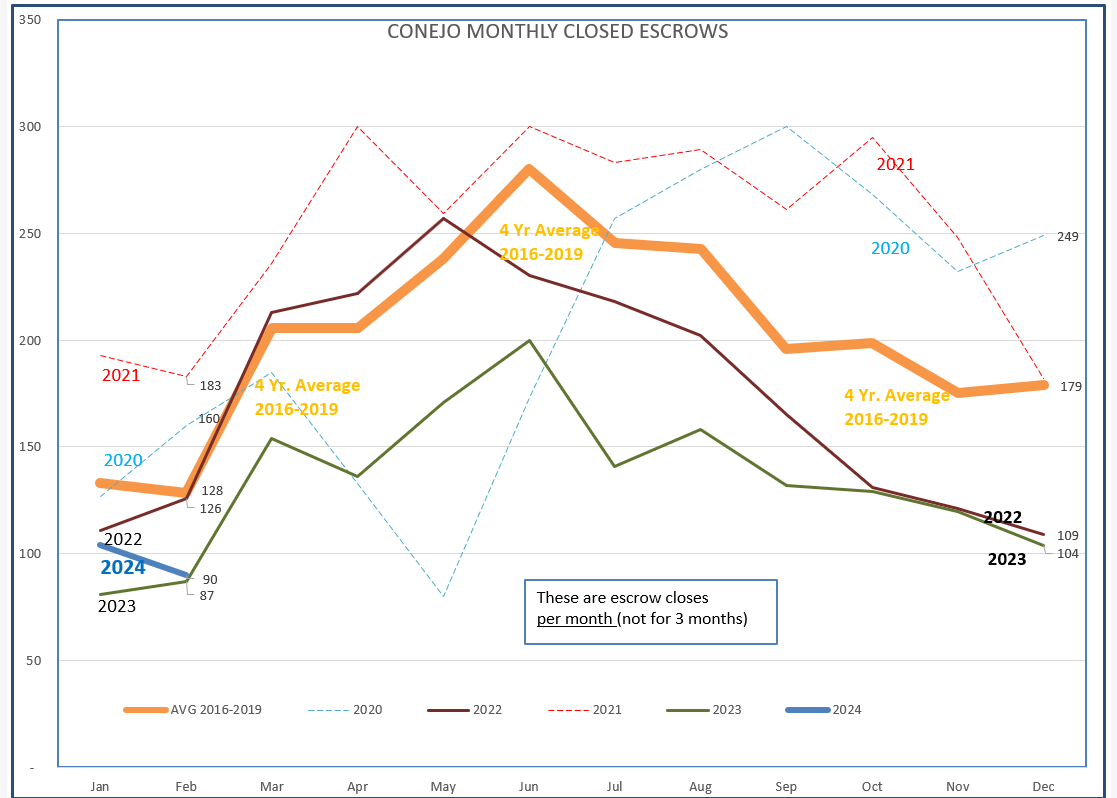
Demand is difficult to measure, but can be best seen as closed escrows, the result of demand. 2024 Conejo sales, the heavy blue line below, actually began this year mimicking average sales, the heavy orange line. Again, not enough information to determine where sales are going. FIngers crossed.
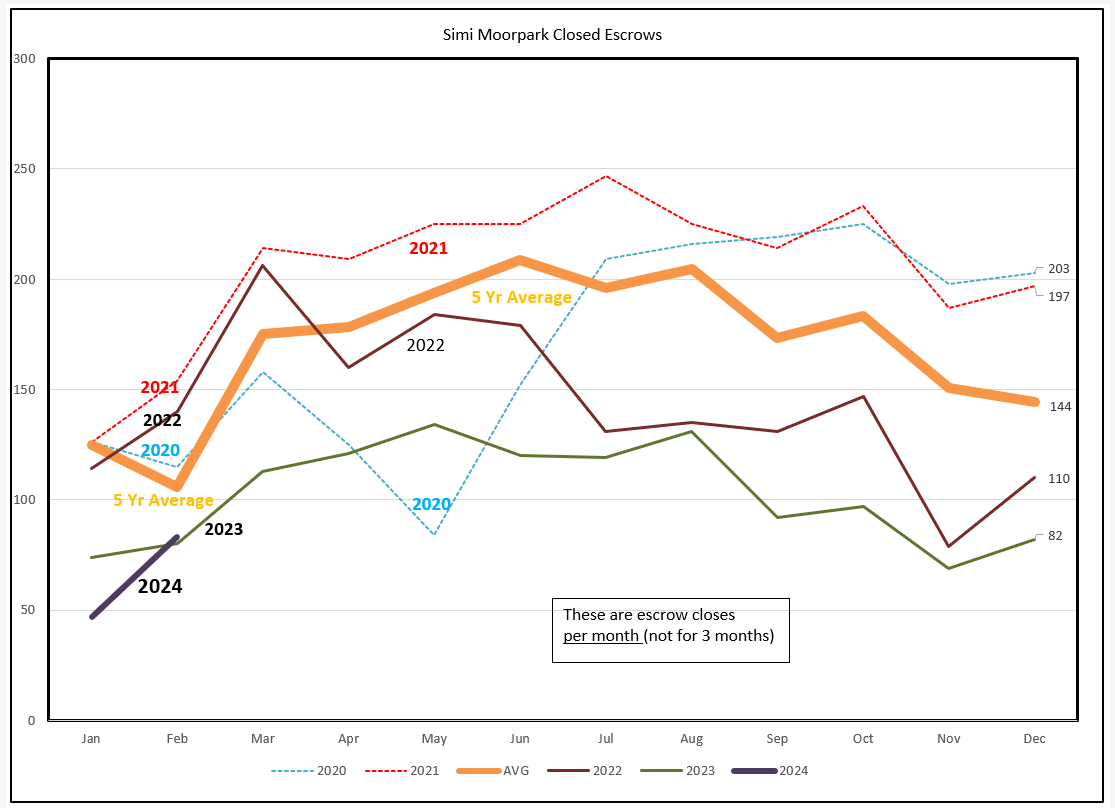
Simi/Moorpark sales began with a historic low in January, but received a nice bump in February. Too early to tell.
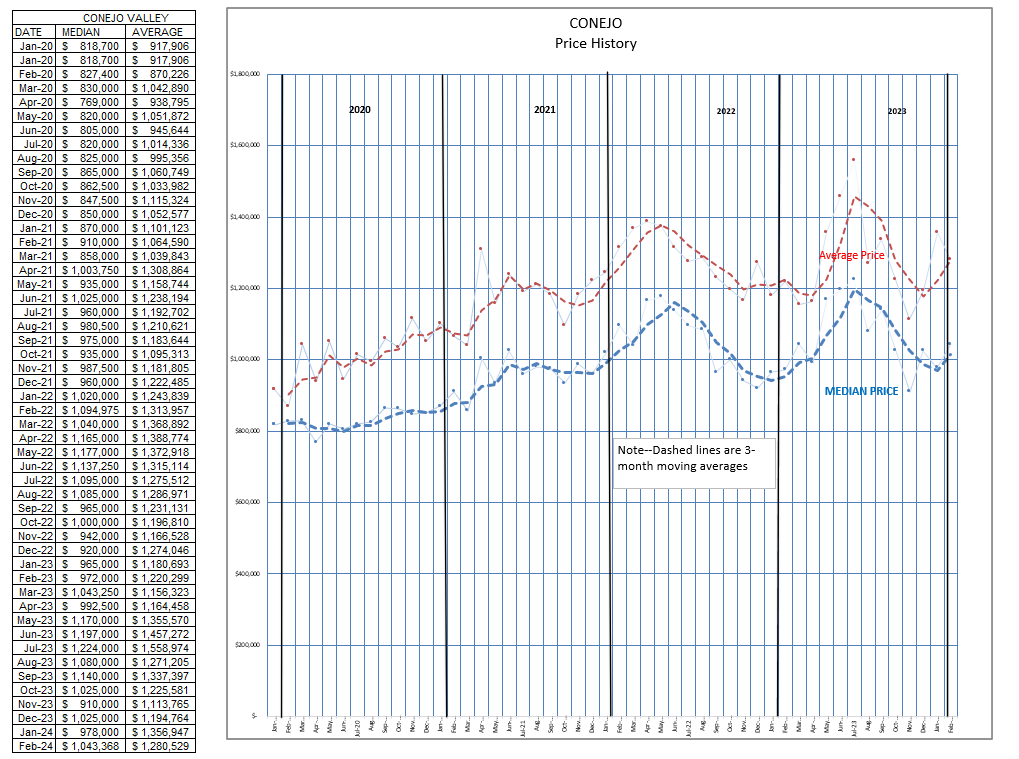
Let’s look next at prices. Prices peaked mid-yer, then dropped to the point near where the year began. We can already see prices increasing as the new year begins. I foresee nothing to change this pattern, or the continuing increase in pricing. With nothing to sell and demand still strong, prices continue to increase. The Conejo chart is influenced by the mix in sales prices. The highest price segment has a different dynamic than the lower price segments. Buyers for these expensive homes are not as influenced by the ability to get a mortgage as they are in looking for buys and their expectations of future price levels.
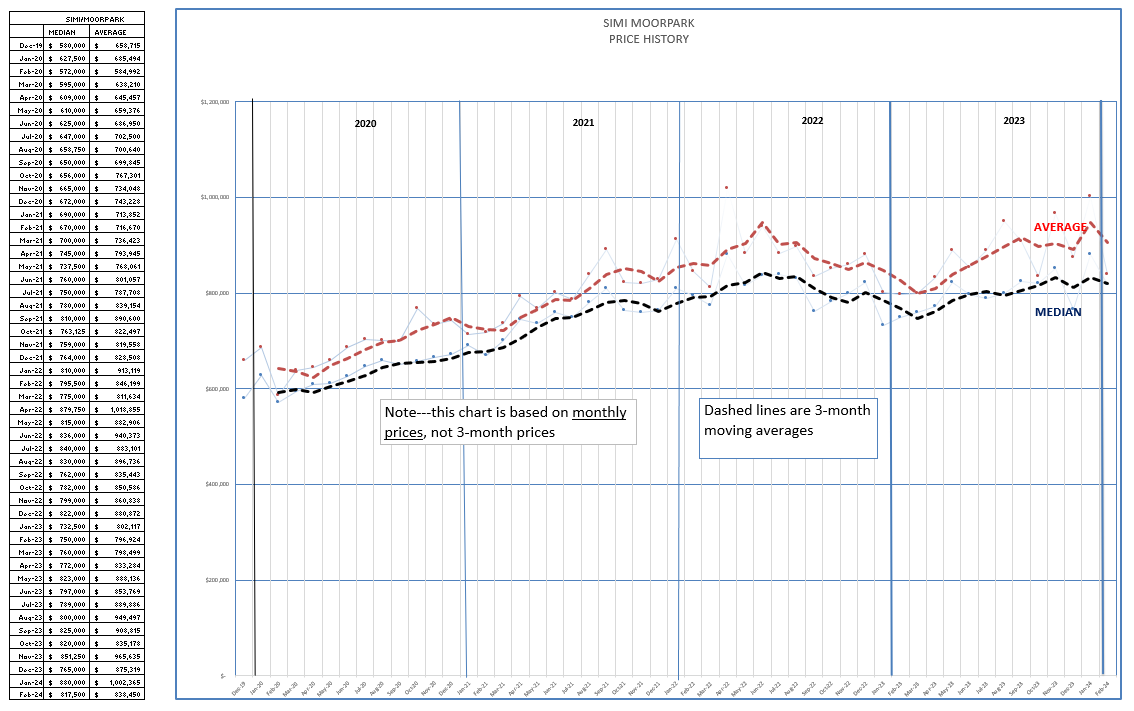
In Simi/Moorpark, the majority of buyers are purchasing median priced homes, about $200,000 below Conejo. I suppose we could call them first-time buyers, but if they are these buyers have considerable income to afford their 7% mortgages. The spread between average and median in Simi/Moorpark is smaller than in Conejo, but has been widening as more higher priced homes are being sold. Due to very tight inventory, Simi/Moorpark did not experience the end-of-year considerable price drops that Conejo did.
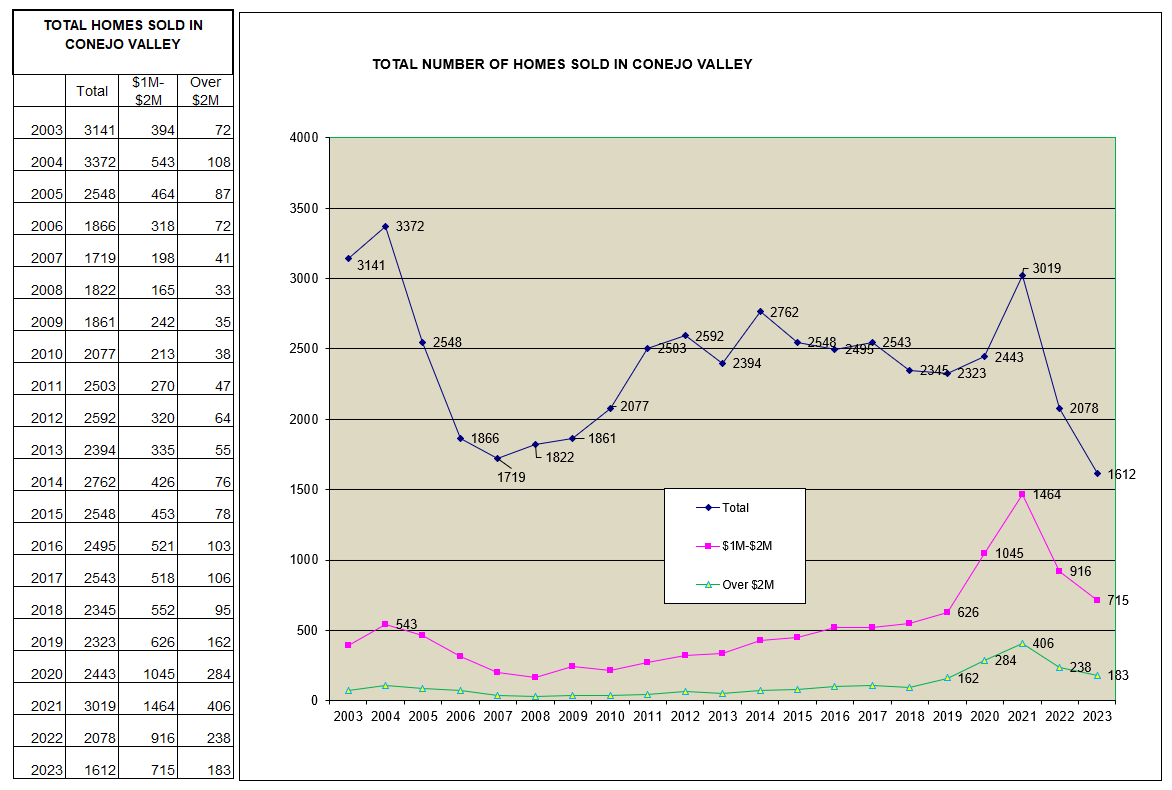
I want to remind everyone of the 10-year closed transaction history of these two valleys in the charts below. Conejo experienced a huge drop in the total number of homes sold. 2023 transactions were only half of 2021, and were the lowest number since 2003. Expensive homes, betweeen $1-2 million and above $2 million, also peaked in this same time frame.
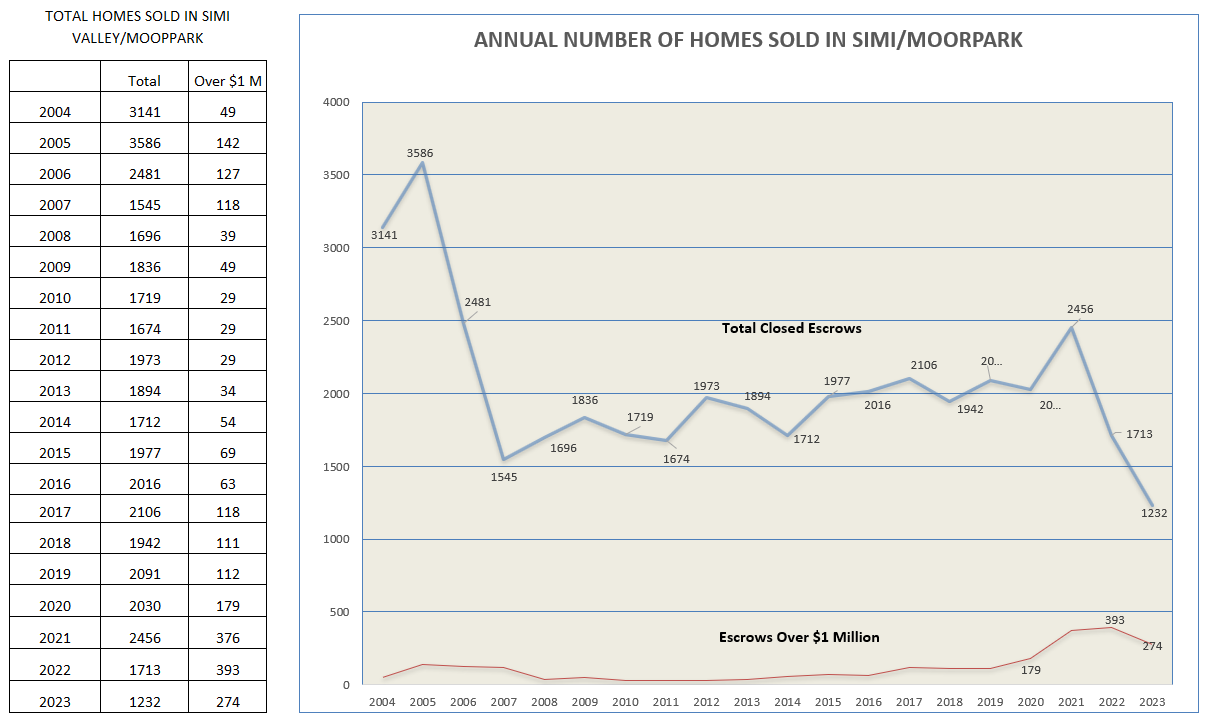
SImi/Moorpark 10-year history of sales is below. The total of homes sold in 2023 was for both valleys the lowest number experienced since 2003, even considering the Great Recession.
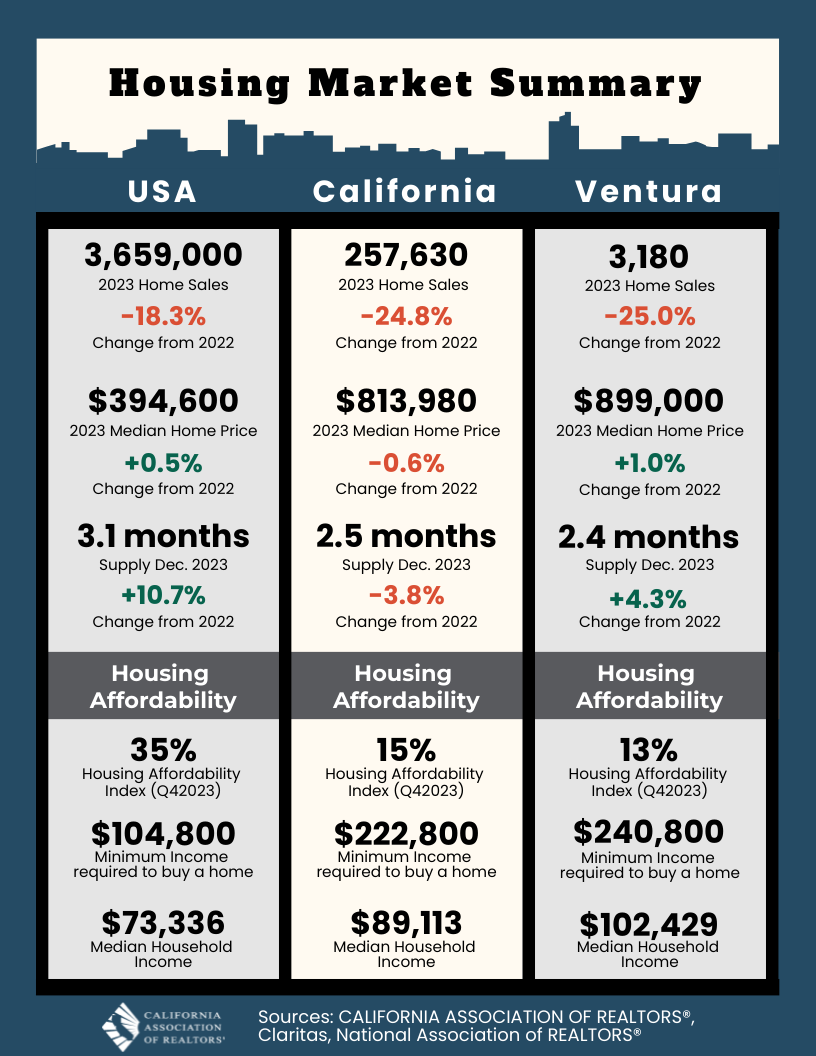
Finally, I want to recommend to all you realtors out there to look at some of the excellent information made available by C.A.R. Economists Jordan Levine and Oscar Wei. The following document is a sample of what you can easily obtain. They keep an enormous trove of excellent information, and are making it easier for you to get that information and pinpoint it for local comparisons.
If you liked last year, this year is turning out to have the same characteristics. Low inventory is pushing home prices higher, and high mortgage rates keep making things expensive for first-time buyers, move-up buyers, and even downsizing buyers.
Mortgage rates are not expected to see a real downturn until the second half of the year.
The optimistic forecast remains for a soft landing, with few predicting recession at this point.
Stay safe out there. And work hard on providing information and keeping your contacts informed.
Chuck
