May you live in interesting times. Curse or blessing? That saying serves as an ironic expression, disguising a curse as a blessing.
So where are we with the housing economy? Cursed or blessed?
Trying to bring you information about the entire economy is way above my pay grade, but there are general measures of the economy that are keys to real estate.
First, let’s talk CONSUMER CONFIDENCE.
The University of Michigan’s consumer-sentiment index, released Friday, nosedived to 50.8 in April from 57.9 last month. Economists consider readings below 80 to signal a recession. Sentiment has been falling steadily throughout 2025. Expectations for inflation also hit the highest level in 44 years, according to the survey. Sentiment declined for Democrats, Republicans and independents alike. The report has a history going back to 1952.
Consumer spending is what makes our economy run, it is the primary engine of economic growth. Making a decision to buy a house usually involves the singular most important financial decision most people make. How are consumers feeling about the future? The University of Michigan’s closely watched Consumer Sentiment index hit its second-lowest reading on record. (The lowest recorded was 50.0 in June 2022, the peak of COVID). The index was dragged down by fears of both higher inflation and higher unemployment. Since the FED usually manipulates interest rates to control inflation, and higher interest rates generally result in higher unemployment, the FED will be caught in a Catch-22 (Damned if you do, damned if you don’t)
Respondents also said they were bracing for prices to surge 6.7% in the year ahead—a level of pessimism about costs last seen in the inflation-wracked early 1980s. For those of you that were not around in the early 1980s, the Fed Funds Rate rose to 20%. My variable rate mortgage rose to 15% in 1983. Most of us now have a fixed mortgage rate, and higher mortgage rates will tend to keep us in our current homes with our current mortgages.
According to the Survey, Americans are also feeling less confident about the labor market, which has been a reliable bright spot with a more than three-year streak of unemployment around or below 4%. The share of consumers expecting unemployment to rise in the year ahead rose for the fifth consecutive month to the highest since 2009. As I recall, 2009 was not a very good year.
This is not news based on my feelings. Almost everything above has been a direct quote from major financial news sources such as the Wall Street Journal. All markets react badly to economic chaos. If you want bad news, just turn on your TV.
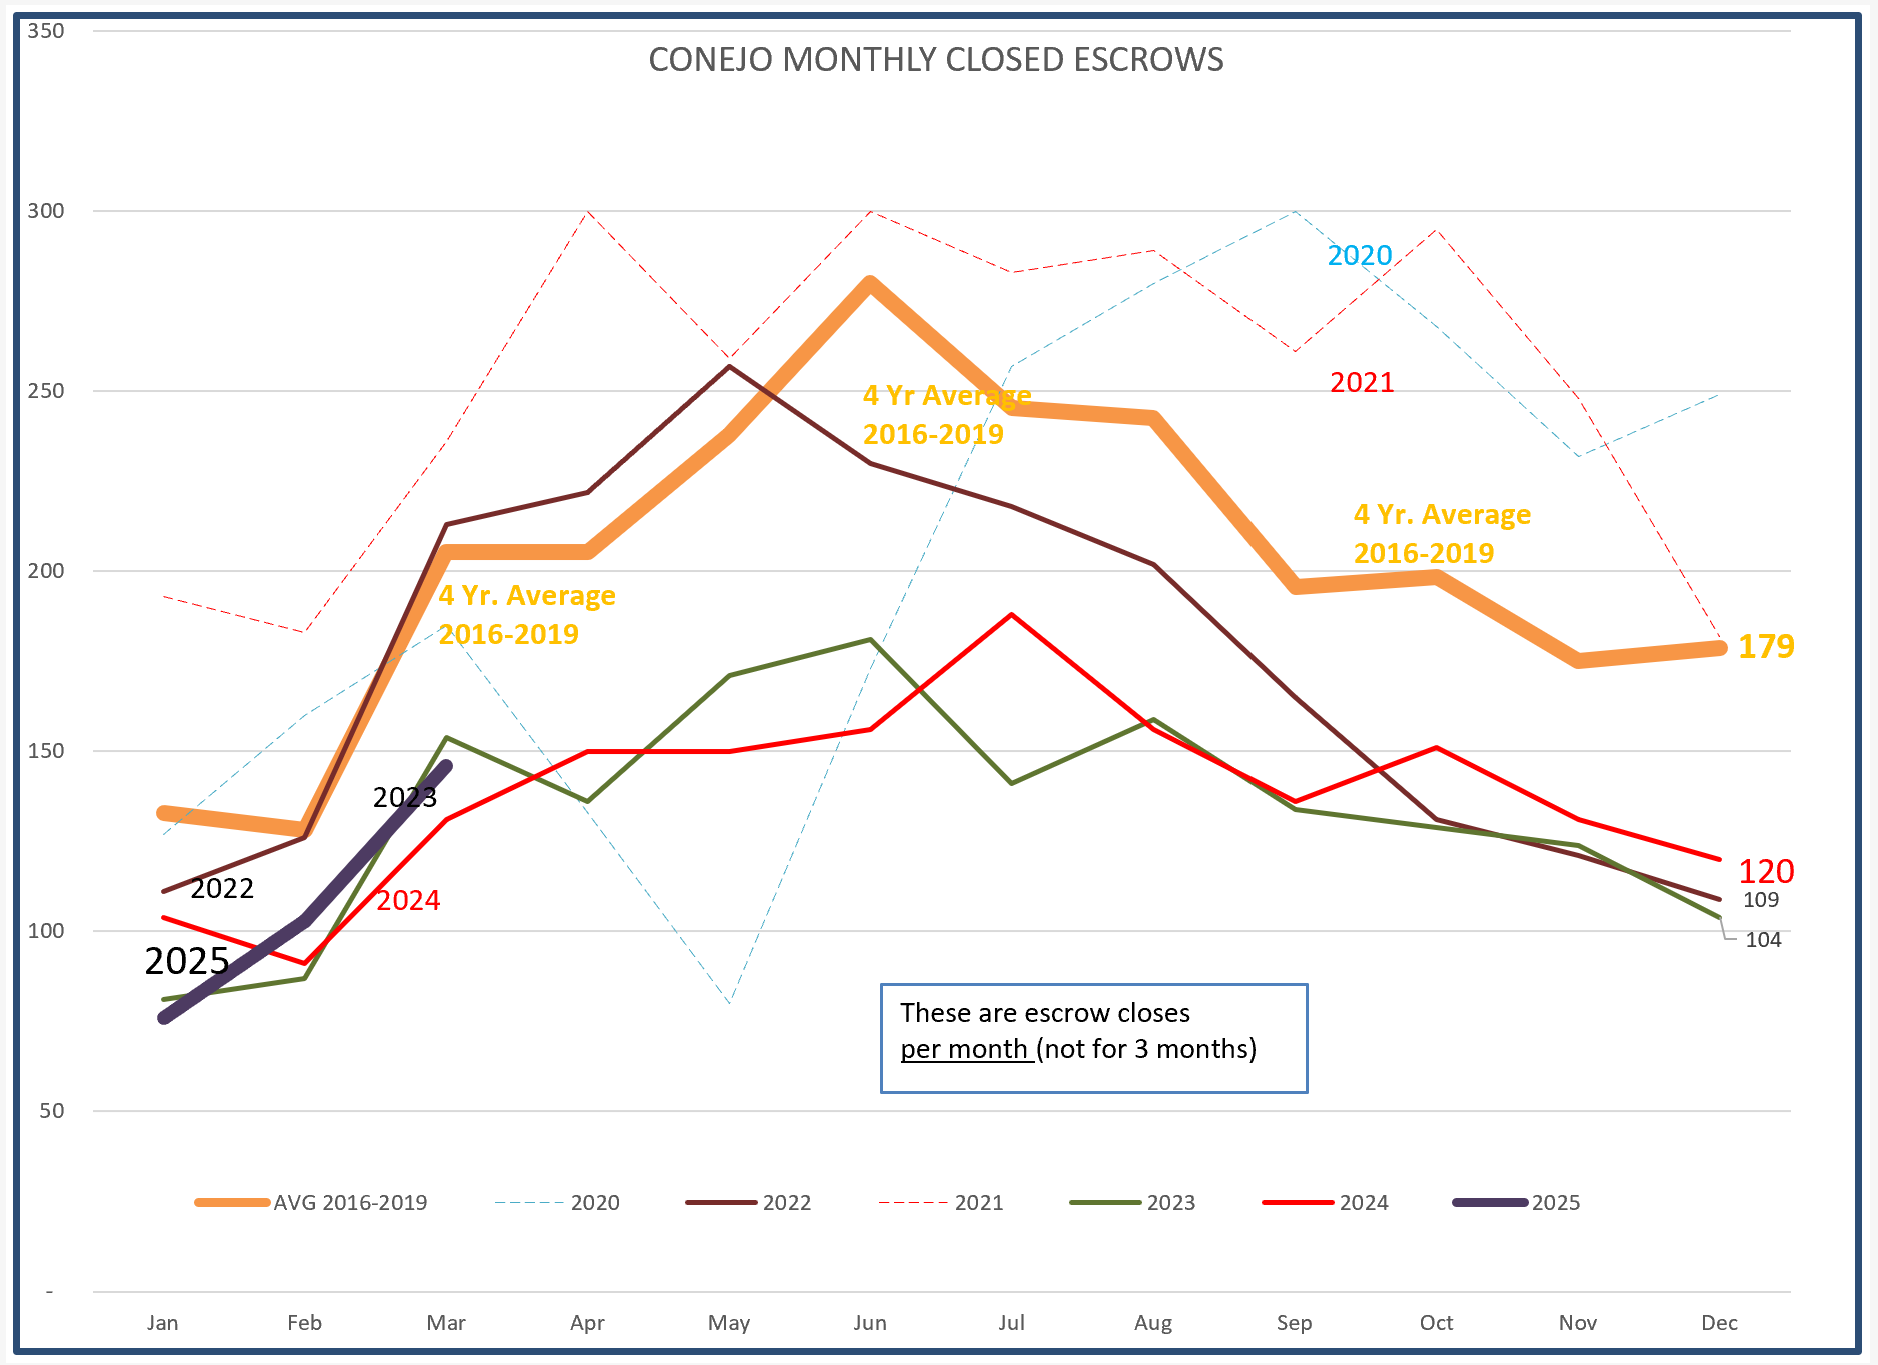
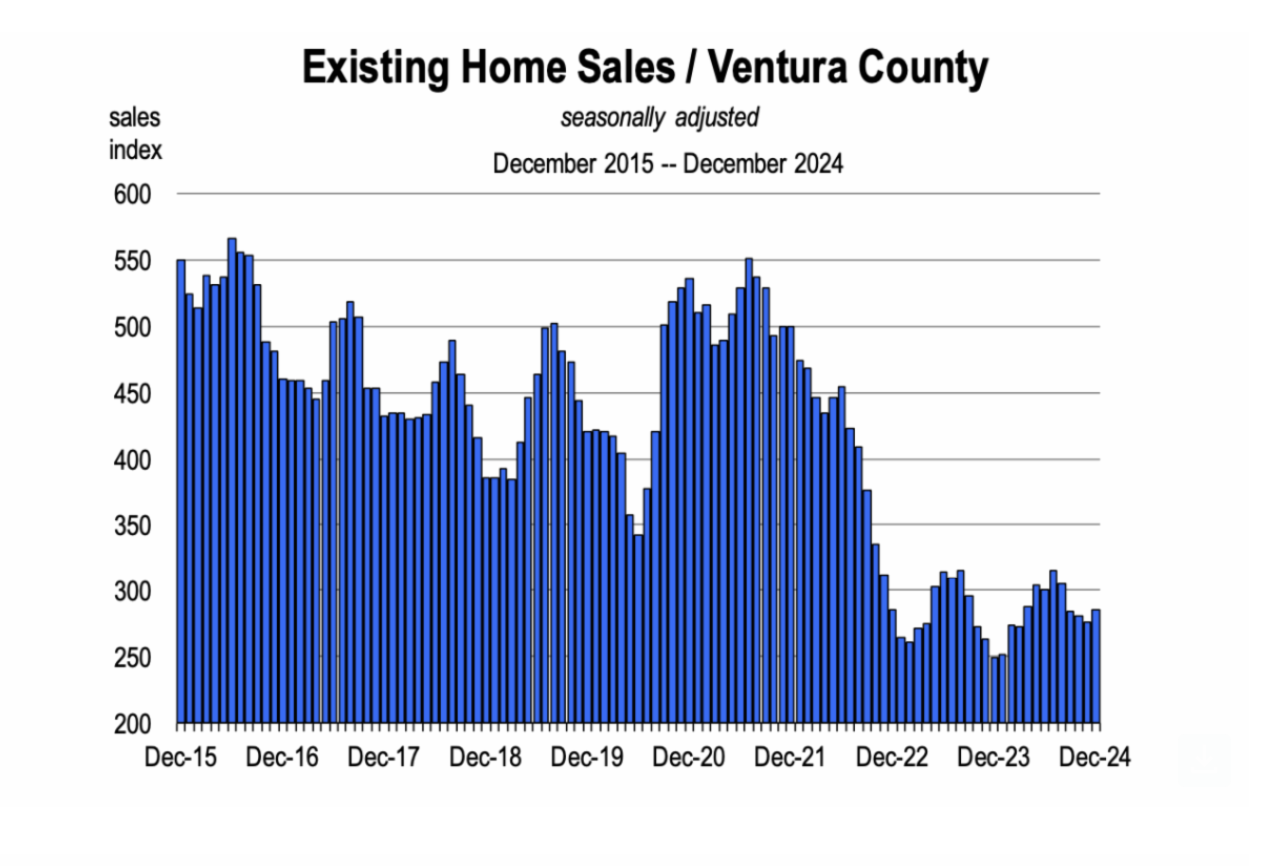
Let’s begin with the recent history of our housing market by looking at sales. The heavy black line below shows sales following the normal seasonal pattern, but at a level at the very low sales totals of 2023 and 2024.
Looking at the numbers in a different picture, sales are definitely following the progress of the past two years.
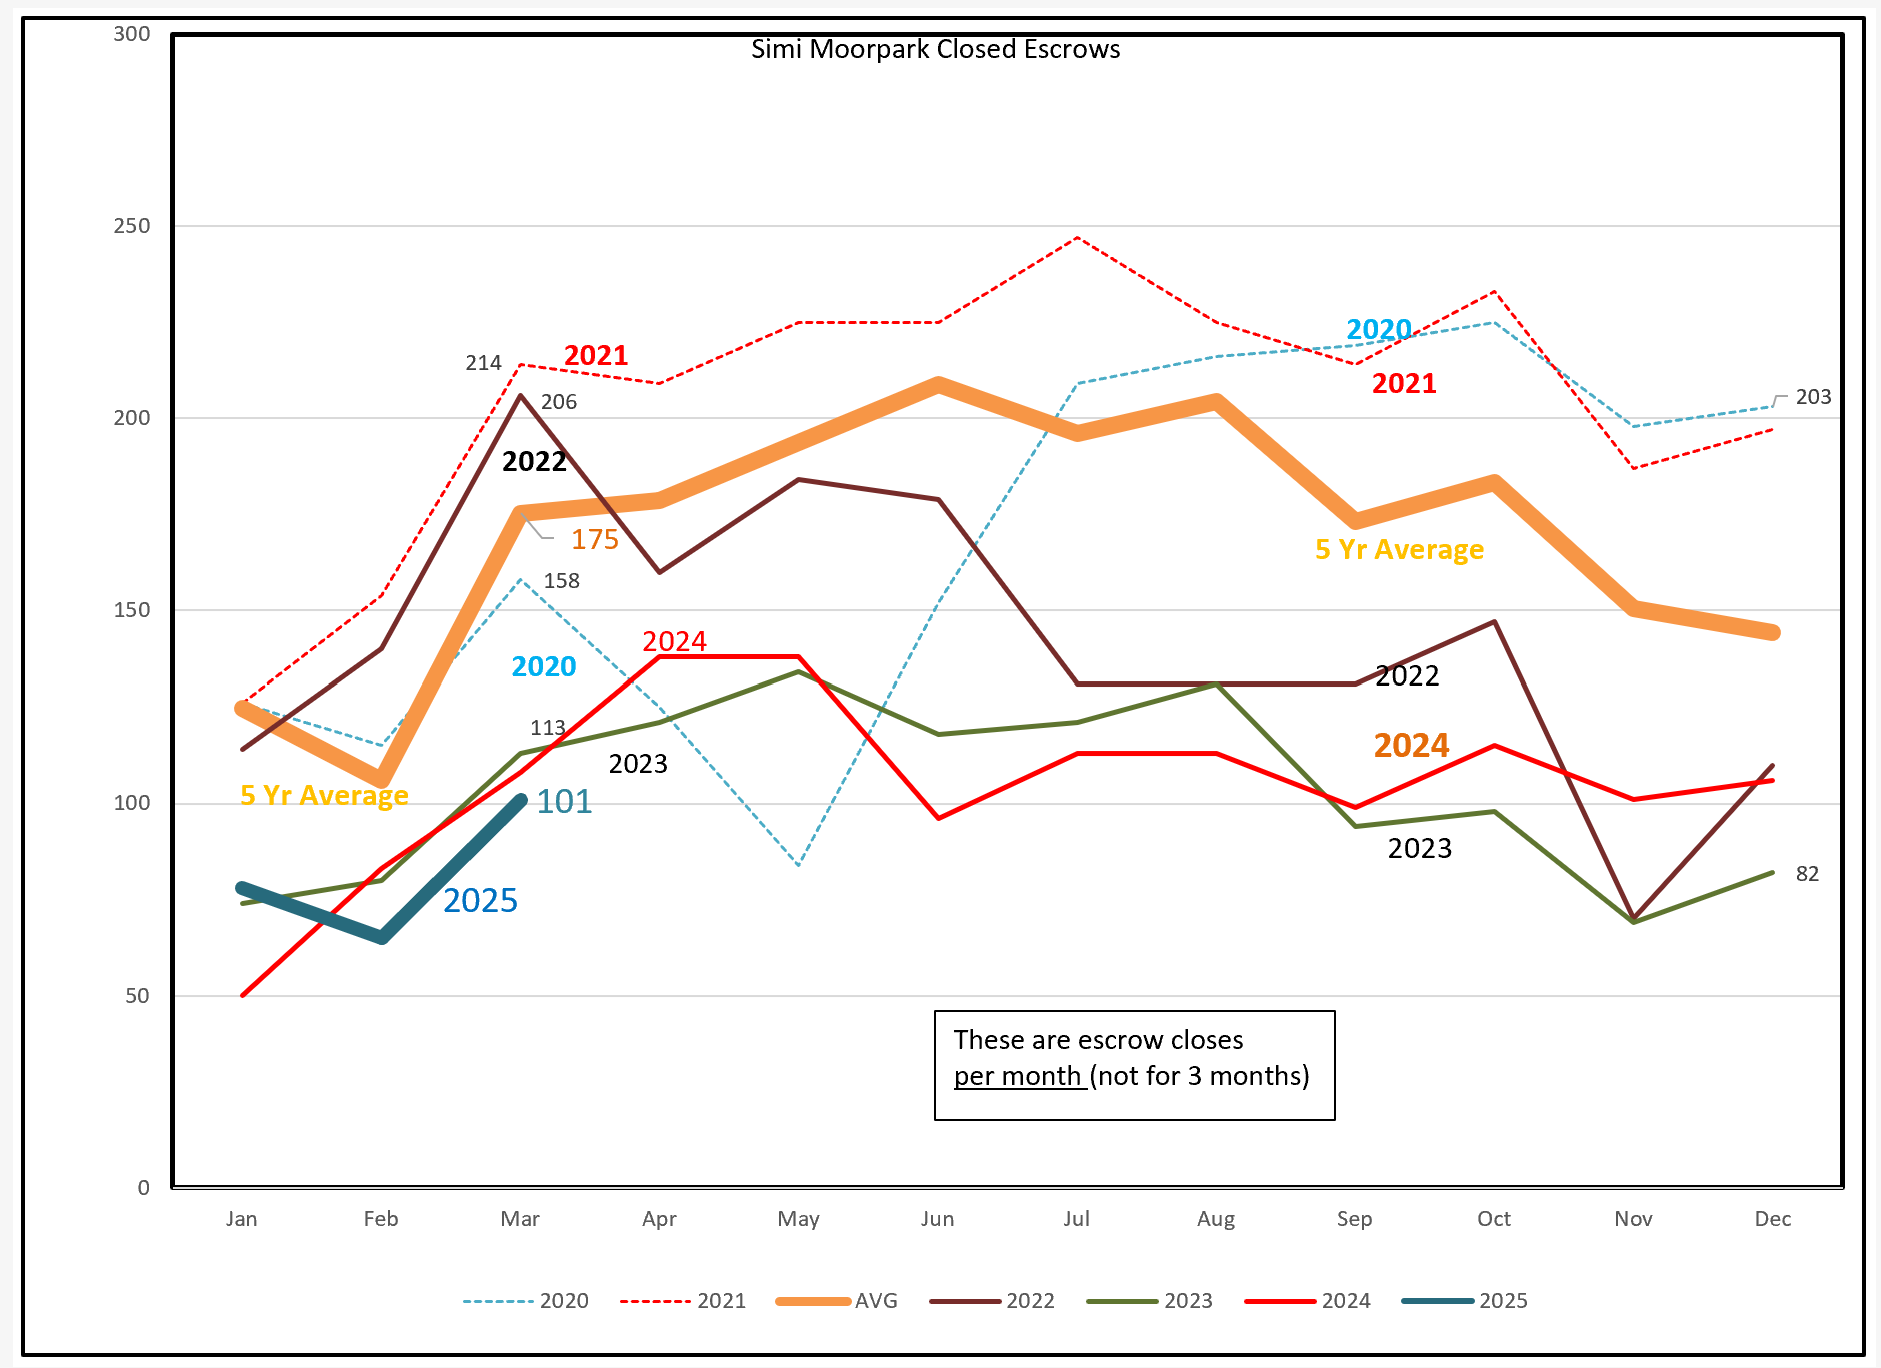
For Simi Valley and Moorpark, the same pattern at the same reduced level of sales.
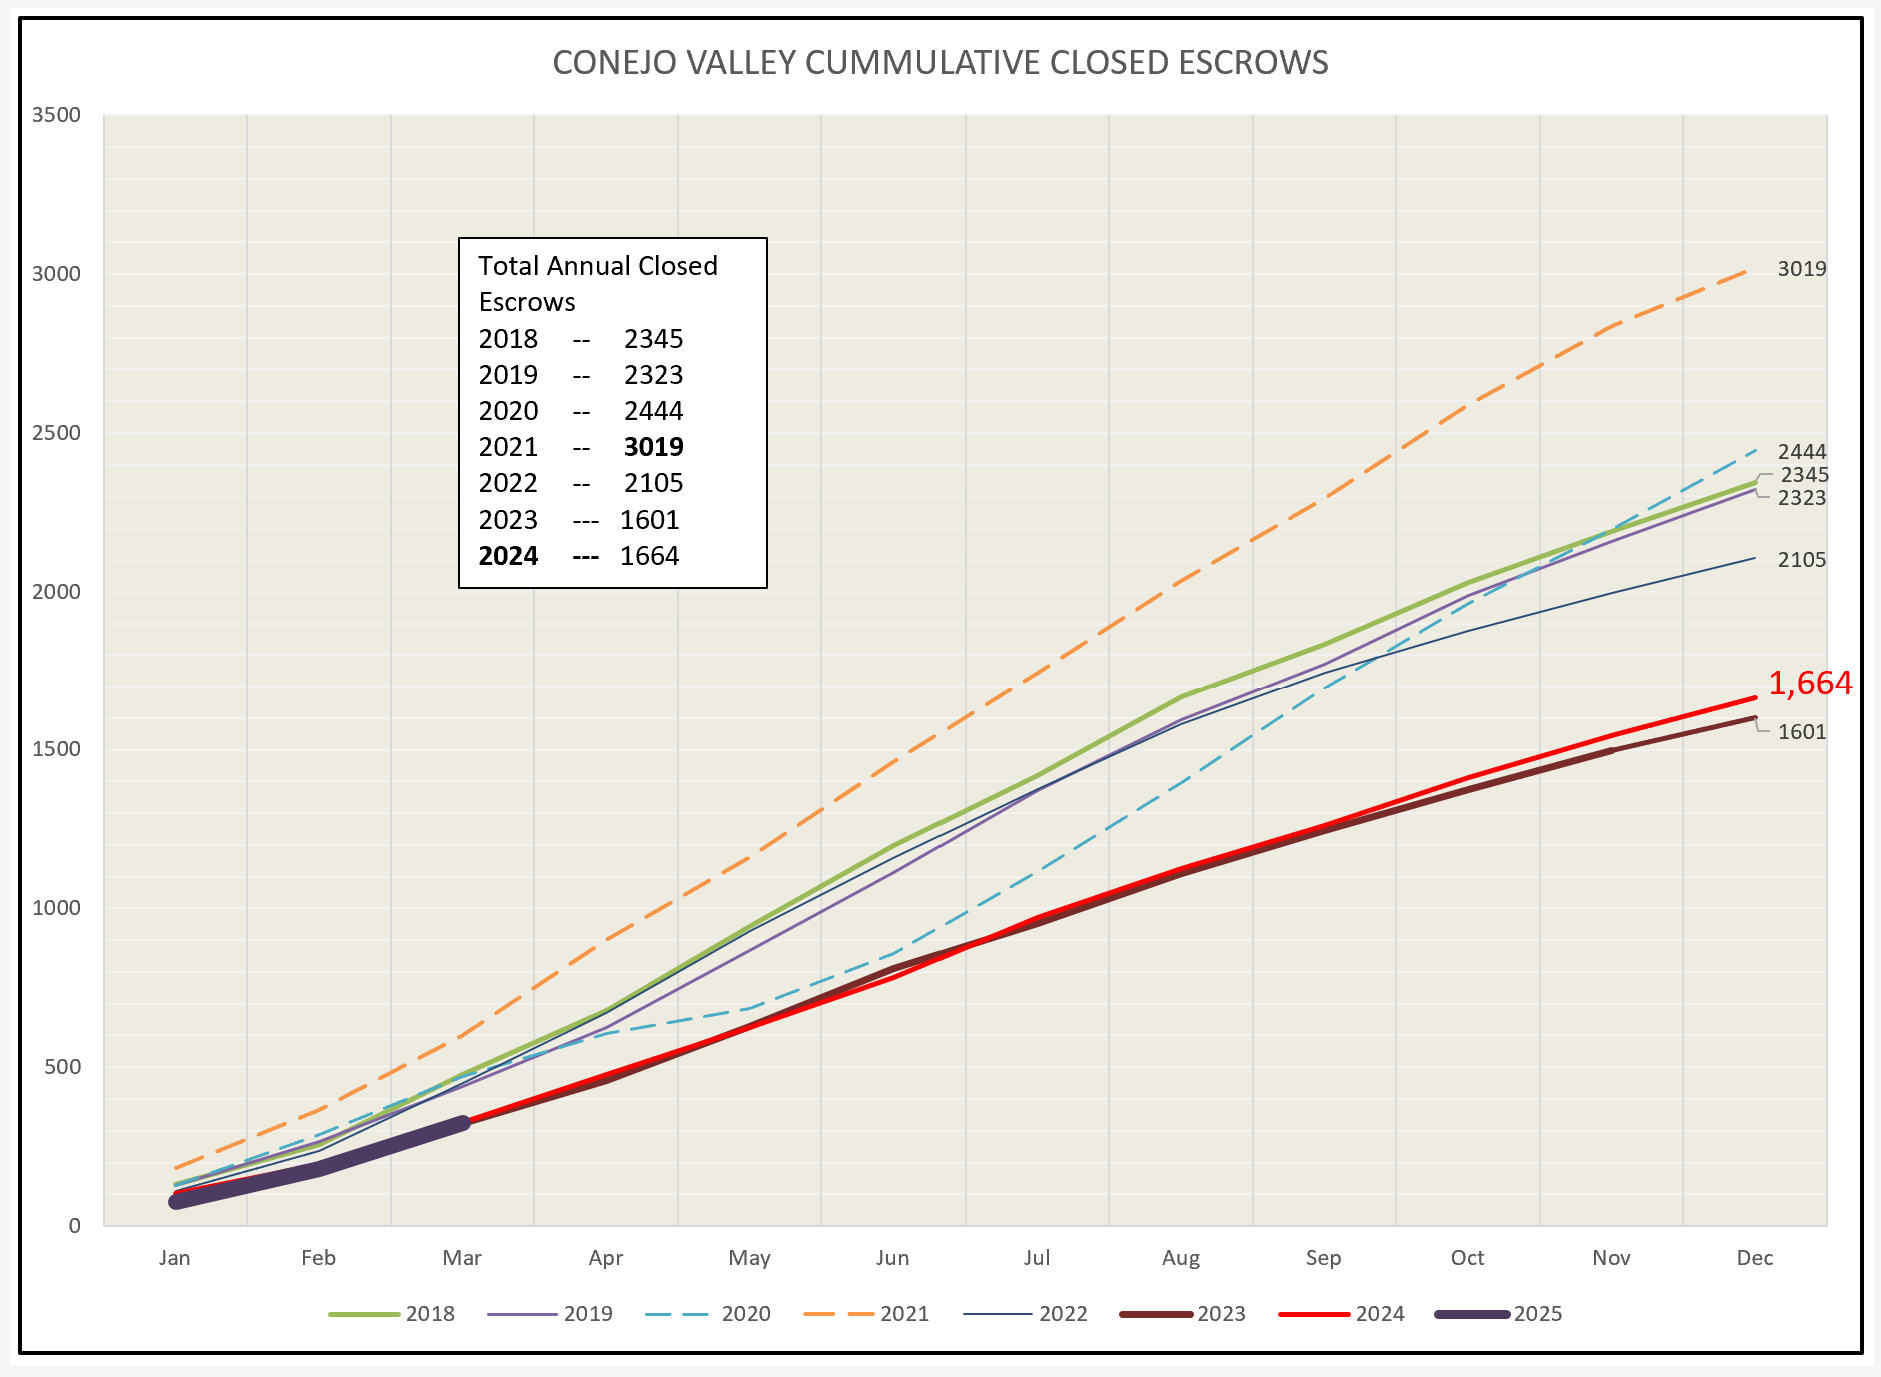
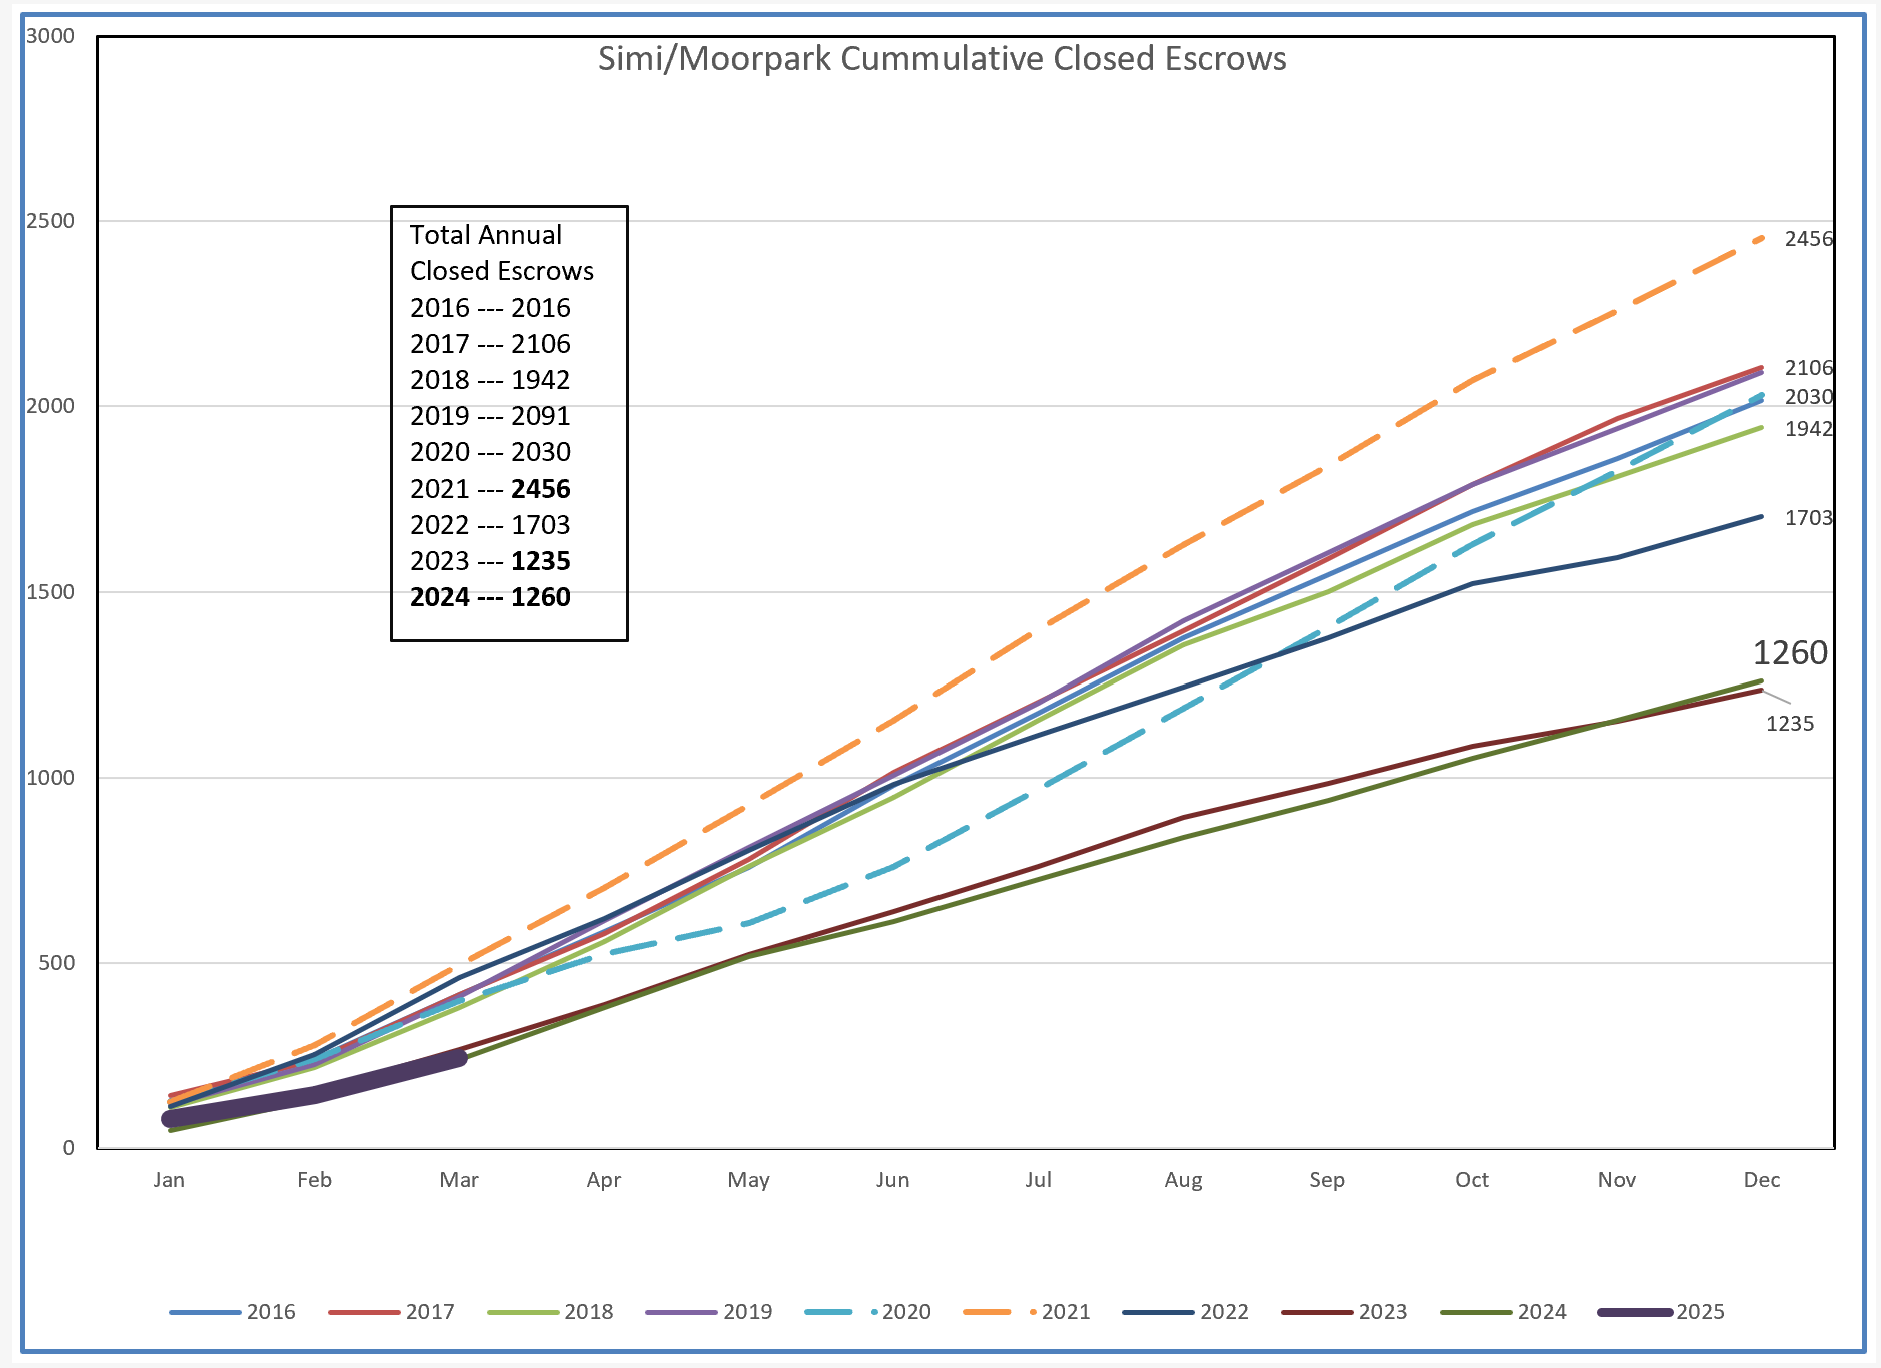
Looking at how sales totals are progressing for the years gives us a similar picture.
The saying “one picture is worth a thousand words” depends on who is viewing the picture. Not all information is processed the same way by every individual. The chart below shows the same information but in a different format. None of the pictures qualify as positive outlooks.
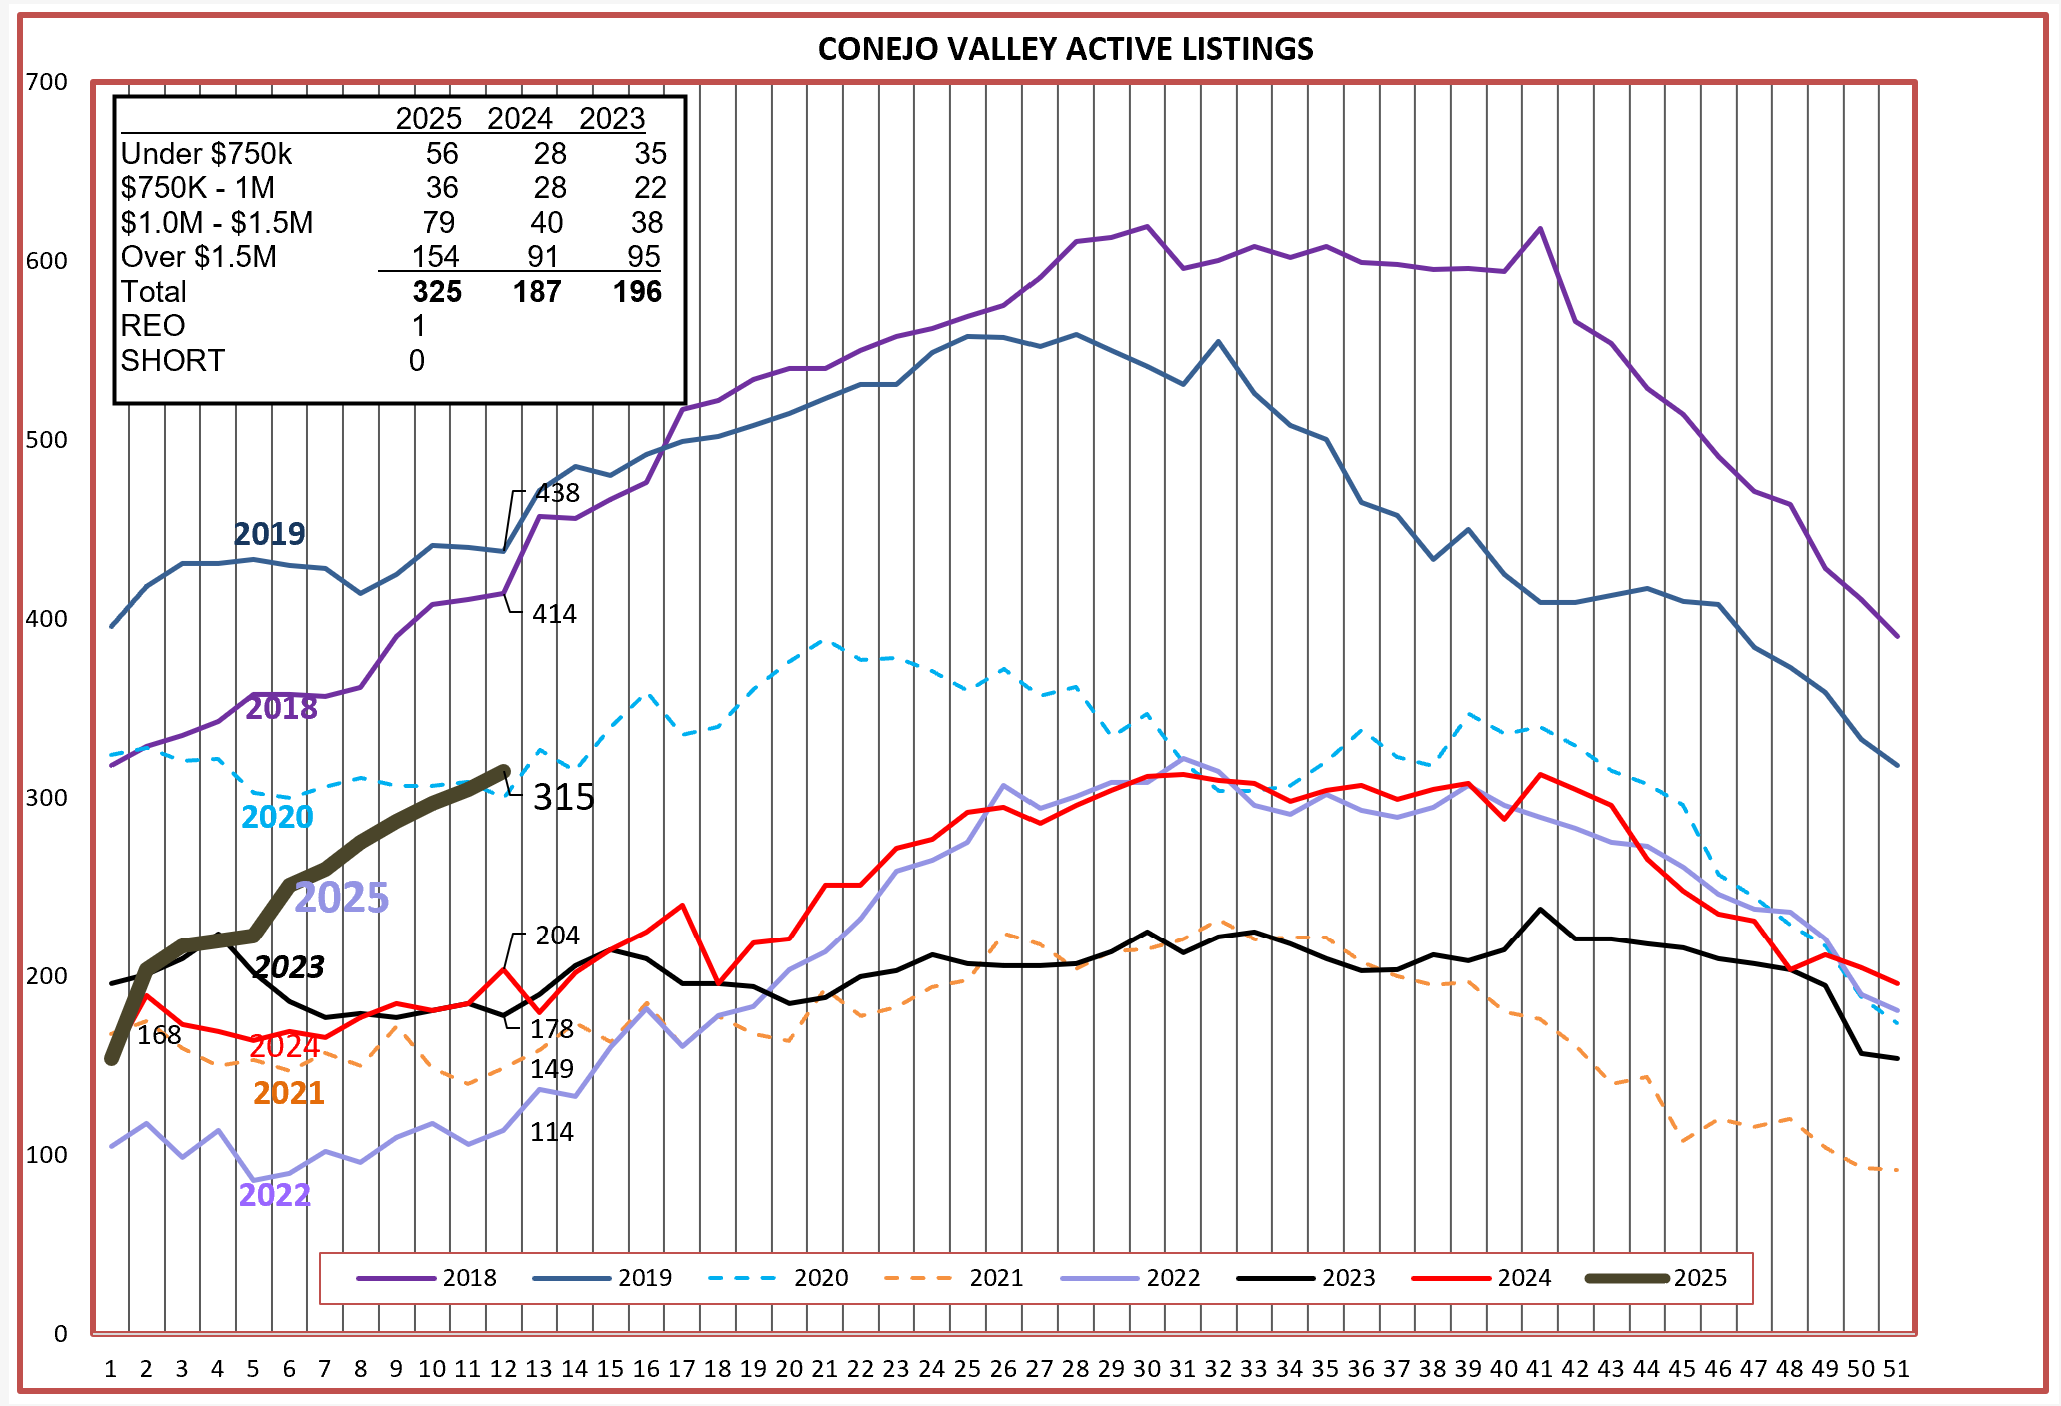
Previous discussions of why sales are low have at times centered around the lack of inventory. While that may have been true, it is no longer true. The number of active listings for the Conejo Valley has increased sharply, and the increases are similar across all price categories.
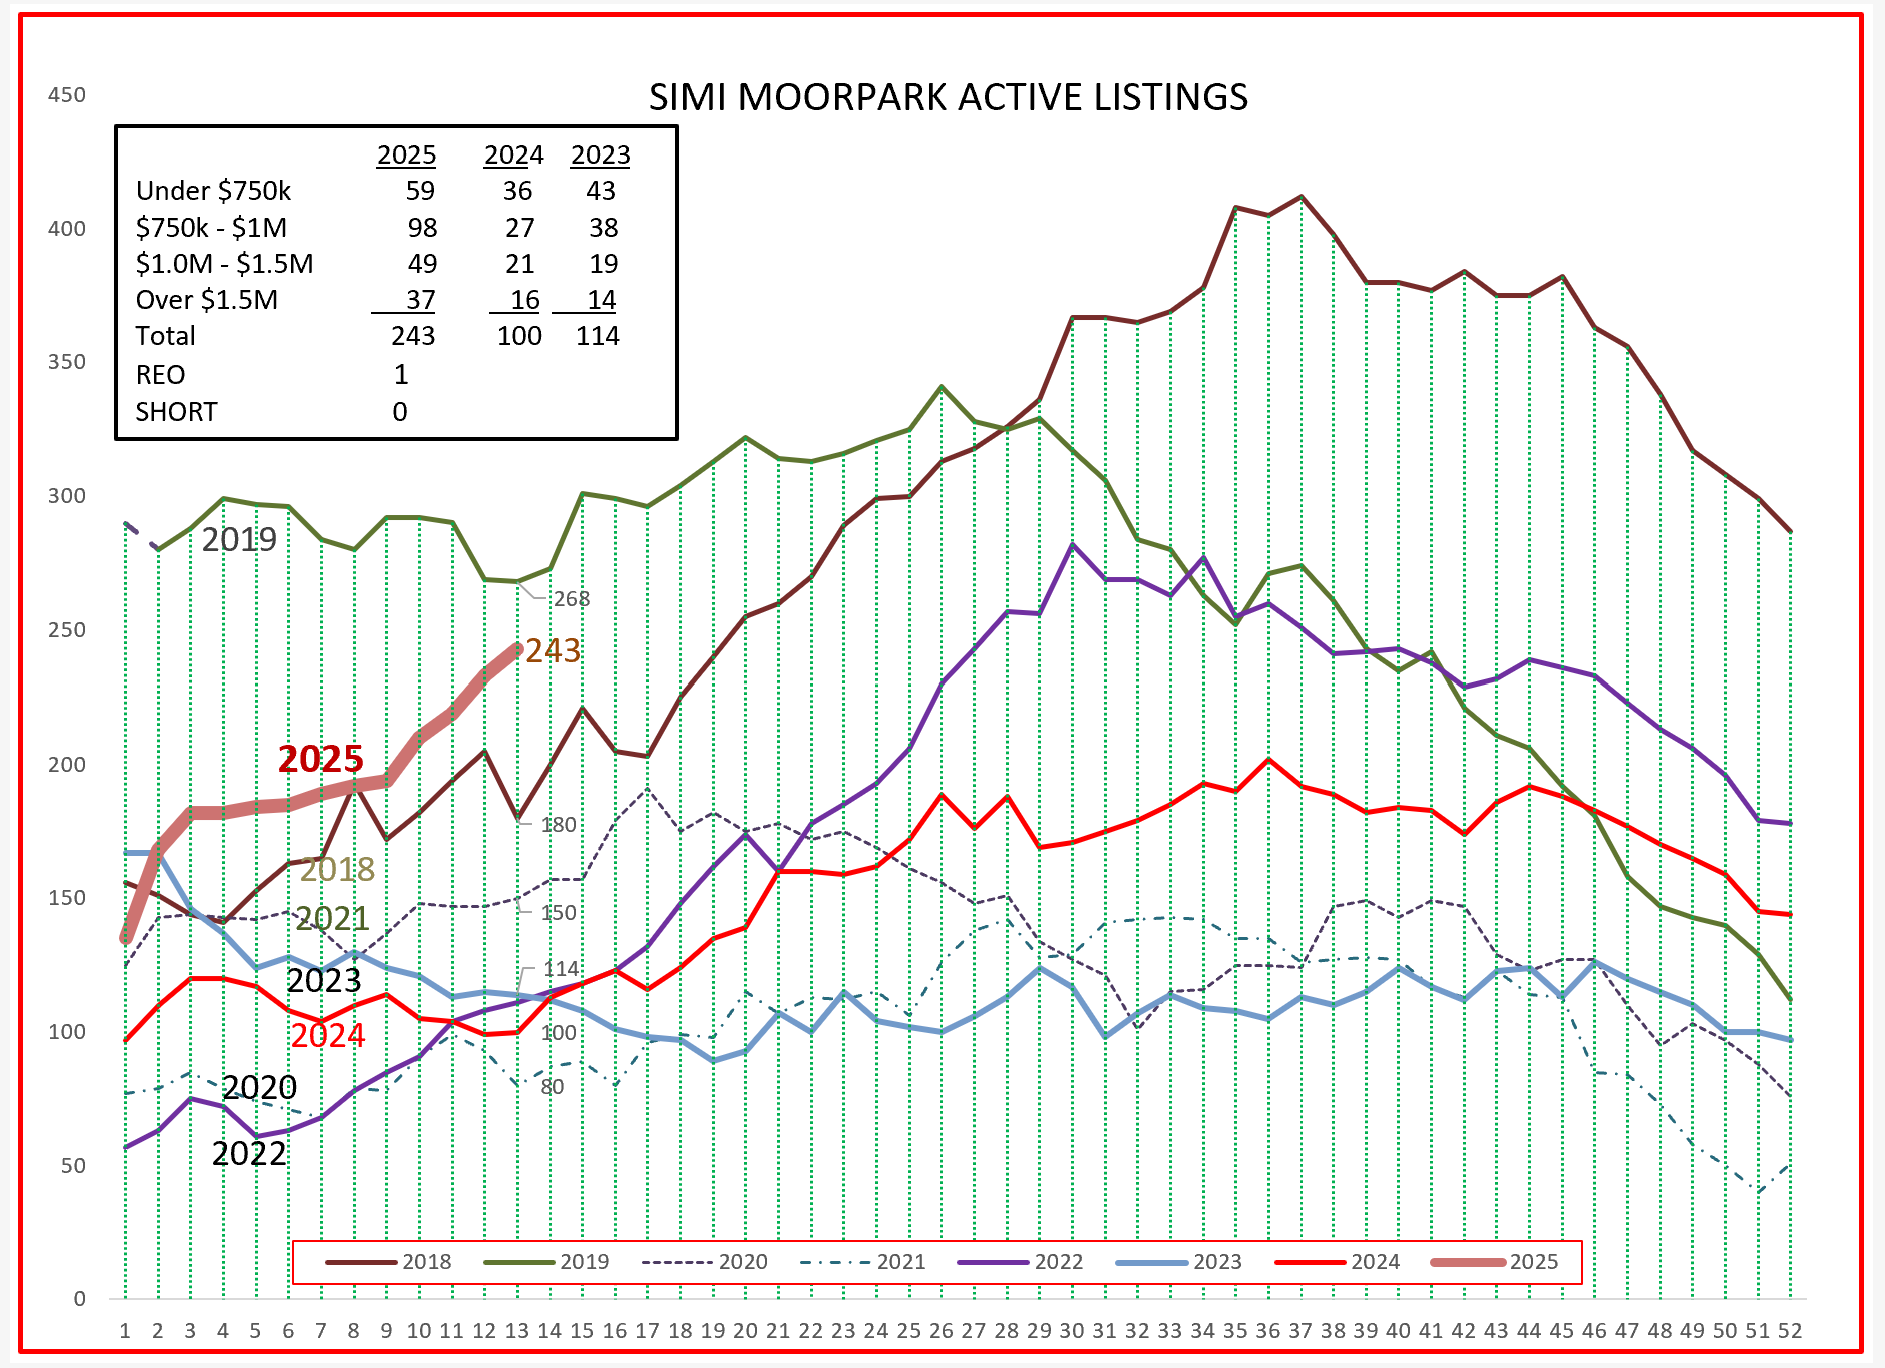
The same is true in Simi/Moorpark, who have in previous years been begging for listing to hit the market. Lots of inventory available, particularly in the $750,000 – $1 Million price category.
We have sales stagnating while inventory is rapidly climbing. What we could previously call a Sellers Market is no longer apparent. Buyers understand this much before Sellers do. Who has negotiation strength over prices and terms will soon be leaning more towards the buyers.
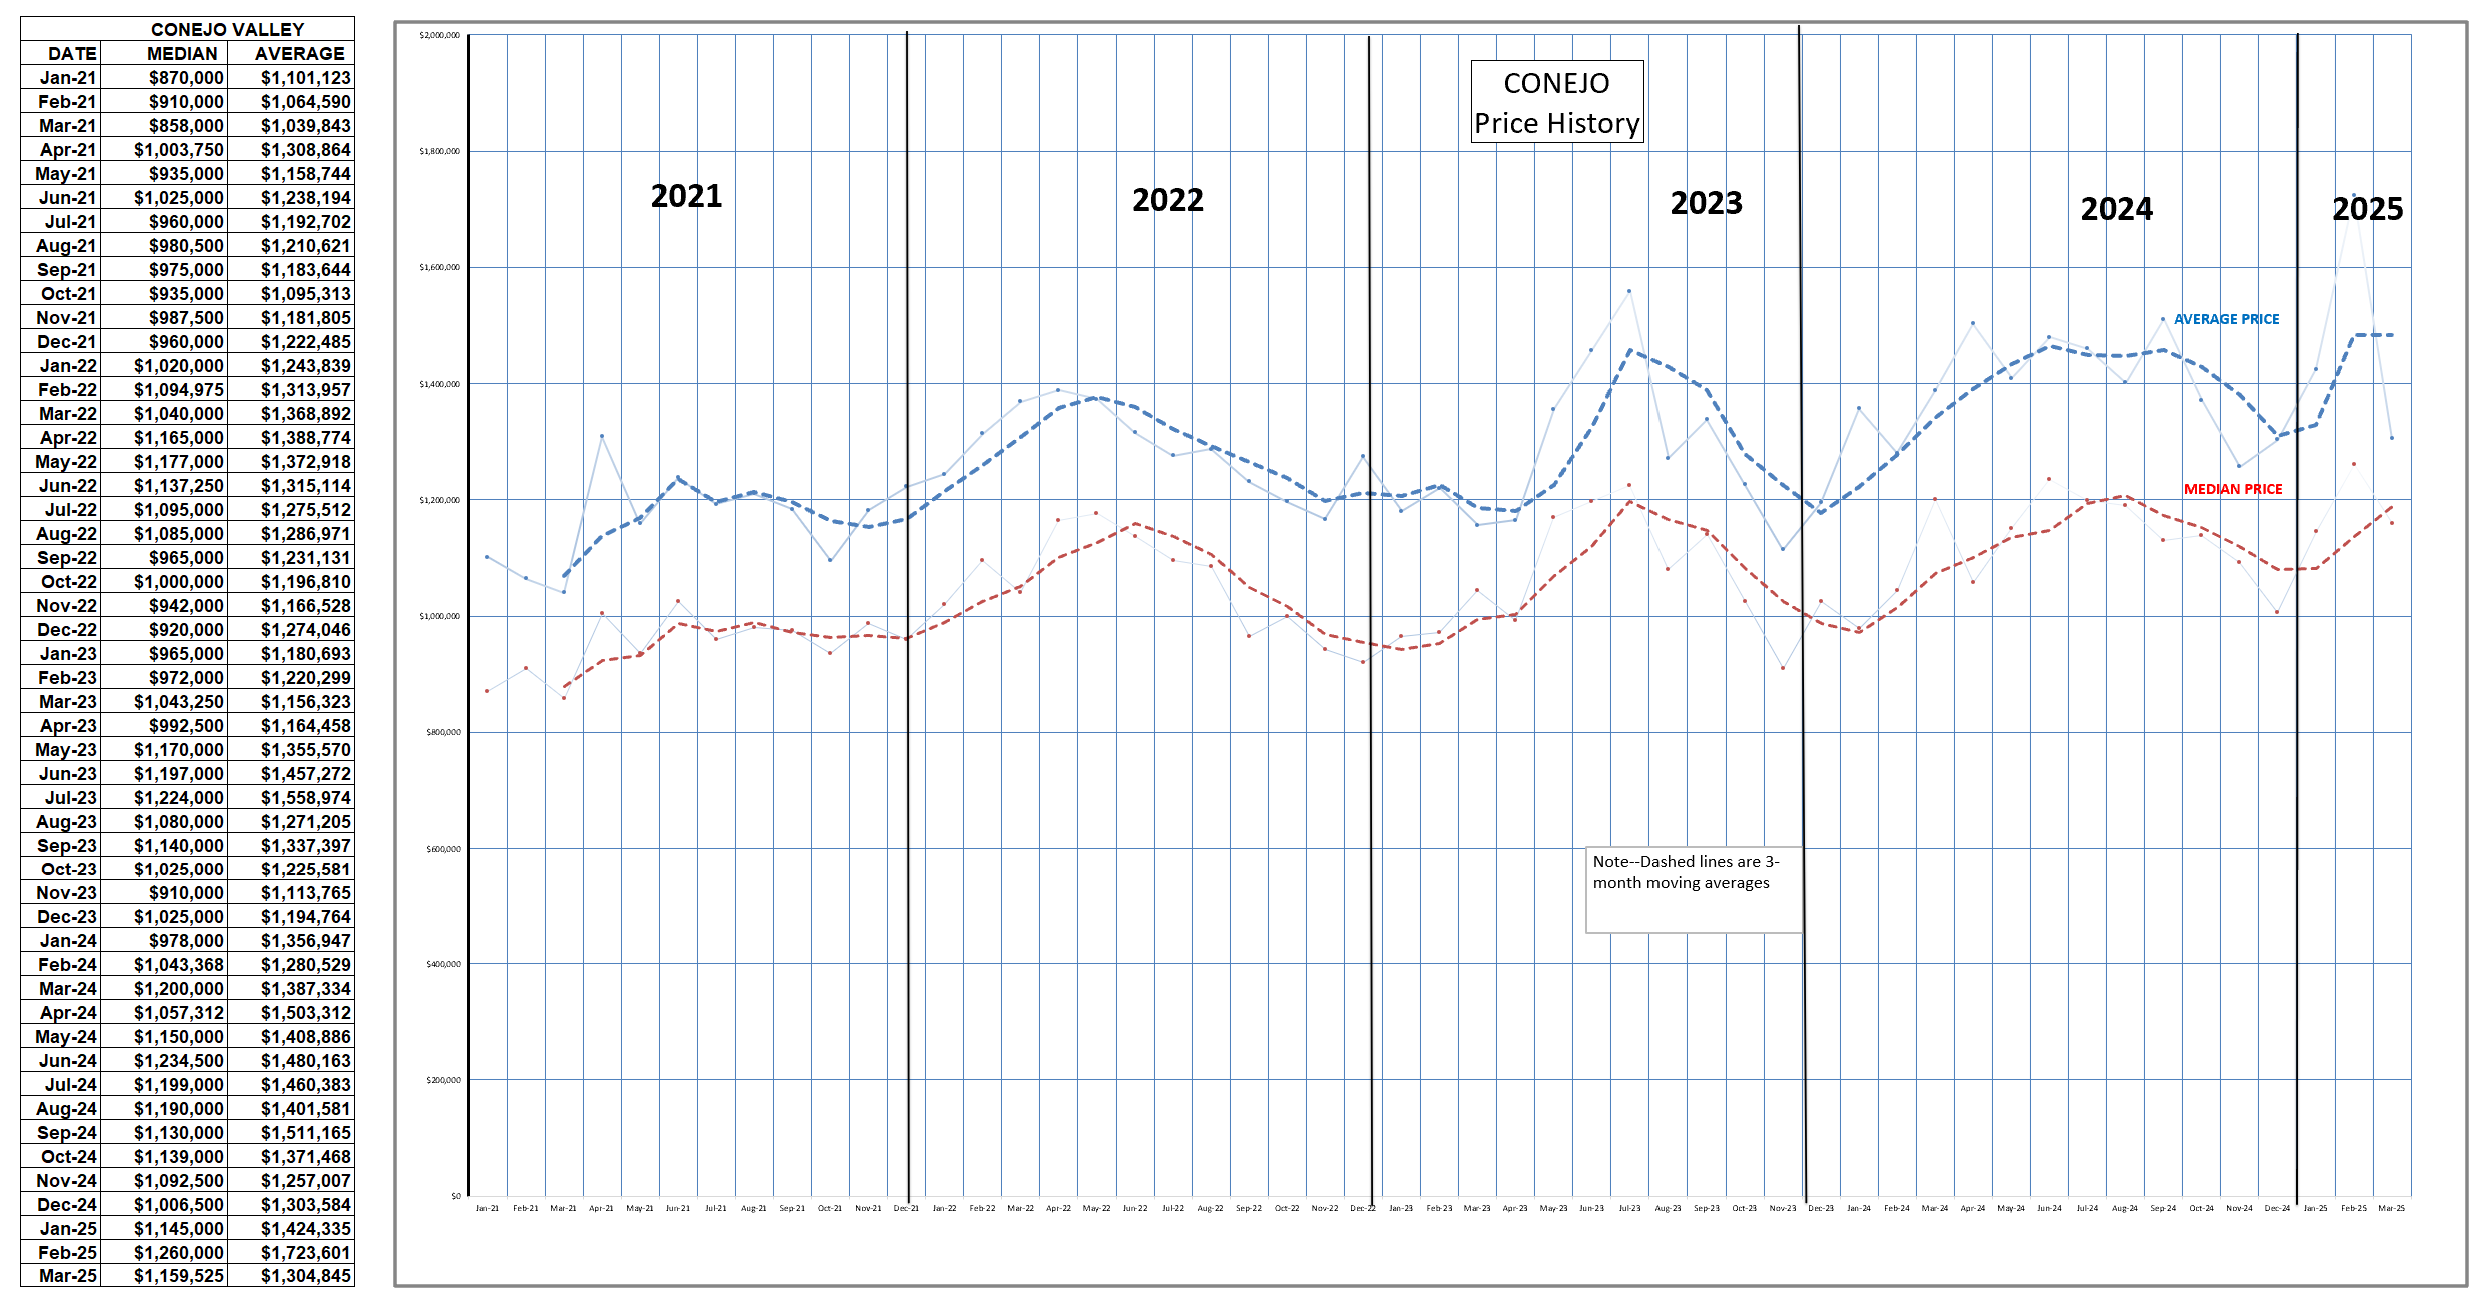
In the Conejo, prices continue to rise. But remember, this is all history, not a projection for the future. Highest priced homes continue to move the Average higher, while the Median line on the chart is more impacted by lower priced homes.
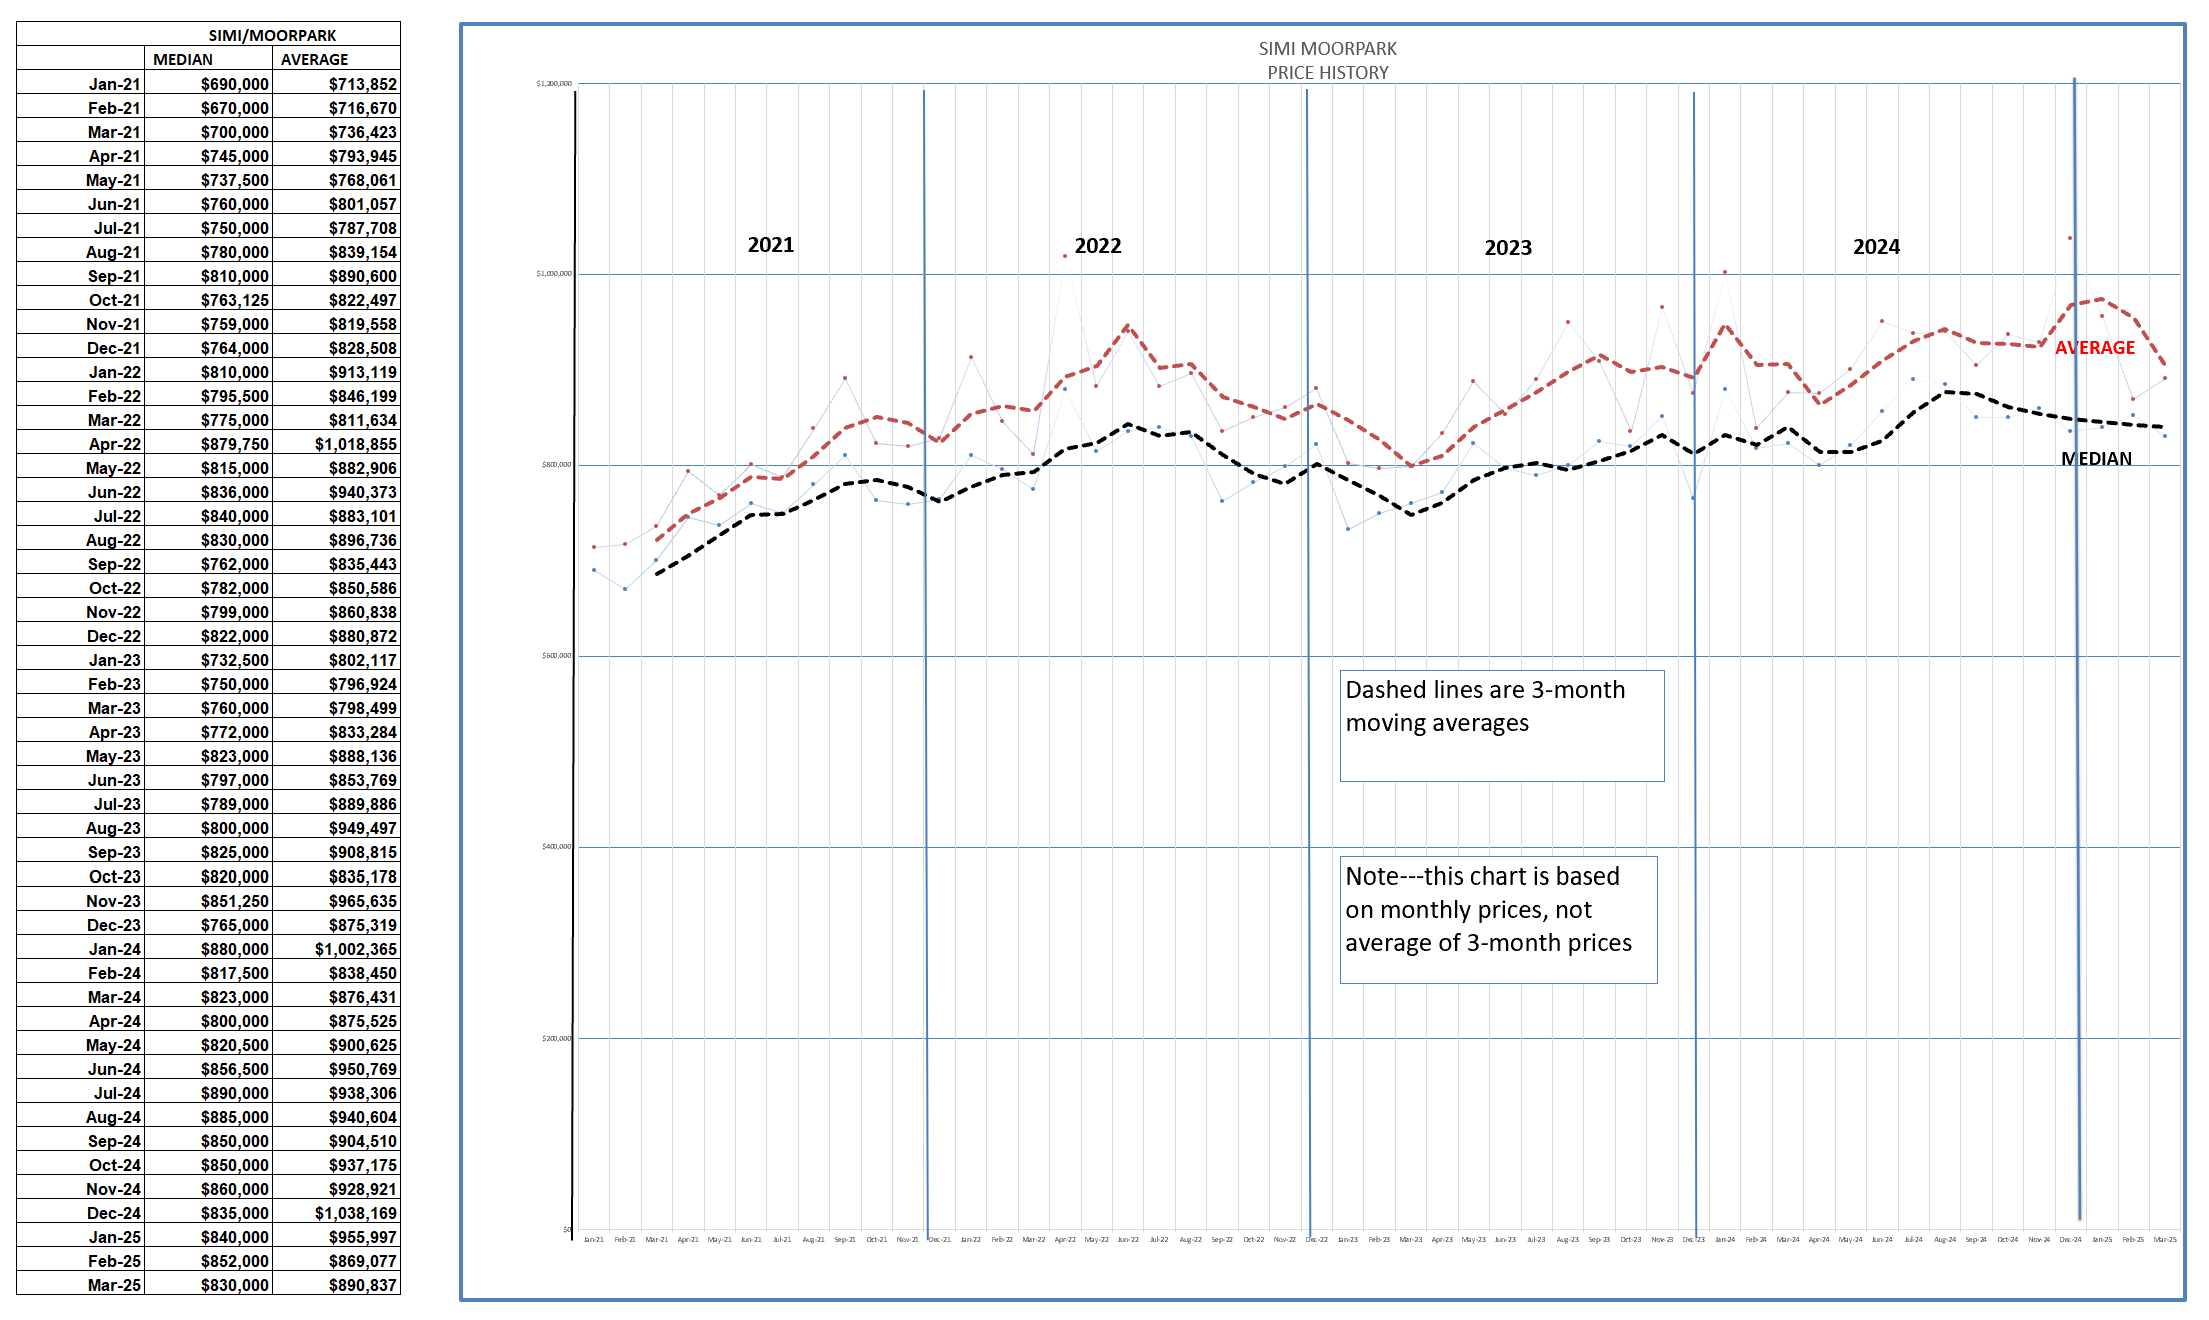
Simi/Moorpark does not have the large inventory and volume of the highest priced tranche of homes, so their chart is a little different. Both Average and Median lines are dipping lower.
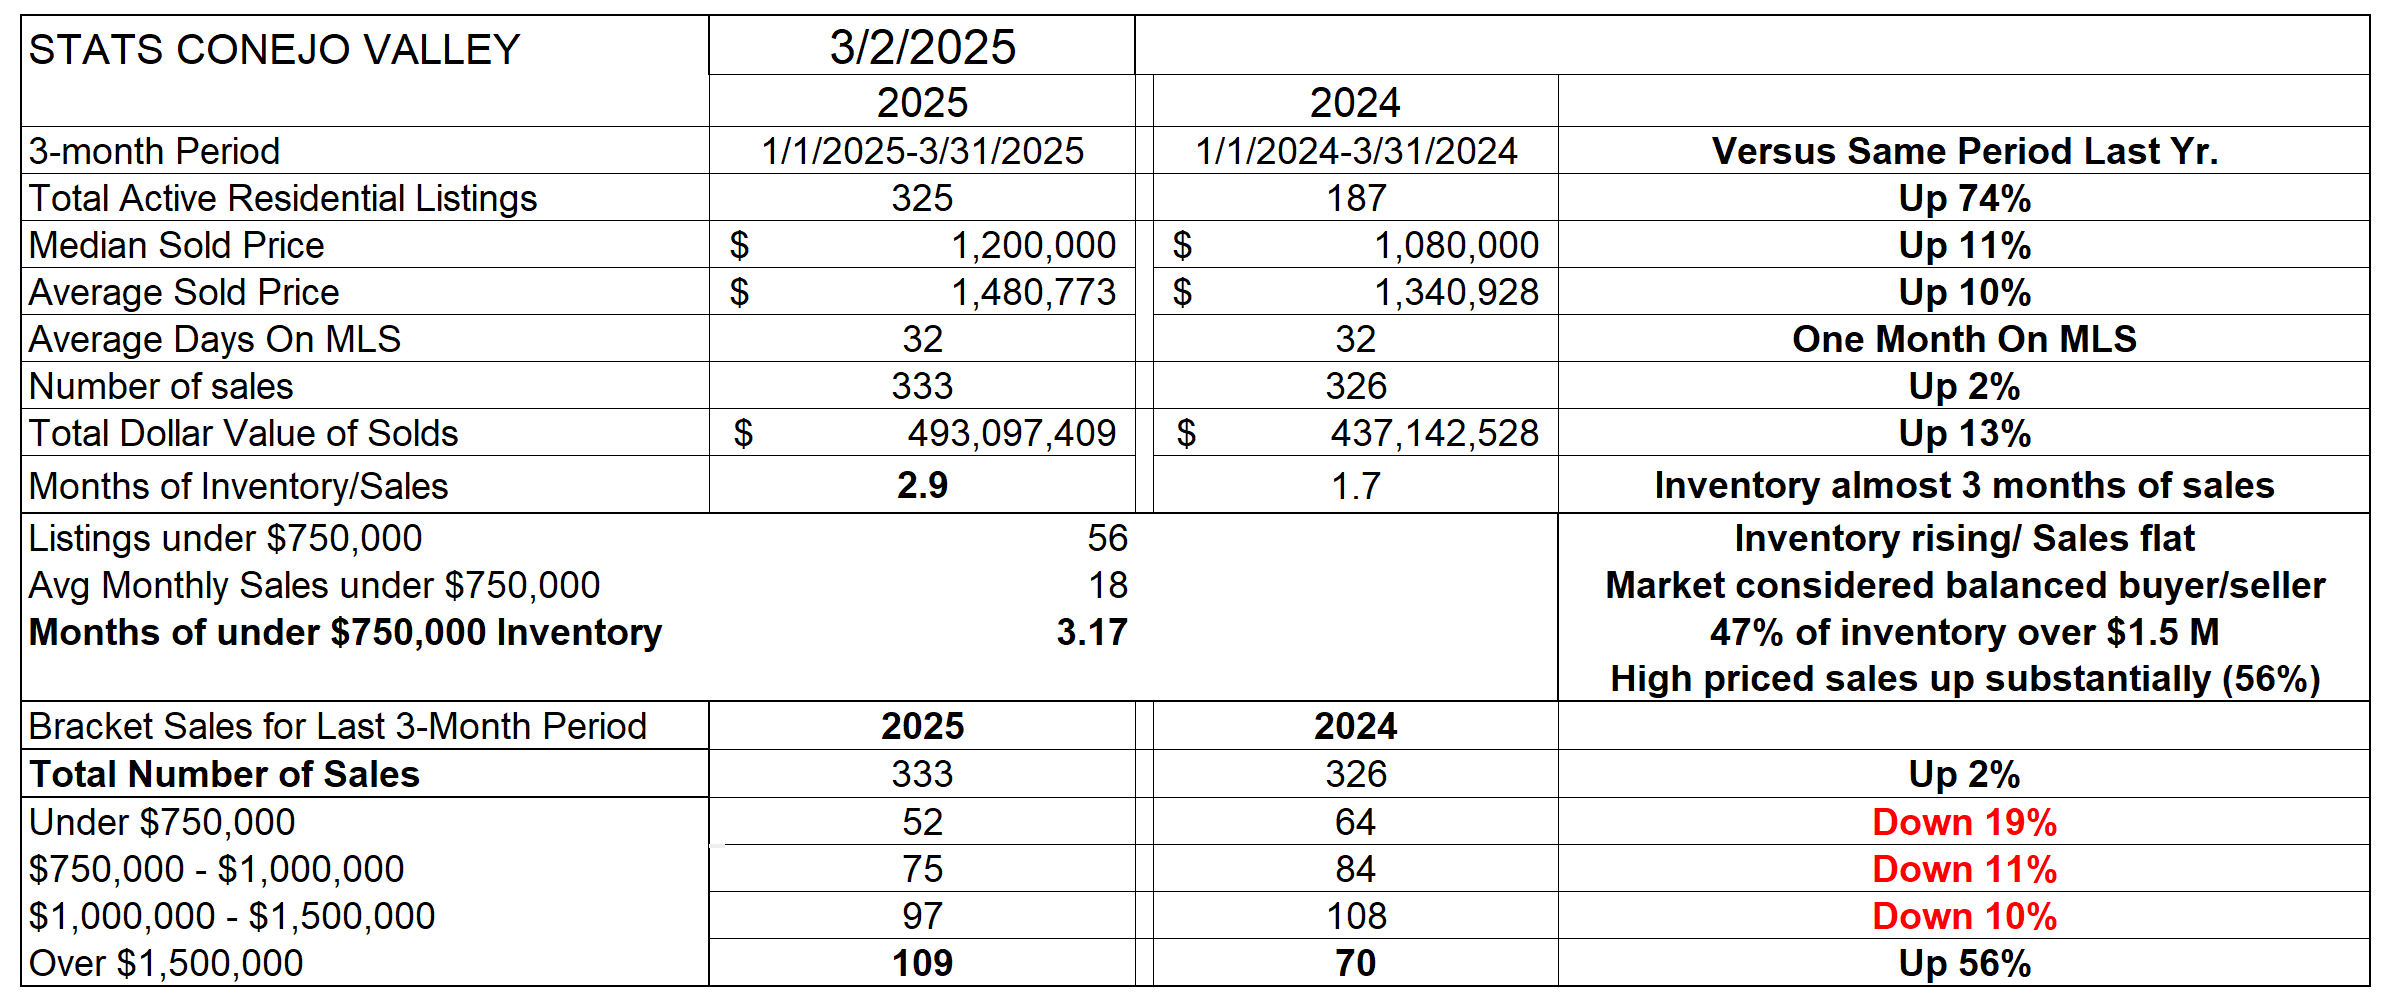
If you read my blog, you have been used to seeing the tables that describe these various components. Most of these numbers cover a period of three months to “smooth out the anomalies”. For the Conejo, Inventory is up 74% while the number of sales is up only 2%. While recorded prices were up 10-11% year over year, both Median and Average numbers have been strongly affected by high numbers of high priced homes. The ratio of listings to sales, which I term months of inventory, is hitting 3 months, a reading almost everyone calls a balanced market for both buyers and sellers. Look at the bottom half of this table. Sales for the three month period compared to last year were significantly down for every price category except the highest, homes over $1.5 million, up a whopping 56%. That is the only strong area of sales activity. Almost half of the active inventory is in the same category, over-$1.5 million.
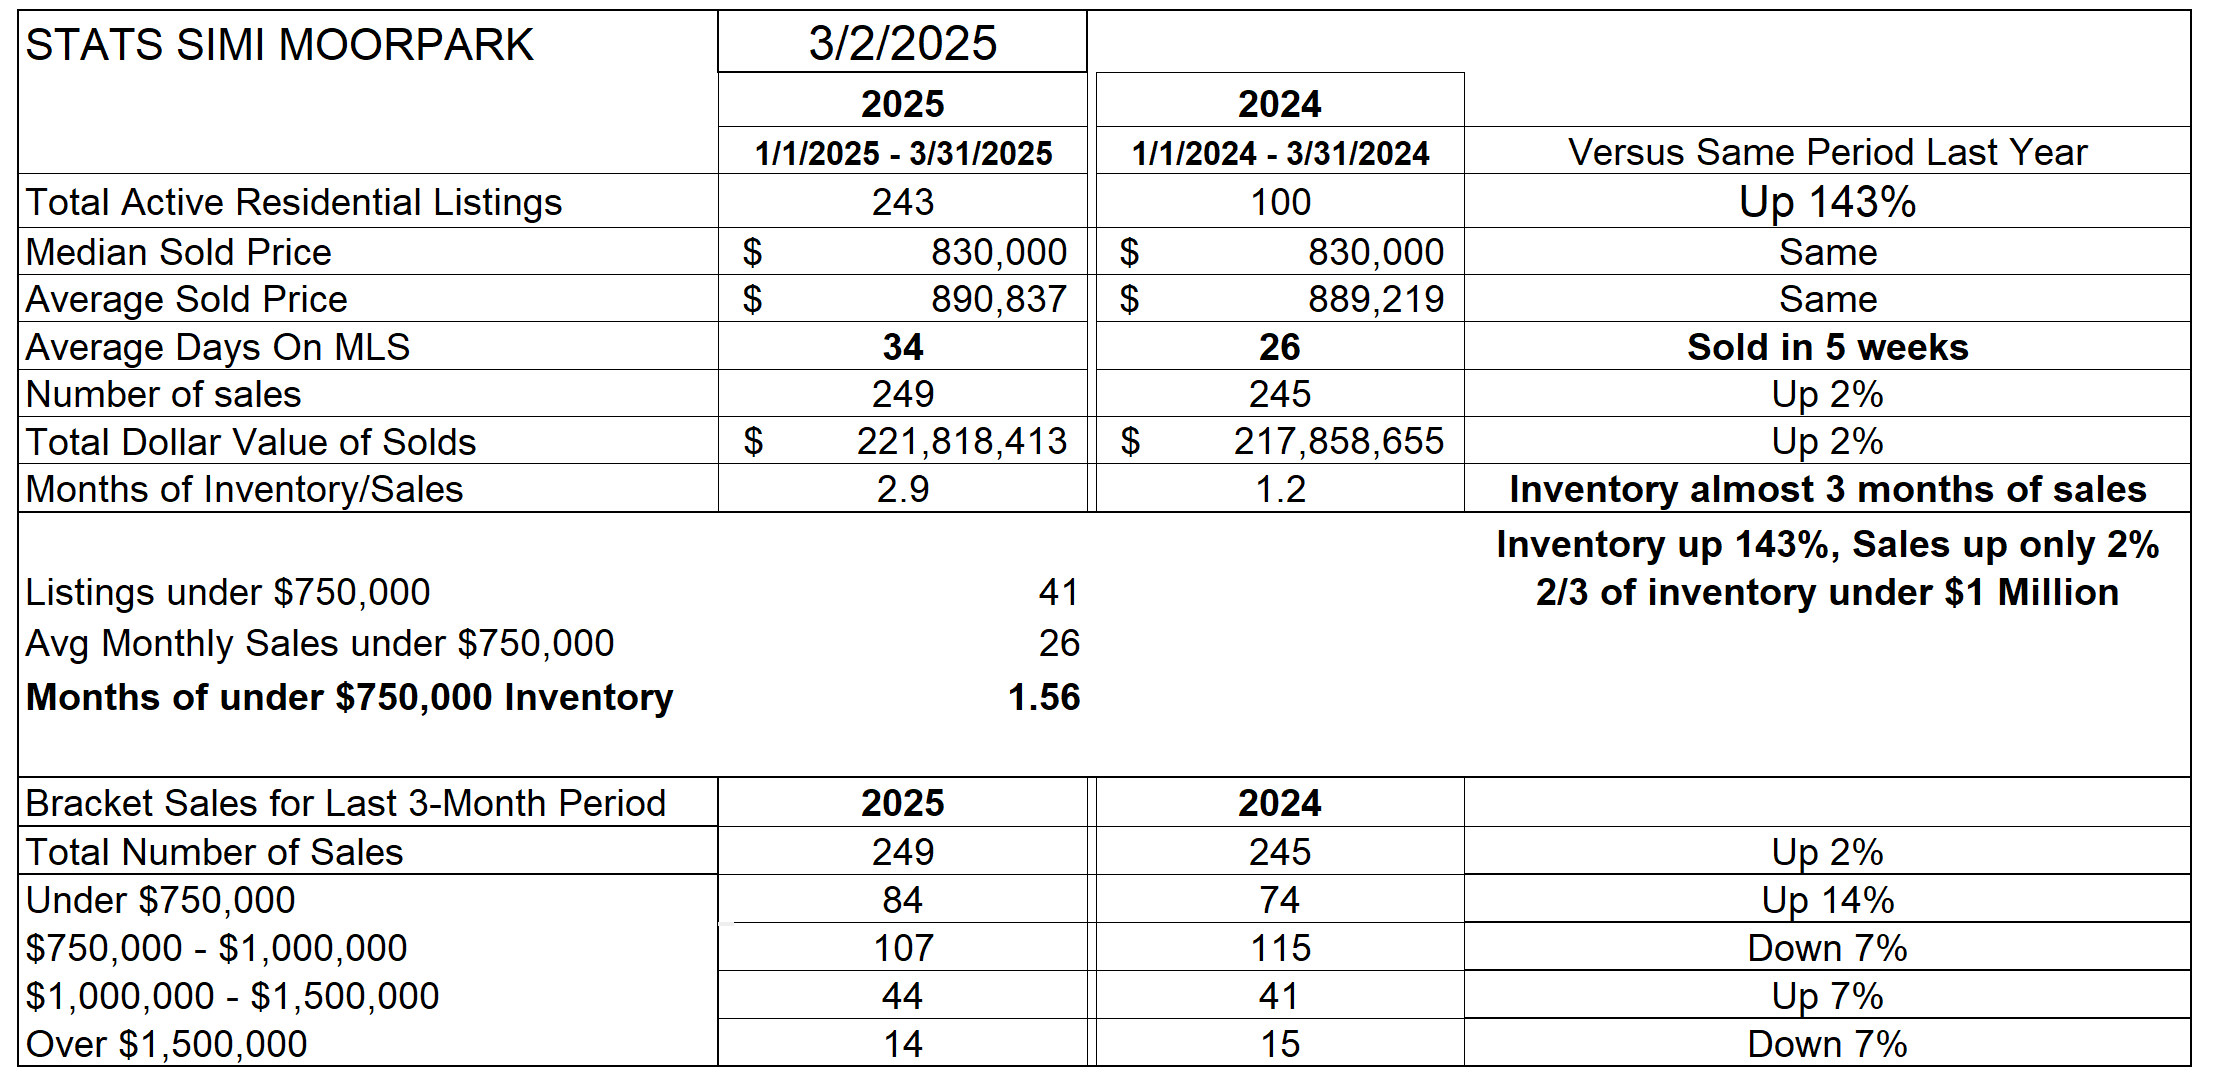
For Simi/Moorpark, a different picture. Listings are up a substantial 143% compared to last year, but the number of sales is up only 2% . The ratio of listings to sales, which I term months of inventory, is hitting 3 months. Almost 2/3 of the active inventory is below $1 million, Simi/Moorpark is more affordable for more people. Prices are the same as last year.
The housing market counts on a stable outlook for the future. It counts on stability in employment. Note that people with jobs and W-2s are considered better mortgage risks than people with 1099s. We are in for a bumpy ride, and the bumps have already begun.
I hate to leave on a negative note, so I will end with this. People still need a place to live. Hard work will continue to pay dividends. Knowledge is the most important element people need to get through these times, and you are their best source of knowledge. Keep working hard to become the trusted advisor that homeowners and buyers need when navigating rough waters. When change happens, people go to their professional to understand what is happening in the market.
Stay well. And I really appreciate those of you who tell me what you think. Please share those thoughts.
Sincerely,
Chuck
