The FED had two ways to provide monetary stimulus to the housing market. One was to keep interest rates near zero. The other was to purchase mortgage-backed securities and keep them in their portfolio. The FED has now reversed course in both areas. This week’s half point rise in interest rates was an indicator of more to come.
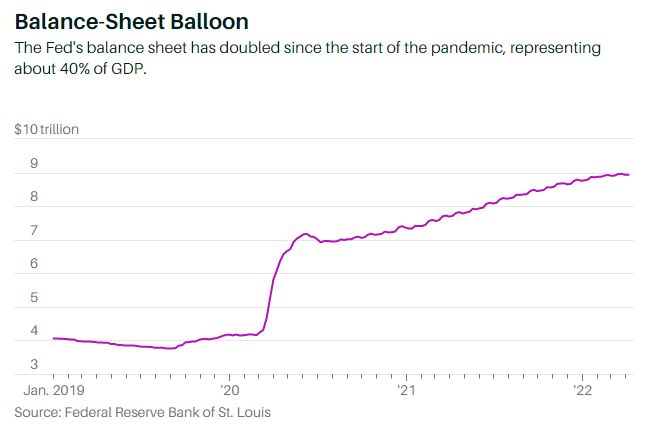
Mortgage interest rates are more closely related to the 10-year bond. With that bond currently exceeding 3%, mortgage rates are settling in two points higher, as usual, at more than 5%. In one year we have seen mortgage rates jump from 3% to 5%. They will continue to rise for a period of time. Below is how the FED balance sheet has grown during the pandemic, because they were strongly supporting keeping mortgage rates low, both buying treasuries and mortgage backed securities.
These purchases reduced interest rates for mortgages. The FED will now be dropping both treasuries and MBS from their inventory as each mature, and will not purchase new bonds. New mortgage backed securities will have to provide higher rates of return to be competitive, and mortgage interest rates will increase.
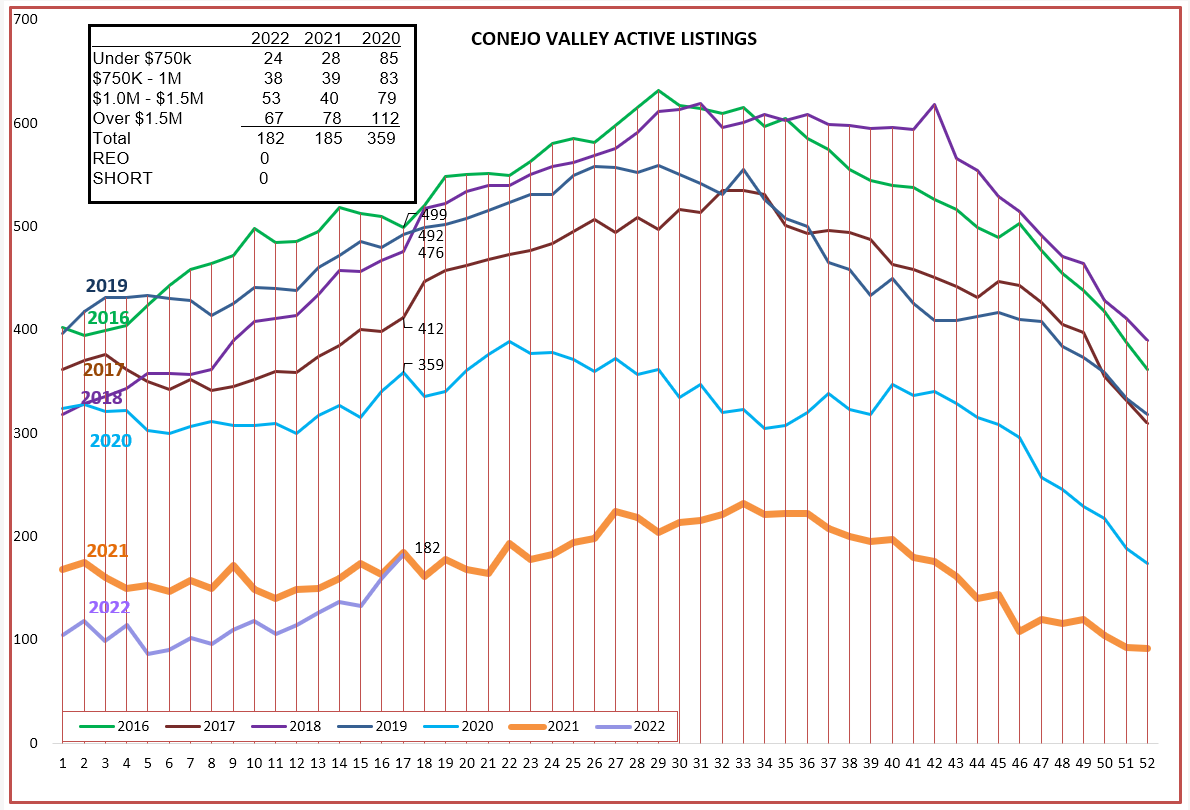
Has the hot housing market noticed what is going on in the mortgage realm? Not yet. But remember, closed sales happen 45 days after contracts are agreed to, so there is always a lag. We don’t know what price a home sold for until it closes. If inventory goes up, that helps foretell the future. Let’s see how inventory is reacting. Below, Conejo inventory is heading up, Although lower than 2021 for the first 2-3 months, it is now equal to 2021 and I estimate the uptick will continue.
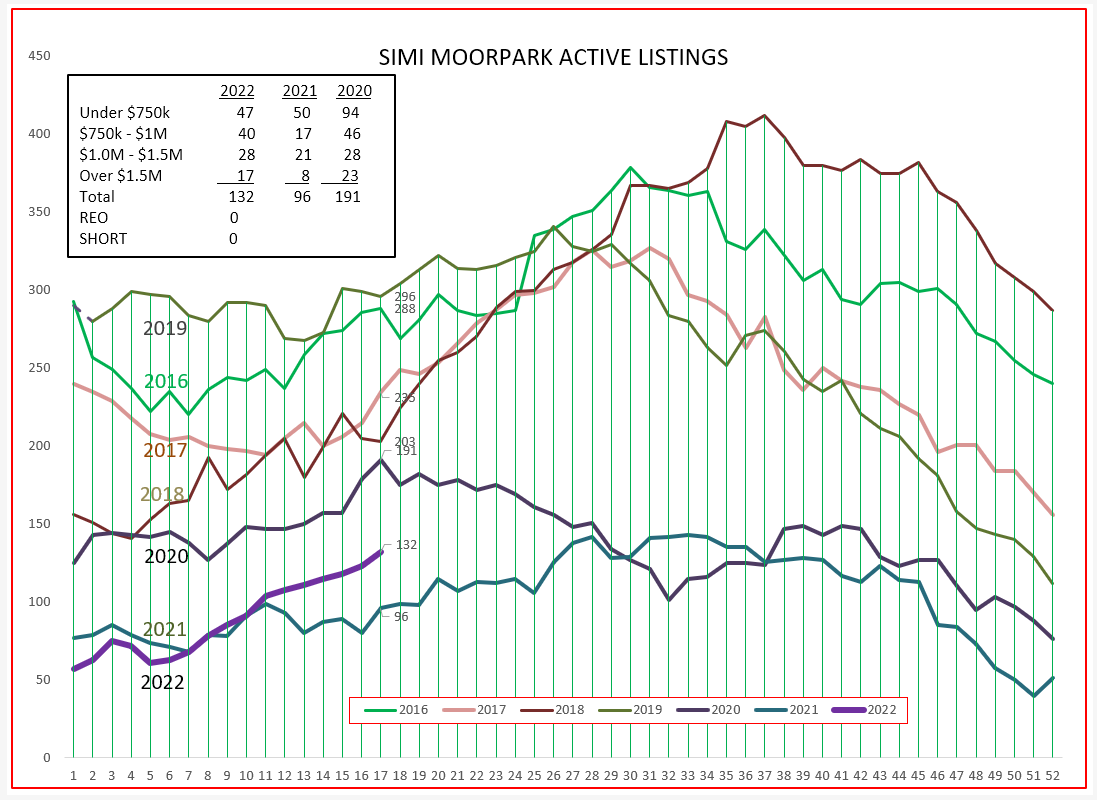
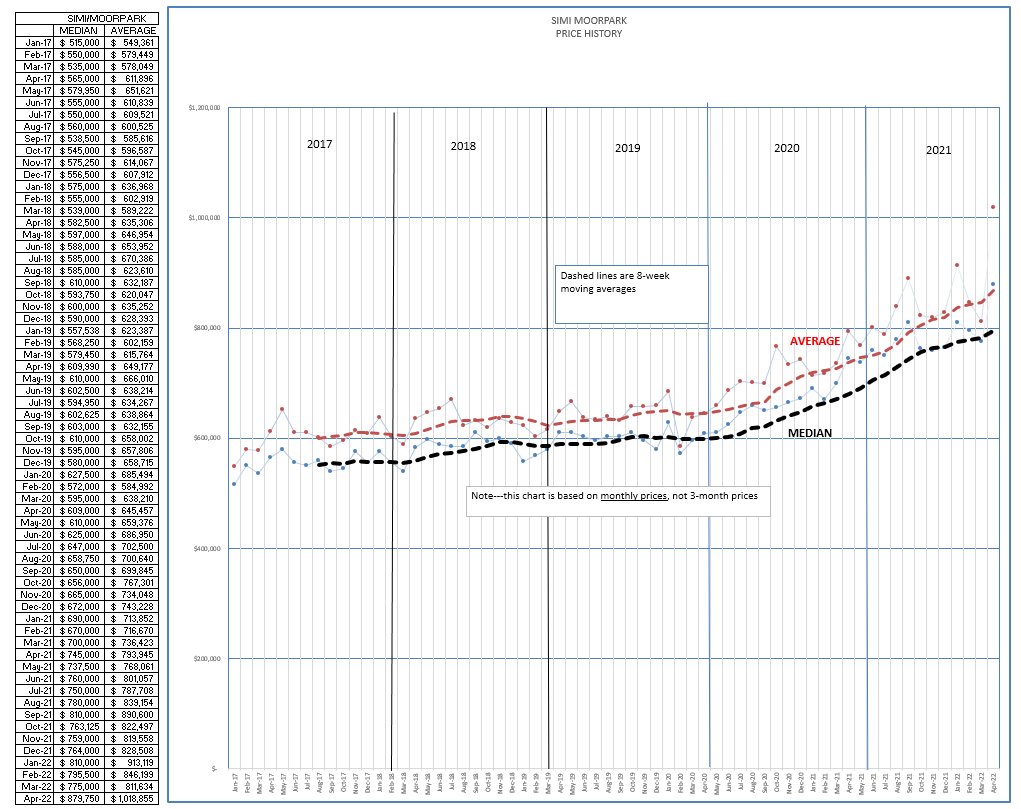
Simi Valley/Moorpark inventory has been extremely low for almost two years, but is now breaking out and rising quickly. This inventory growth will pressure price increases to moderate. Mortgage rate increases mean higher monthly payments, thereby reducing the number of buyers who can qualify for higher priced homes. Over the past two years, Supply and Demand has worked to increase prices significantly. It will now work to moderate prices significantly. How have prices been doing? Remember, these prices are based on contracts entered into 45-60 days ago, and were probably done with mortgage rates locked in at lower rates than those available today.
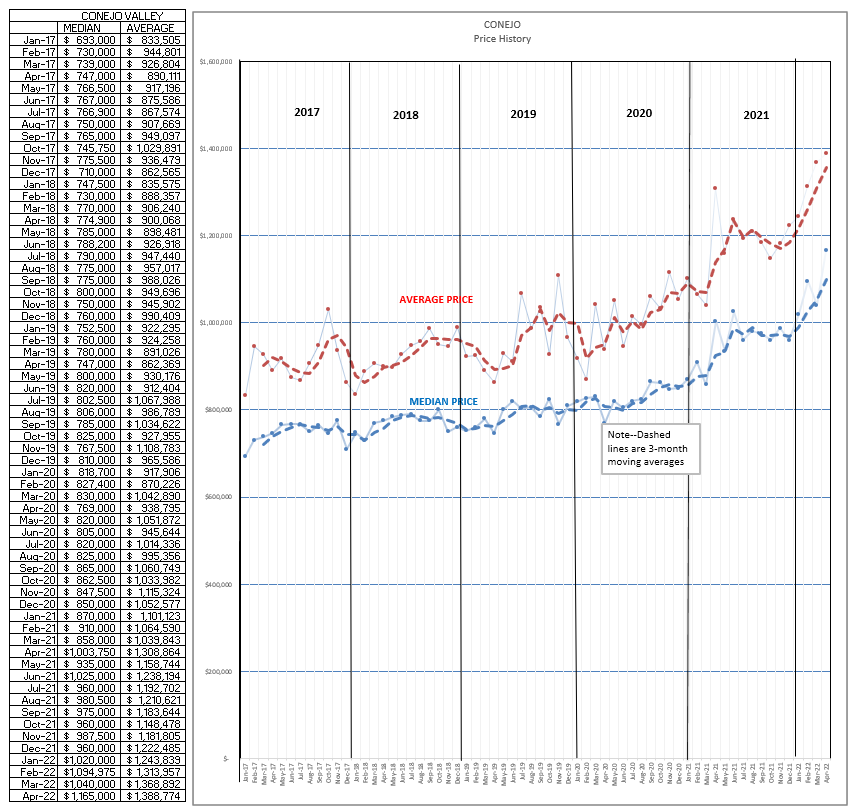
Conejo prices have been following a rocket-like trajectory. More inventory, meaning more sellers and more competition for available buyers, will moderate prices. And buyers, under pressure due to higher mortgage costs, will tighten their bidding belts. However, the median price in April 2022 vs April 2020 experienced and increase of 45% over that two-year period. It has been a great period for homeowners’ main investment.
Simi Valley/Moorpark has experienced similar rocket-like increases in prices. April 2020 versus April 2022 measures an increase in prices of 45% over the two year span. People today are complaining about inflation, but homeowners have been very pleased with their home investment.
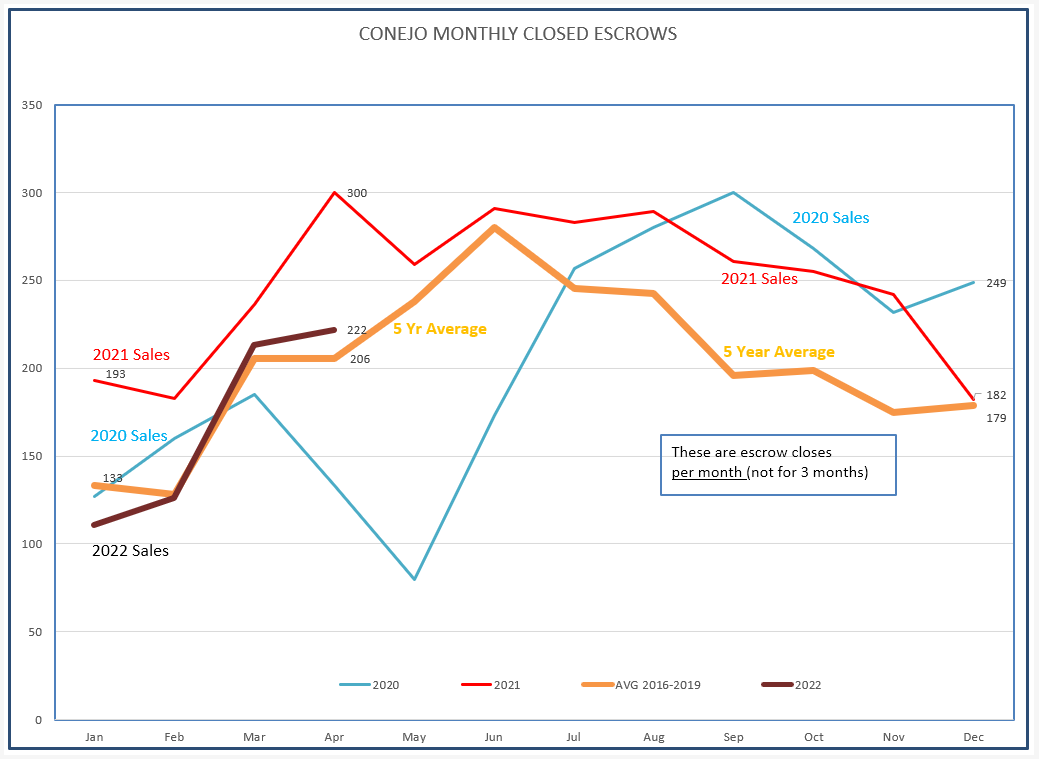
The pandemic was at first expected to stifle home sales. With real estate agents working from homes, open houses forbidden, virtual showings, contacts made with texts and emails, and contracts written electronically, we at first expected real estate to stop dead in its tracks. Instead, it surged due to working at home, removing the influence of long commutes, and a shortage of housing. A perfect storm. This chart displays the relatively consistent number of homes sold as the year progressed during the normal (orange line) years of 2015-2019. 2020 (blue line) started out normal, was clobbered by Covid in April, then reversed drastically and shot upwards the second half of the year. 2021 (red line) was an outstanding sales year, with each month beating the average. 2022 sales are closely following the pattern for normal years. However, look for that line to begin to fade.
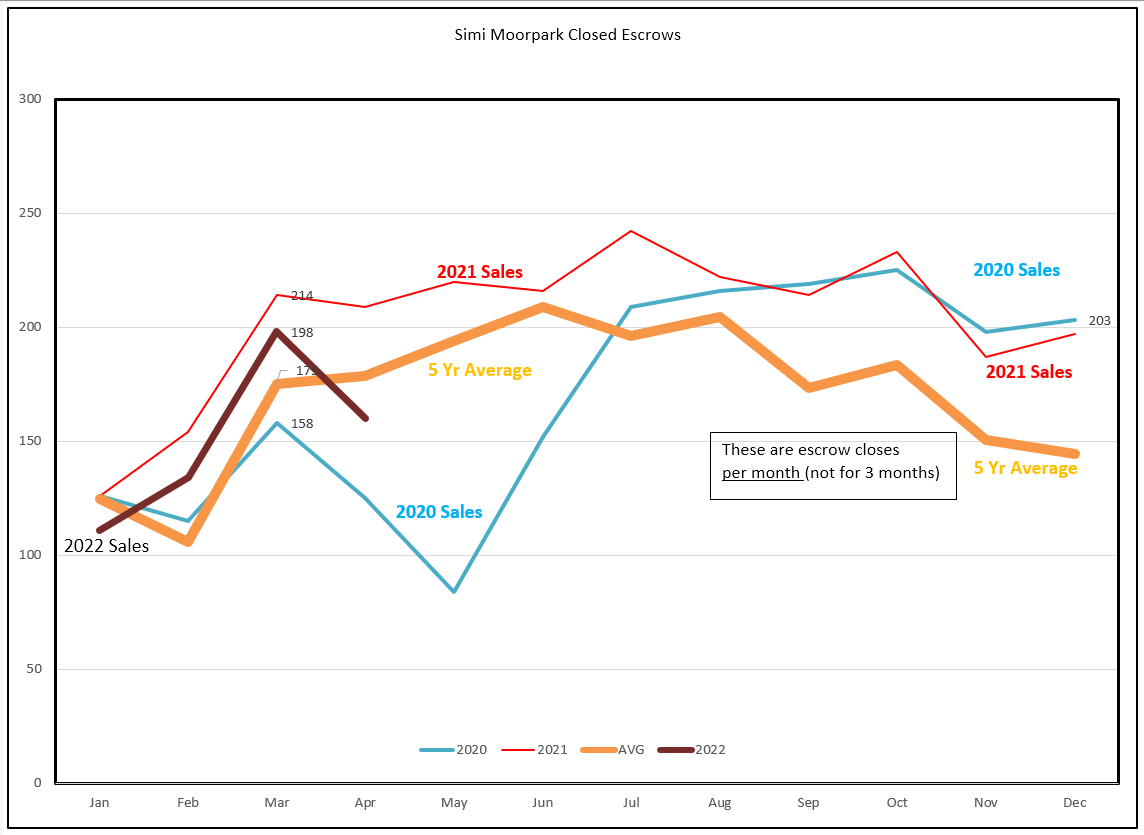
The same comments can be made about the Simi Valley/Moorpark graph, except the number of sales has already experienced a huge dip, falling below the 5-year orange line average.
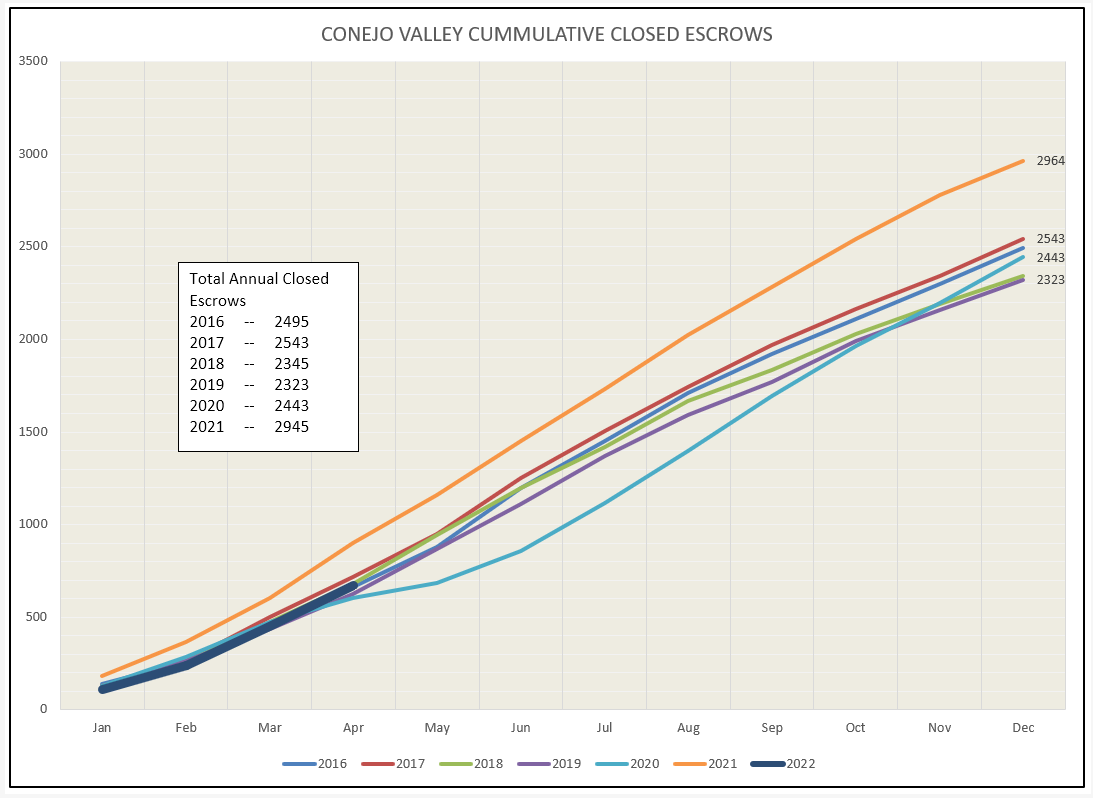
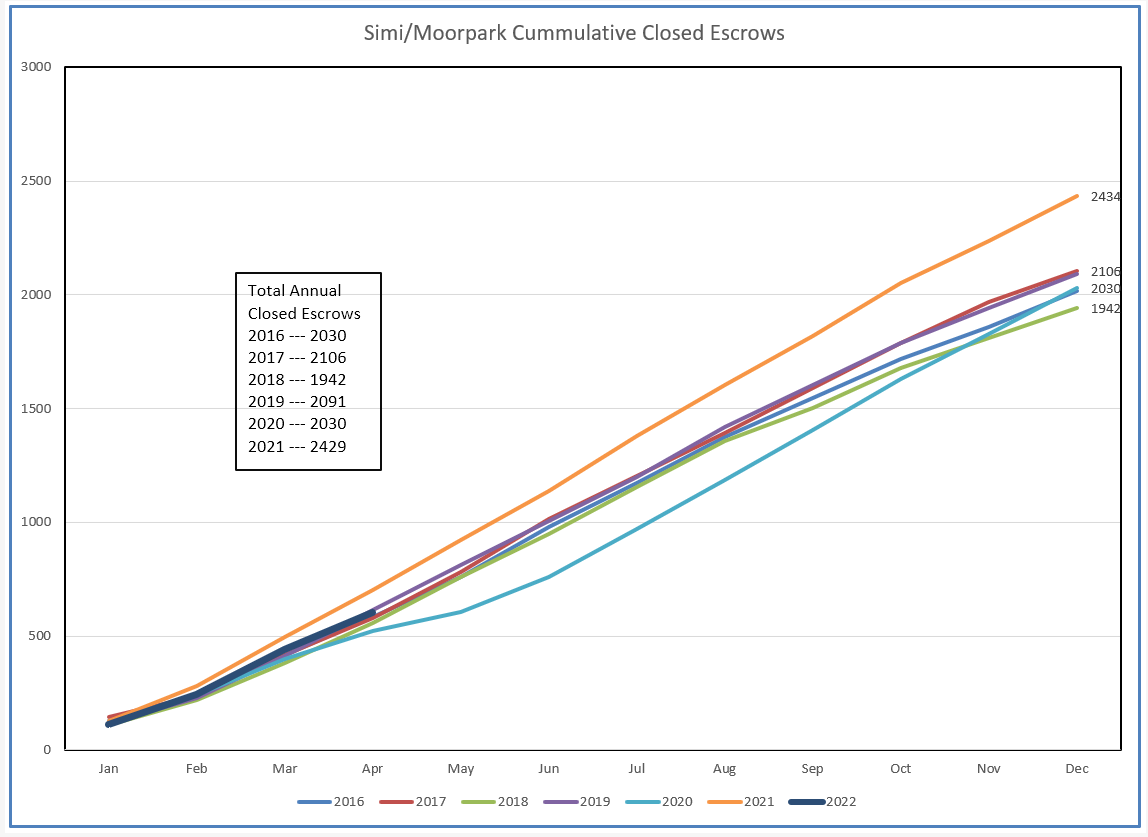
Next let’s view this information differently, as monthly sales add to the previous year to date total. Look for the dip to become apparent in the next two months. Currently we are experiencing a normal market year.
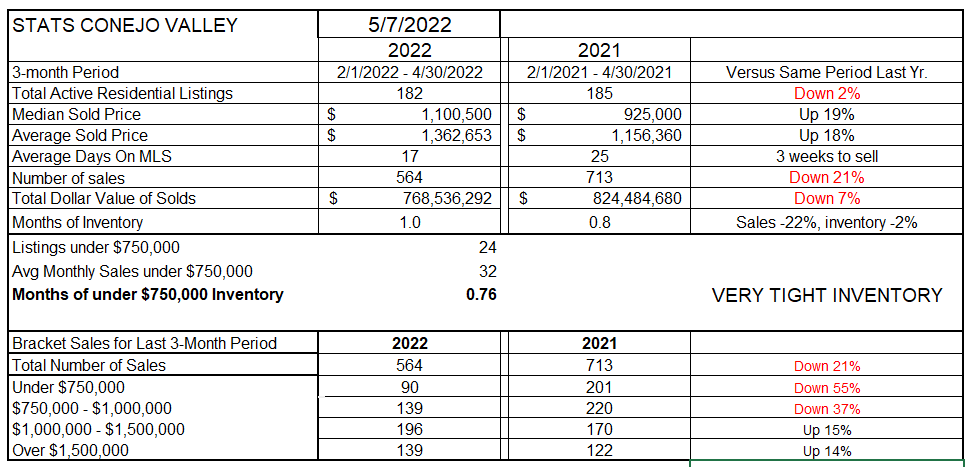
Let’s finish with our statistics chart, comparing the current three months with the same months last year. In the Conejo Valley, inventory is now the same as 2021. But remember in the inventory chart above, 2022 inventory began the year much below 2021, and has now caught up and will likely continue to increase. Year to year prices are up 18%. Homes sold quickly, between 2-3 weeks on the MLS. But the number of sales is down 21% from the same 3-month period a year ago. With sales down and inventory the same, the months-worth-of-inventory computation has increased. It takes longer to sell the same number of houses in inventory. This describes a slowing market. The bottom of the chart indicates that the slowdown is occurring in all sections of the market. Much of the reason for increased percentages in the top two price tranches is due to price increases from year to year, putting more sales into higher categories> Sales in these categories has also slowed.
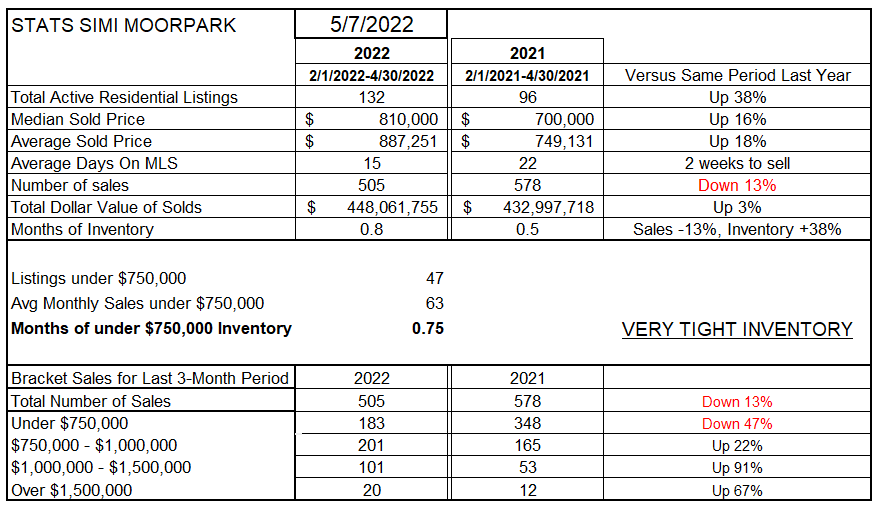
Simi Valley/Moorpark shows a dramatic percentage increase in listings of 38%, and a dramatic percentage decrease in sales of 13%. Prices year over year increased 16-18%. The available inventory is taking longer to sell.
No, the market is not crashing. But it is changing. These kind of price increases can’t last forever, particularly in the face of dramatically increasing mortgage costs. Everything is pointing to a slowdown. A soft landing is what we hope for. I teach a negotiation class, and for the past two years it has seemed irrelevant. Why study negotiation when cash buyers are winning with extreme overbids? A return to normal is healthy for the market. An overheated market can cause that fearsome bubble. There will be some settling out of prices, quality homes will be in demand, homes needing a lot of work will see fewer offers and experience some price declines.
As an example in another market, used car prices have risen ridiculously in recent times. In February, USA today reported an increase of 40% from the previous year. But cars can be manufactured quickly, supplies of new cars can increase, the chip shortage is coming to an end. Homes are much more stable. There won’t be a tremendous increase in building in our area, lots are not available. Supply and Demand fundamentals are different for homes then they are for cars. Don’t look for home prices to come down quickly. But look for them to stabilize, look for multiple offers to lessen, and look for quality homes to still be much sought after in our market.
Stay safe. IT is still out there. Covid is no longer the killer it once was, but there is still a need for caution and carefulness. And remember to return to the basics. Keep in contact with your sphere of influence. Let them know what is going on. Make sure you are their primary source of good real estate information.
Chuck
