The FED is working hard to get us into a recession. Not a strong recession, just a weak recession. Just enough to cause unemployment to rise. Just enough to cause consumer prices to fall. Just enough to satisfy the FED that rates finally need to come down. Just a Goldilocks recession.
A major component of inflation is housing cost, the price of homes and the cost of rent. Both continue to be very strong. That makes it expensive for the average American to either buy a home or rent an apartment.
Lately it has been difficult for companies to find workers, causing wages to increase. Fast food workers are getting a $20 minimum wage, many even higher. Those increased wages are passed along in the cost of goods and services.
All this impacts the meaurement of inflation.
The primary goal of the FED is to control inflation, and their main tool is interest rates. Higher interest rates historically caused a slowdown in the economy, including a rise in unemployment. But the job market has remained strong in the face of high interest rates. The overall economy remains strong in the face of high interest rates. Consumers continue to spend, not with helicopter cash from the Federal Government during COVID, but with their credit cards.
In early 2024, forecasters projected at least three interest rate cuts during the year. We are now mid-year, with no cuts, and the forecast now is for one. We hope. There is even some talk of another increase. The FED keeps hoping for bad economic news, and is disappointed that it has not arrived. It reminds me of an old black and white movie of a speeding train, with the engineer pulling back on the throttle and applying the brake, and the brake lever comes off in his hand. It appears that the FED does not have control, at least using the tools that normally work.
In our specific part of the economy, home prices continue to rise. Many buyers are no longer able to qualify for mortgage amounts they need due to higher interest rates. They are continuing to rent, and will wait until interest rates come down. That puts upward pressure on rental rates. The percentage of homeowners is decreasing while the percentage of renters is increasing, in California and everywhere. Apartments are being built instead of homes. Inventory has remained extremely low, but is now finally moving up.
If you believe in the theory of supply and demand, at some point balancing will take place. I did not invent the term bubble, but I believe we are in one. Something has to break.
Now that I got that off my chest, let’s look at why I think that way.
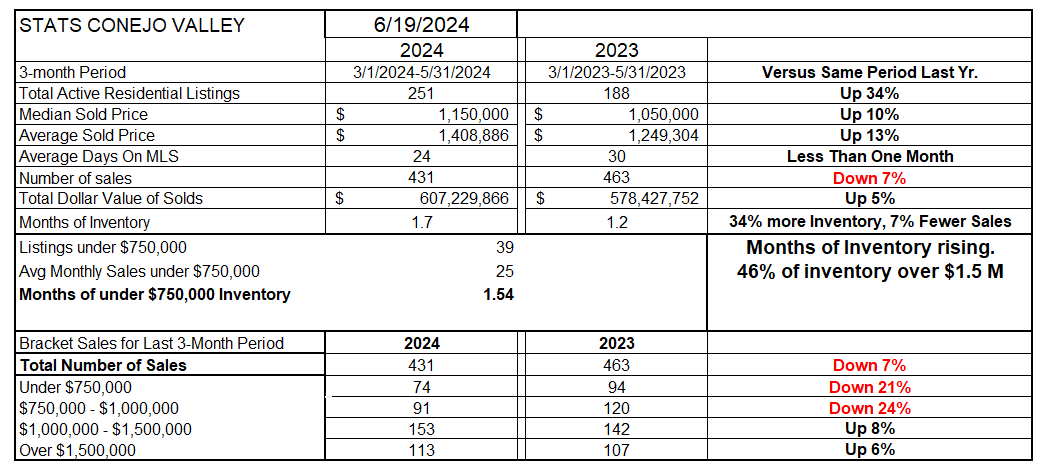
Compared to last year, Conejo inventory has increased 34% compared to last year. Prices have increased 10-13% from last year. But the number of sales compared to this time last year (for the recent 3 months) has fallen by 7%. I don’t need to remind you that sales for 2023 were the lowest annually since 2010. Measuring the months of inventory available based on these higher inventories and lower sales, the number has increased from 1.2 months worth a year ago to 1.7 months worth this year. The “lower” priced homes, those under $1 million, have slowed down a lot, down 21-24%. Homes still sell quickly, in less than a month. The market is moving away from favoring sellers toward favoring buyers, even though there are very few buyers.
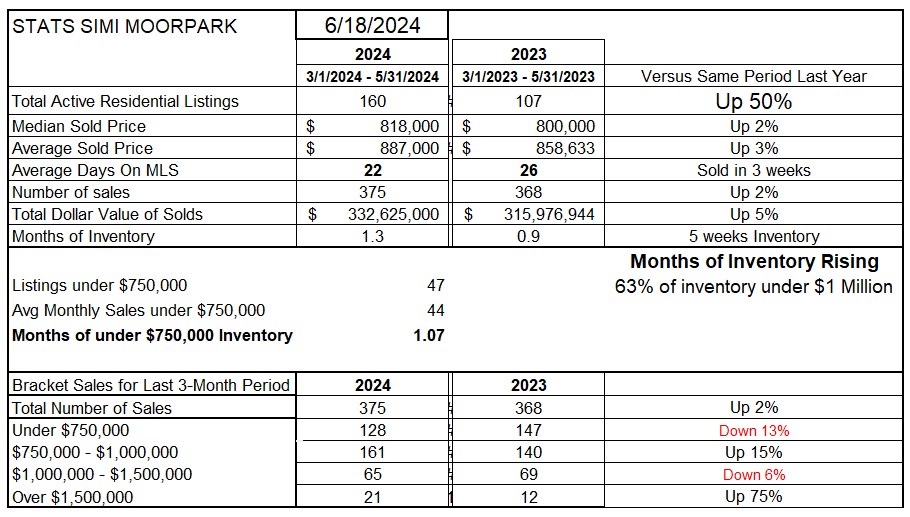
Simi Valley/Moorpark is an area with a much larger percentage of “lower” priced homes and much fewer higher priced homes. Their very low inventory of last year is up 50% this year. The number of sales is actually 2% higher than last year, but frankly sales last year were severely hampered by the lack of inventory. Prices have increased compared to the same three month period last year, but by only 2-3%. Months of inventory has risen to 1.3 months worth of inventory, and was less than one month last year. Sales of homes priced below $1 million for the prior three months were 289 in 2024 versus 287 in 2023. The same number. Homes continue to sell quickly, in only 3 weeks.
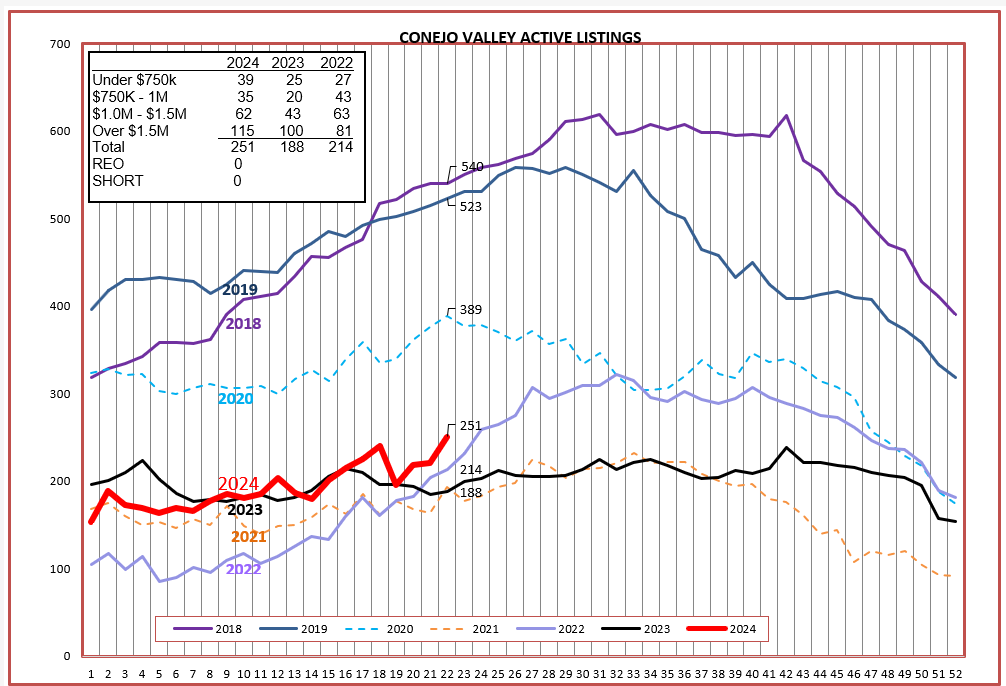
Delving into the inventory, the chart below compares the past seven years of inventory as the year progresses. The normal market graph shows inventory gaining as we move into the summer and declining in the fall. The dotted lines represent COVID years 2020 and 2021. Our past year, 2023, displayed very little growth as the seasons progressed. This year is looking more like 2022. In 2024 inventory is beginning to grow rapidly. Strong inventory growth is most prominent in homes priced above $1.5 million, representing 46% of the entire inventory, but only 26% of entire sales.
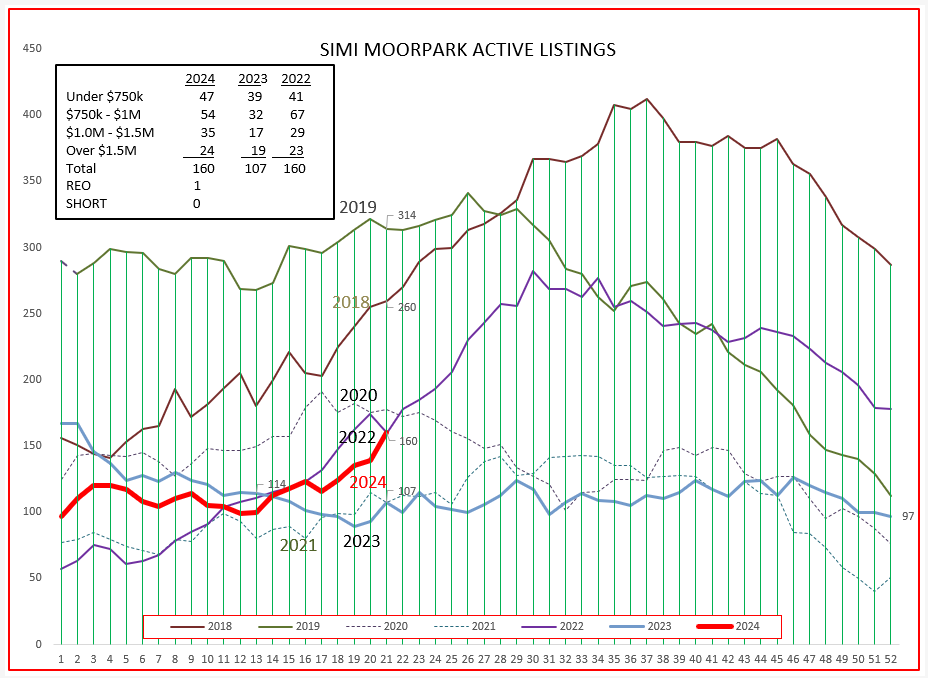
For SImi/Moorpark, the inventory took a huge jump to connect with the inventory in 2022, up 50% from a very low figure in 2023. Homes still sell quickly with slightly higher prices and volume than 2023. The rise in inventory coupled a reduced annual price increases shows a weakening market, similar to the under-$1 million homes in Conejo.
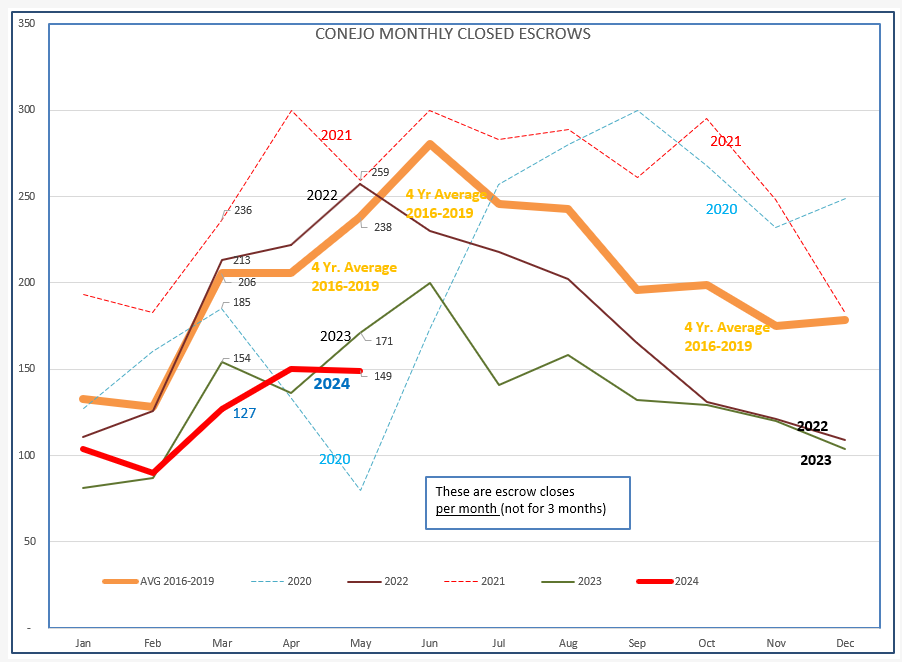
For Conejo, sales compared to the last few years shows that we are even below the very low experience of 2023, a little influenced by the fact that these are monthly numbers, not average 3-month numbers. The Conejo market is far from healthy as measured by units sold.
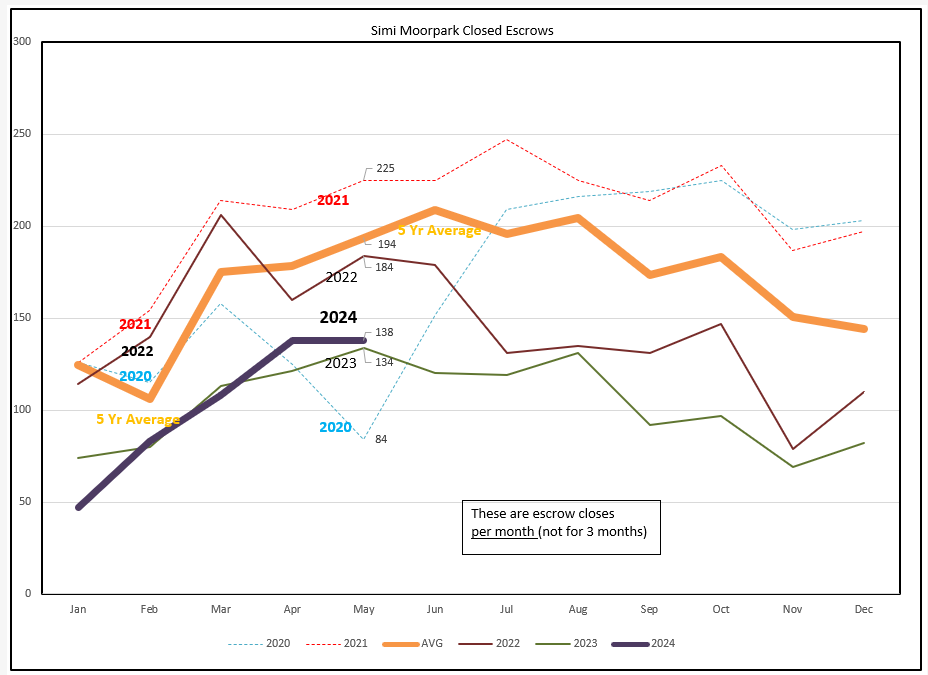
Simi/Moorpark sales numbers for 2024 are closely tracking 2023. Unless the FED provides some incentive to lower current 7% mortgage rates, 2024 will continue to look a lot like 2023.
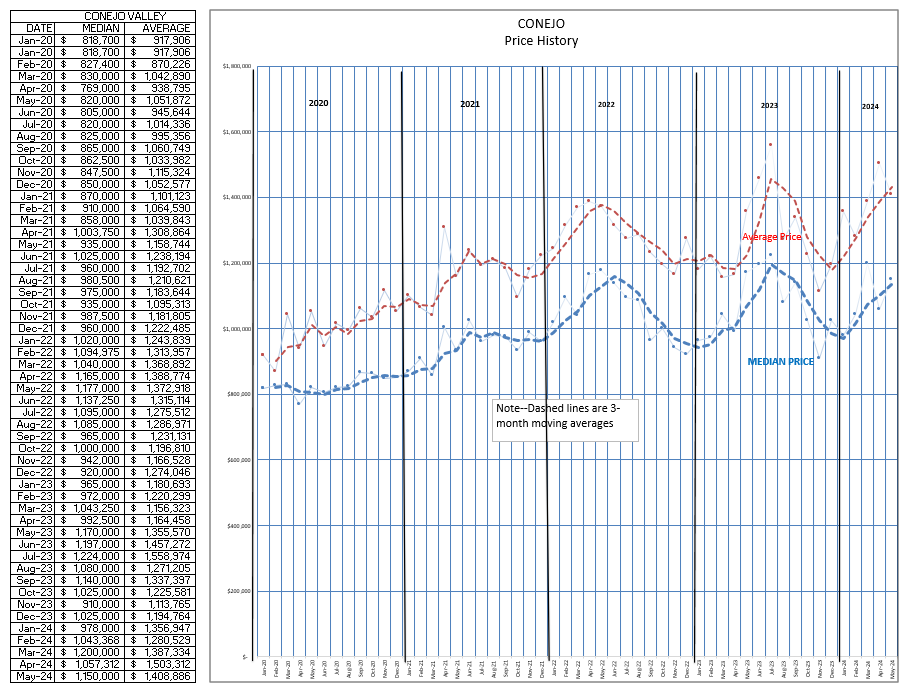
Now for Conejo pricing. Five years ago, the median price was $830,000 Today it is $1,150,000, an increase of 38%, or 7% a year. Another way of looking at pricing is to take the median price at the beginning of 2024 of roughly $1 million and compare to today’s median price of $1,150,000, an increase of 15% in just half a year. Does that mean that you should expect prices to increase 30% this year? If you study the chart over annual spans, you will notice prices spiked mid-year and then fell back by year end. Given that history, we can expect prices to start receding.
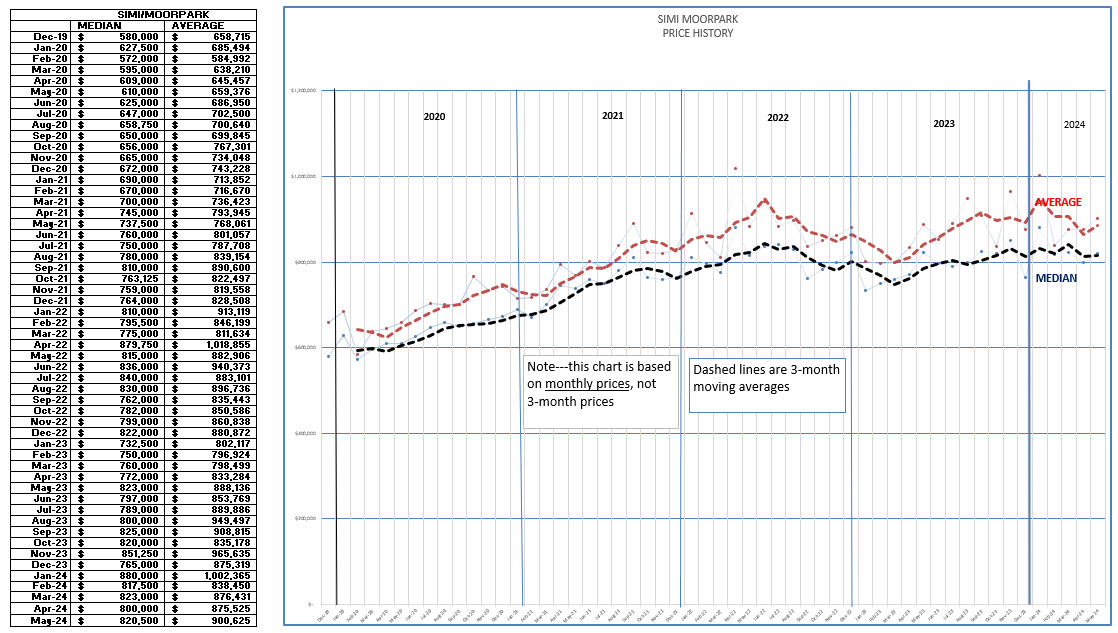
SImi/Moorpark prices have not grown as strongly as Conejo, but they are more stable, less ups and downs.
Five years ago, the median price was $600,000 Today it is $820,000, an increase of 37%, or 7% a year. (Same as Conejo) Another way of looking at pricing is to take the median price at the beginning of 2024 of roughly $800,000 and compare to today’s median price of $820,000, an increase of 2.5% in just half a year. This chart is different from Conejo, as we see more strability in pricing, with less peaks and valleys.
So what of the future?
What’s going to happen next? My crystal ball is in the shop. Let you know soon.
But until then, don’t expect the strong price increases to continue. Prepare for pricing stability at best.
Keep safe out there.
Chuck
Lots of interesting articles lately. The market is changing. Buyers know it, sellers don’t.
Here is a sampling. Make sure you read about the elephants.
Existing home sales are back to 1978 levels
Home prices begin to come down in pandemic boomtowns like Austin, Tampa
Housing Shortage: There Are Two Elephants in The Room
Florida Homes Empty as Housing Market Tumbles in Some Cities
