This market is being pulled in different directions by different forces.
It would be easier to add up all the forces on one side and compare them against all the forces on the other side.
 But that would make analyzing the real estate market much too easy. Imagine tying another five or six ropes to the flag below, then adding to the people tugging on those ropes Congress, the Fed, the banks, consumer confidence, company closures, company expansions, people immigrating to the US from other countries, foreign investors, family formations, student loans, and you get a very confusing picture. Never mind forecasting the future, sometimes just explaining the present can get confusing.
Even without all these forces influencing the market, sometimes the numbers get confusing.
For example, let’s look at the active listing charts.
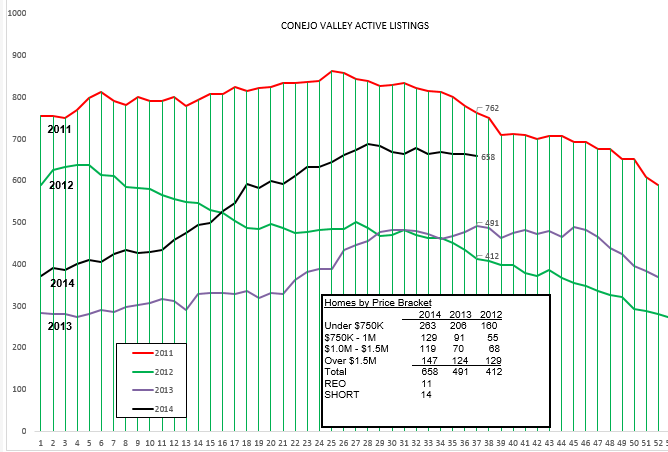
When looking at the graph, things look fine. We are expecting the inventory to drop as we head into the holiday period. The box shows inventory numbers this week compared to the past two years. Inventory is up, apparently in all categories, spread evenly. No problems.
Also, it seems the inventory has been somewhat uninteresting in the past couple of months. However, the price levels within the entire inventory have been moving dramatically. The highest price category has been steadily increasing. The next category down, homes priced between $1 million and $1.5 million, saw a huge drop last week, from 132 listings to 119, a 10% drop. Why? Price drops. Every week we are now seeing about as many price changes as we are new listings and homes going into escrow. Prices are dropping.
We have a chart that looks at prices. It records prices for individual months, both median prices and average prices.
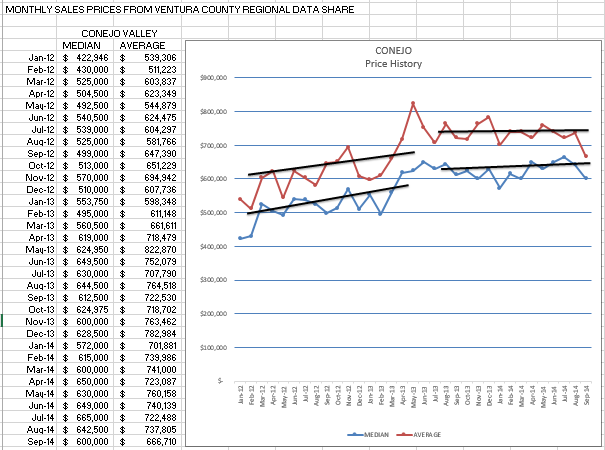
Look what happened to these median and average prices in September, compared to the previous months. The prices above are for individual months. Let’s see how that compares to the average of the past three months, which tends to even out the changes.
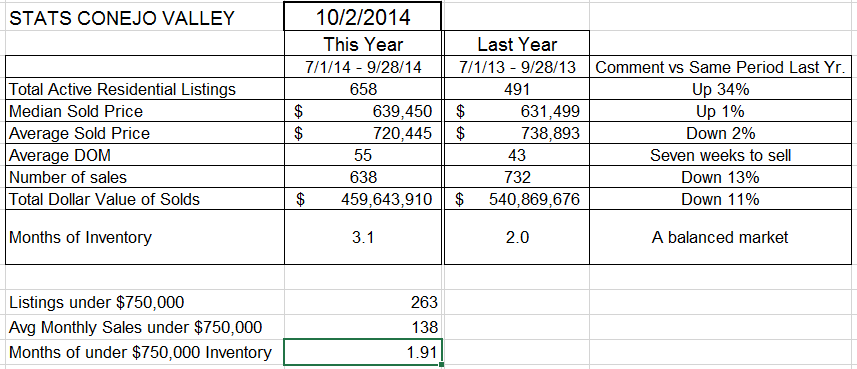
The figures on this chart show a median sold price of $639,450, up form last year’s $631,499, The the chart above shows the median sold price for September as $600,000, a huge drop. We cannot compare real estate markets day to day, or week to week, but this $600,000 figure made me go back and run the statistics again. Yes, it was correct. The average price dropped an even larger amount, from August’s $737,805 to September’s $666,710. On further analysis, the drops are a combination of fewer homes sold in the high priced sector and price drops in all sectors.
Have we seen that in the closed escrow chart?
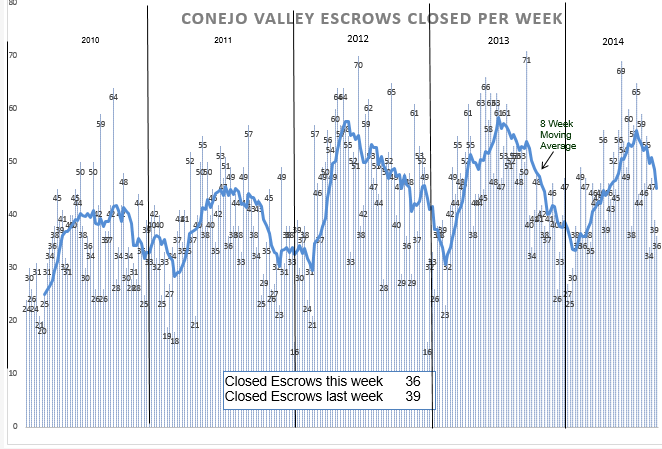
While we expect escrows to drop off this time of year, the slope of the dropoff this year does seem precipitous. And don’t forget, these closed escrow figures represent contracts signed 30-45 days prior. The real estate business in the Conejo Valley is challenging.
Months of supply still show a healthy balance between inventory and sales. Total inventory represents 3.1 months of sales, and the inventory of homes priced below $750,000 represents less than 2 months worth of sales. But realize that these figures have two components. Even if inventory does not change, if sales drop off we will see the months worth of inventory figure climb.
What is the result? We must go back to the standard of supply and demand and price. The supply will continue as people have a variety of reasons to sell their homes. But the slowdown in demand will provide more inventory than the demand requires, and that will put downward pressure on prices.
Is there any good news? Yes, as prices go down a little, we will see affordability go up. More people will be able to afford to buy homes.
SIMI VALLEY/MOORPARK

Looking at the charts, it seems like the inventory wants to go down, but is having trouble deciding. One of the most interesting changes can be seen in the box showing how many listings are in each price category. The number of homes listed over $1.5 million has been consistent in the 11-13 range. This week we have 4. 7-9 homes disappeared from that range. Where did they go? To the $1 million to $1.5 million range, that range jumped from 24 last week to 31 this week. We are experiencing price reductions across the board.

While the Conejo closed escrow chart has taken a dive, the Simi chart has had a resurgence. Lower priced homes still continue to sell well.
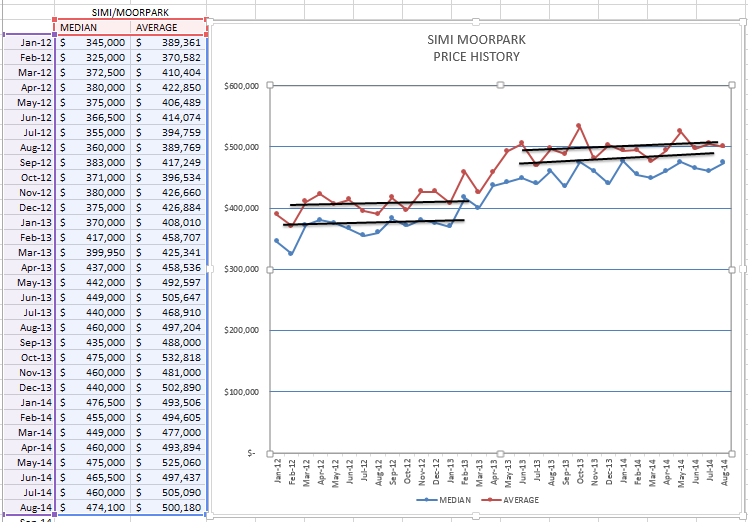
Prices in Simi valley continue to do well, unlike the drop experienced in Conejo. Month to month, prices continue to increase slightly over the term of the chart above. Let’s see how things have been doing by taking the last three months into account, smoothing the ups and downs.
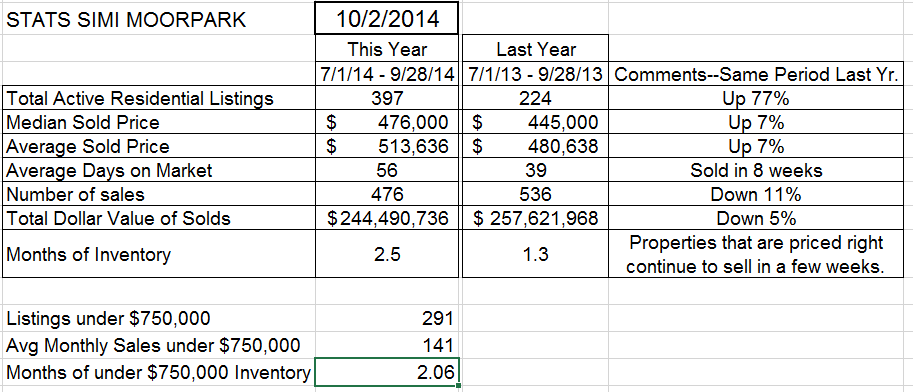
Median and average prices are up, 7% over the same 3-month period last year. Inventory is up a lot, but inventory last year was terribly low. Everything looks good until you get down to the number of sales line. Down 11%. However, with continuing low inventories, prices in Simi Moorpark should remain reasonably stable.
What’s the main difference between our two areas? The number of high priced homes. That is where the real slowdown is occurring. It is not across the board. The other main area where the slowdown is occurring has to do with mediocre homes. If homes are creme puffs, they are selling. If homes are fixers, and they are priced as fixers, they are selling. If homes are outdated, worn, not staged well, they will sit on the market. They have to be fixed with cash, either cash to bring them into better shape, or cash in the form of a lower price than they had been realizing when the market was stronger.
How is the market? With sales down 11-13%, and price reductions occurring daily, things could be better. And they will get better. We still have extremely low interest rates, we are still one of the best places in the country to live, our economy continues to grow by most standards, unemployment continues to decline, job growth remains consistent. It looks like the housing market is not going to be satisfied with one big jump, it is hunkering down to take another big jump in the future. It’s just not fun going through this particular period of time, but the second rebound will take place. You should be getting ready for that rebound now. It’s a perfect time to do your marketing and add to your client base.