Tricks or treats? What does the market have in store for us?
We are concerned that things may be going badly. We are hoping that things go well.
But the best we can say is that the market is going. It has stops and starts, ups and downs, but mostly it just keeps going. And we can be grateful for that.
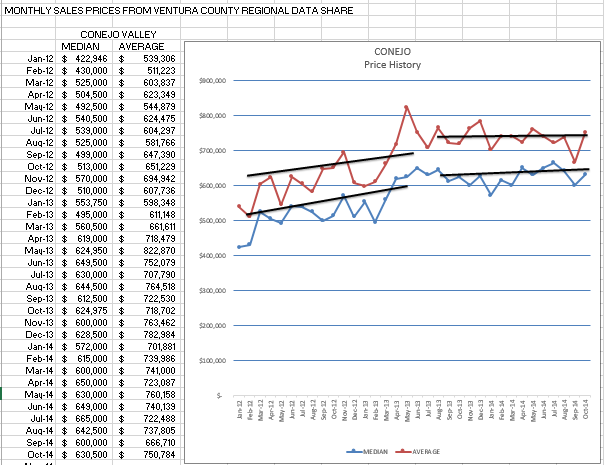
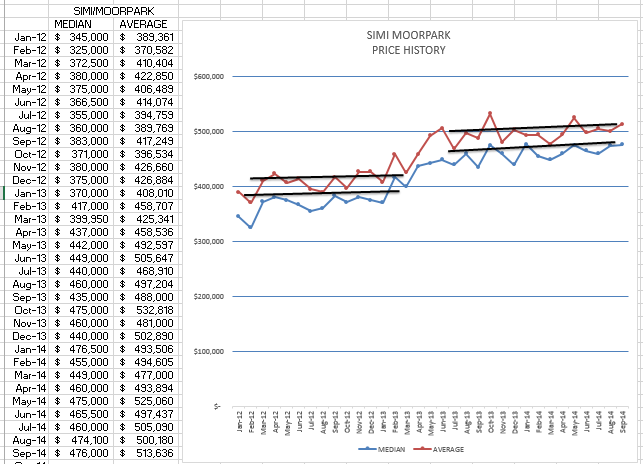
Perhaps the best pictures that describe this are the price charts from the last three years.
Instead of nice smooth lines, why do we get all these jagged edges? Because from month to month, even though we sell 200 homes a month, the pricing average can change dramatically. Kind of like describing California as having an average temperature of 75 degrees. Maybe accurate, but every day, every week has big changes. Every chart has its ups and downs. Has it changed compared to last year? Yes. but the big change in price came in the first half of 2013. Prices took one big leap, and since then have been meandering along.
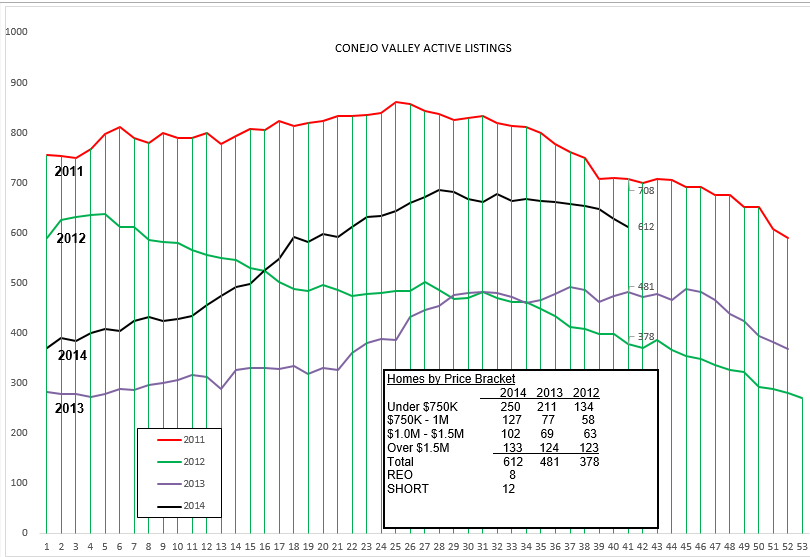
Let’s look at the basics, starting off with inventory.
The 2014 Conejo Valley chart above is proceeding normally, rising through the beginning of the year, peaking in the summer, falling off as we head towards year end. 2013 did the same thing. 2011 and 2012, there were lots of stories there. But it feels good to be in a normal pattern. Check out the box with the statistics for the past three years. The biggest growth is in the middle price ranges. The lowest price category is short on inventory, the highest price sees impervious to change, consistent from year to year.
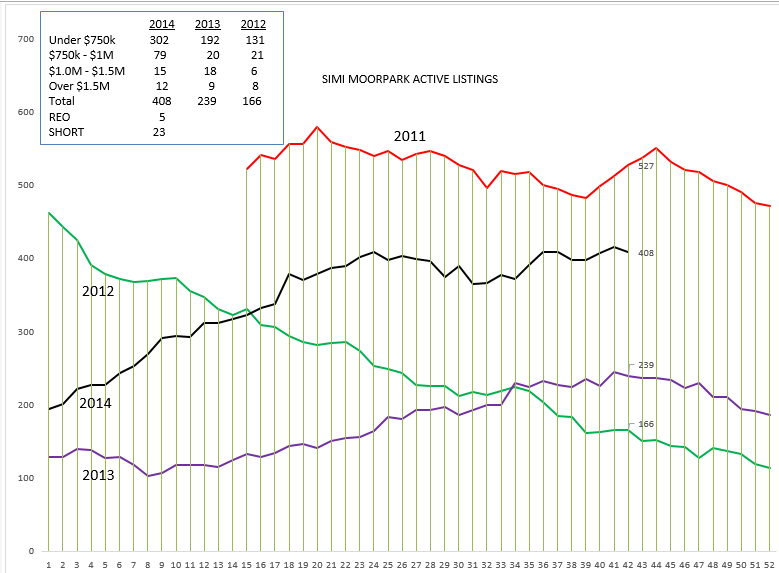
Now, on to Simi Valley/Moorpark.
Simi Valley/Moorpark charts remain a little funcky. The inventory dropped like a rock in 2012, beginning the year near 500 and ending close to 100. Free fall. Lots of REOs, lots of Short Sales, lots of low priced sales, lots of investors. Down to an inventory of one month worth of sales. 2013 was better, more stable, with nowhere to go but up with the inventory. Still a strong market, still with sales limited by lack of inventory. Instead of falling as the year ended, the inventory kept growing. And in 2014, it kept growing. It has now leveled out at a reasonably high level. More on this when we go to the statistics chart.
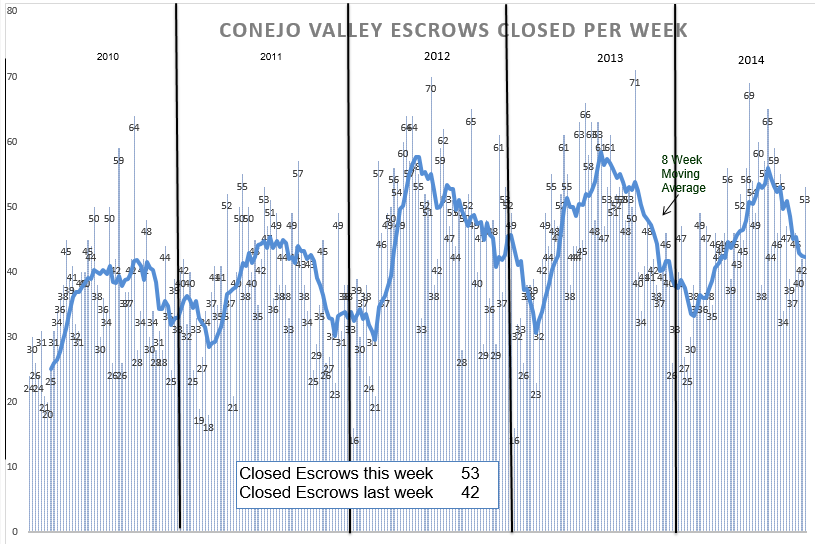
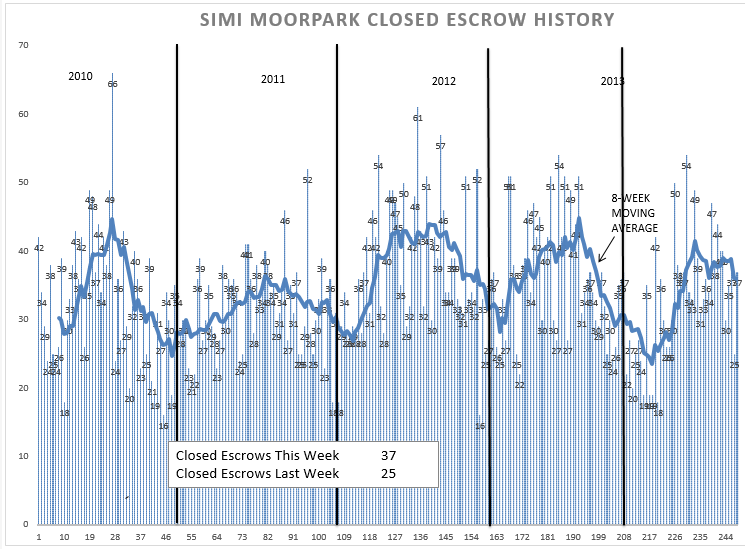
Inventory and sales, as measured by closed inventories, must be discussed together. Talking about one without the others is like saying the score in a ball game was Dodgers 6. First, let’s look at Conejo Valley.
Chartists dream of graphs this reasonable, this regular. The highs for the past three years are good and strong, even the lows are moderating. If this keeps up, we should be very pleased. Not a record setting year, but a very healthy history of home sales. From the chart, nothing to worry about here.
When you figure this one out, let me know. the beginning of 2014 was scary, but sales have recovered nicely. But why the huge dip to start the year? And why was 2011 so different from the rest of the years, so different from the Conejo chart? Someone out there has the answer. Please share your thoughts. I really am stumped.
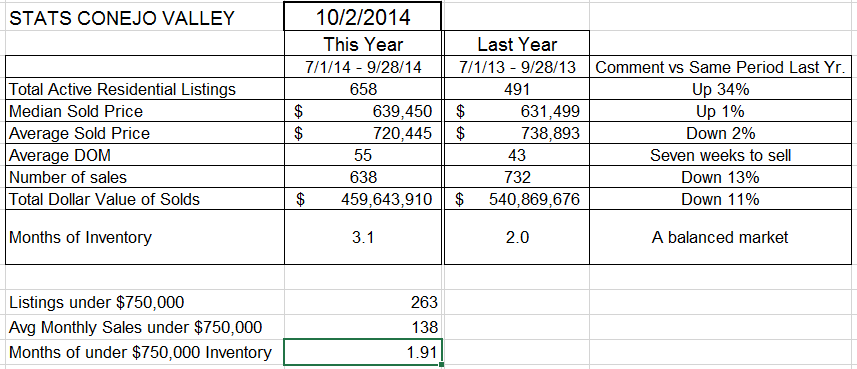
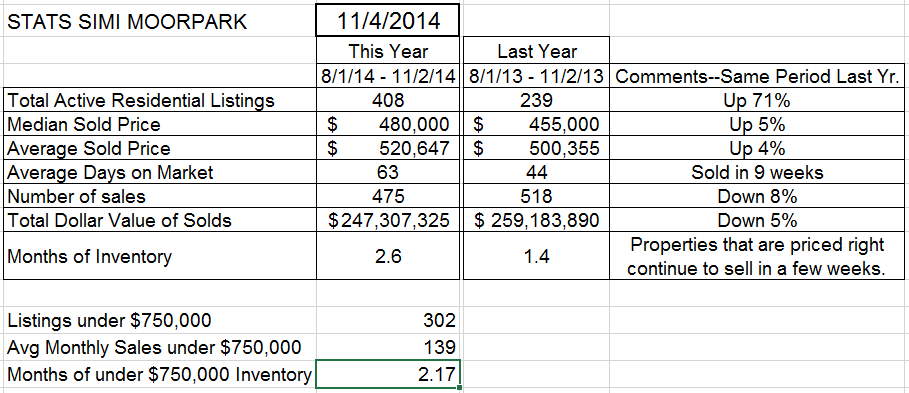
Now to the statistics page. This is the stuff your elevator speech is made of. The history is not year over year, but the last three months of this year compared to the similar months of 2013.
Inventory—higher. 34% higher. That’s a lot, but the increase is moderating. And last year we were extremely short of inventory. We are actually short of inventory right now, certain types of homes. Only 3 months worth of sales in total, but much better than 2 months last year. And the “low priced” inventory, under $750,000, is only 2 months. A shortage of inventory combined with strong sales should provide for prices to increase. However, look at the number of sales, down 13% this year. That is what has prevented prices from increasing. Why?
Partly the “Amgen Pall”. (Thanks, Tim) It is a feeling that it is going to rain. 2,900 job cuts. We were all worried about what the layoff would do to home prices. For months. It was excruciatingly painful for the folks worried about being laid off. Then, October 22, it was done. Only a few hundred, much less than feared (unless you got the pink slip). Good, at least that is behind us.
For a week. One week later, another 1,100 job cuts were announced. Amgen employees are being terrorized. And that fear spreads to the market. But so far, no disasters, no falling sky, we still have consistency with inventory, sales, and prices.
The statistics for Simi Moorpark are very different. Inventory is up a whopping 71%, but it was higher. It is moderating. Actually, it has stabilized. The year began with a significant lack of sales, but normalized as the summer approached. Prices are actually higher by 5%, while the number of sales is down 8%. All in all, not too shabby. Inventory remains low, propping up prices.
What does next year look like? Better to go to someone a lot smarter than I, let’s go to the forecast by Leslie Appleton-Young.
She is forecasting sales to increase 5.8%, prices to increase 5.2%, and mortgage rates to average 4.5%. Talk to Tom Covaleski of Wintrust. Interest rates for FHA loans today are 3.5% – 3.75%. Fabulous rates. The kind of rates that should get those first time home buyers excited about moving out of their rentals and apartments and into a home of their own.
An LA Times article talked about rents increasing 8% in the next 24 months. Two years. The rates above are fixed for the next 30 years. You could lock in your “rent” for 30 years. Make sure you include interest rates in your elevator speech in answer to the question “How is the market doing?”
Have a prosperous week.
Chuck
