The end of the year has some of our favorite holidays. Thanksgiving, Hanukkah, Christmas, and New Year’s Eve. Time to give thanks for what we have, time to plan for the next year to make it even better.
Our company coach, Stella Balasanian, will be helping us plan for a successful 2016 in a special meeting on Friday, December 11, from 10:00 to noon at the Newbury Park Library. If you would like to attend, just let me know. Free to all. Beneficial to all.
Let’s look at the statistics page to see how this year if finishing up. Remember, I compare the last three months with the same three months of 2014, so the percentages may be different from what you are hearing from NAR, CAR, and Case-Schiller. Also, this data is very local, not country-wide or effected by large neighboring cities.

With only one month to go, our inventory is down 16% compared to the same period last year. Median prices are up 5%, average prices up 11%. Why the difference? More higher priced homes bring the average up higher. Days on market about the same, although that formula has not been accurate in the MLS for a long time. The number of sales are up 7% compared to the same three months last year. Inventory—TIGHT. Inventory of homes in the Conejo priced below $750,000—unbelievably tight. The combination of higher sales and lower inventory should push prices up. C.A.R. is forecasting an increase of 6.3% in units and 3.2% in prices. I think the price forecast may be low. Given the current low inventory trend, we may start the year without as much to sell as buyers would like to buy, and that will force prices up, particularly in the first quarter.

Simi Moorpark median prices are almost $200,000 lower than in the Conejo, and their number of sales are higher by 9% over the same three months last year. Prices are up 8%. Low inventory is also the potentially limiting factor in Simi Moorpark. We expect inventory to be lower as we head into the holidays, but this has been the case all year long.
One big surprise came when I ran the Average Prices. Simi shot up over $100,000. A little research showed why. There was a single sale of $33,000,000 in Simi, a little place with 57 bedrooms and 40 baths on a 5 million square foot lot. Yes, not exactly residential, but it was quite a buy, $16 million lower than list price. I have excluded that sale from these statistics.
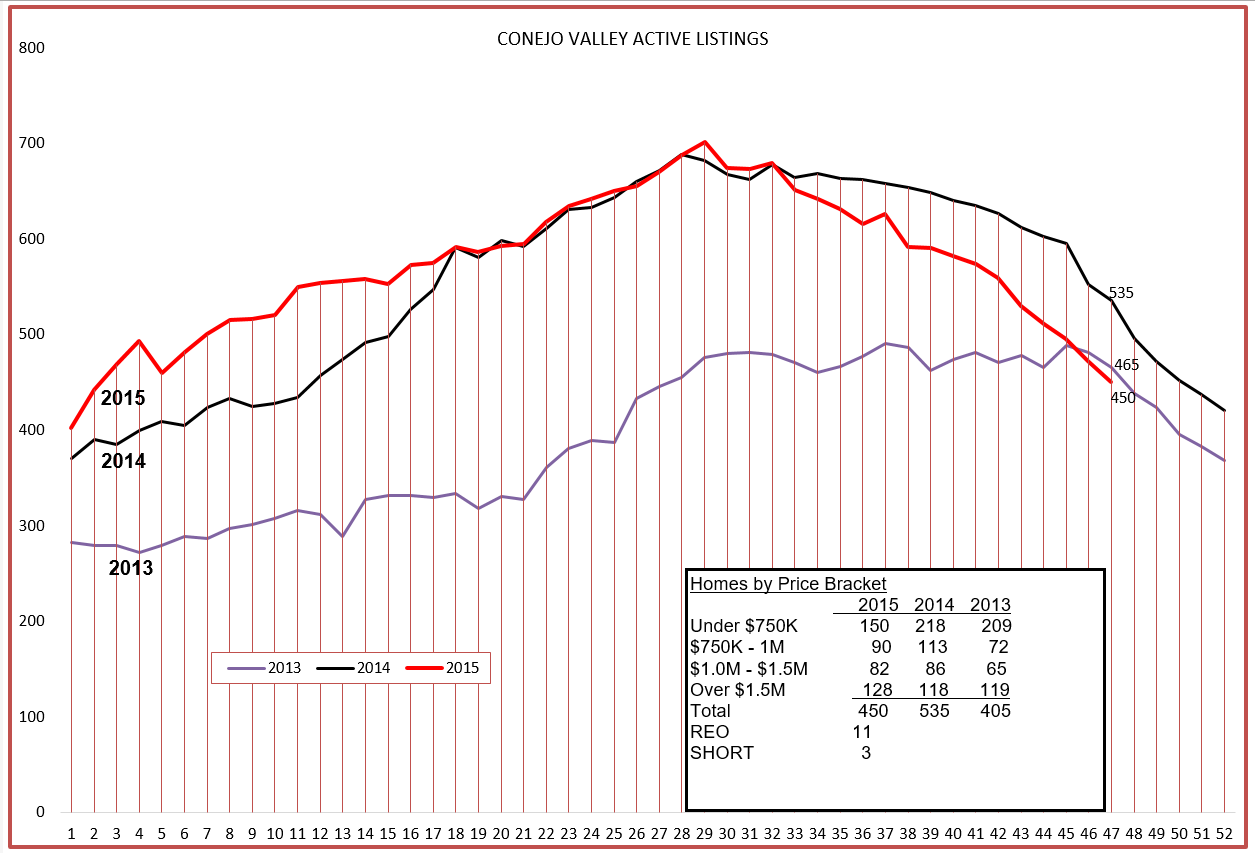
You can see from this chart the reason for my comment on low inventory. The 2015 graph is heading down, and will probably finish the year much lower than the 2013 graph. That will create some upward pressure on pricing as 2016 begins, particularly on homes priced below $750,000. Looking at the box within the chart, you can compare the past two years and see the difference between the inventory priced below $1 million and the inventory priced above $1 million. REOs and Short Sales will always be with us, but there continues to be very few in this category.
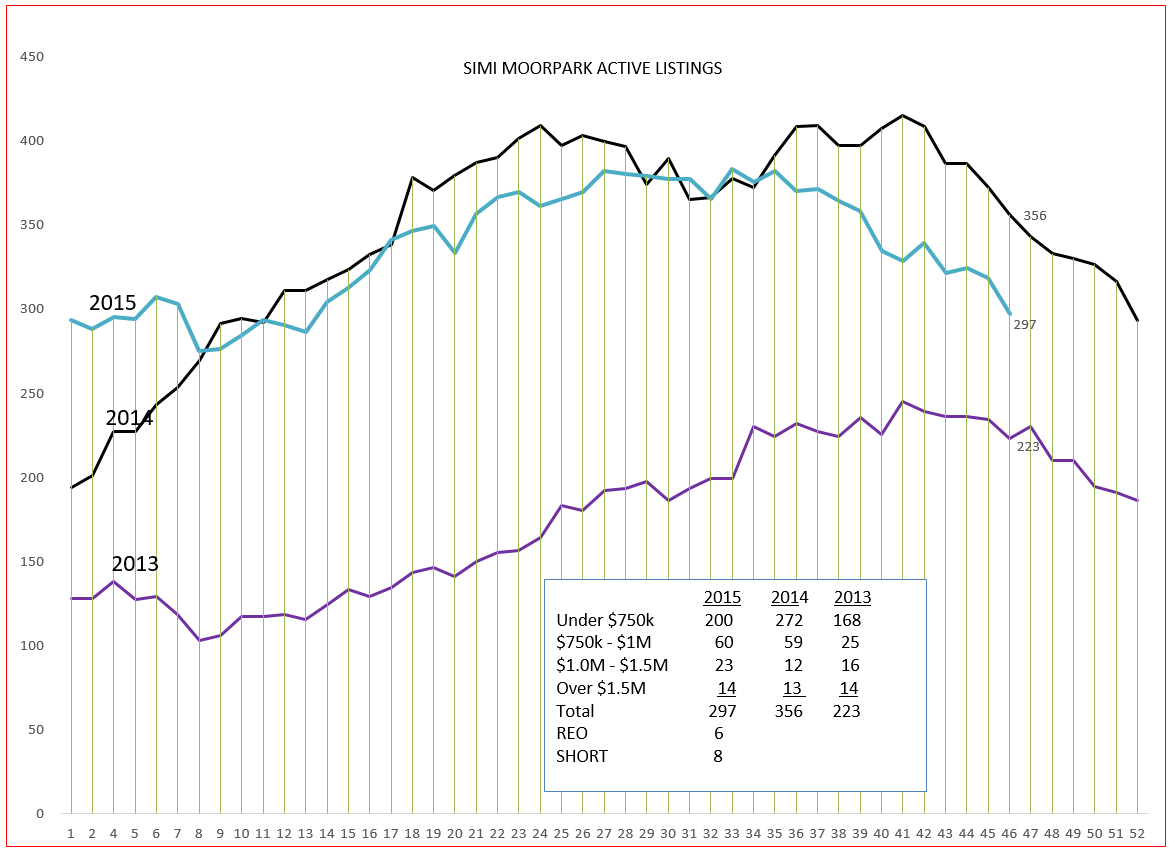
Simi Moorpark has not experienced the usual inventory curves expected through the year, and the inventory is heading down to the low levels experienced in 2013. REOs and Short Sales continue to be present, but minimal. There is a small group of listings over $1 million, but most of the sales action has taken place in the half-million dollar area.
What is available for sale has to be compared to what has been selling.

For the past few years, sales have been very light in January, denoted by the white spaces under the 8-week moving average (heavy blue line). Homes often go off the market for the holidays, and go back on in January. With TRID influences, anything selling in early January will not close until probably mid-February, so look for this January blank space to continue. Sales will be occurring, but closings will be delayed. We have been having extremely good luck when our team of New Penn Mortgage, Intervalley Escrow, and Orange Coast Title have all been able to work together. If that happens, we can close in 30 days. If it doesn’t, coordination between these three functions has built-in delays.

Simi Moorpark has been interesting (chart-wise) for the last few years. The 8-week average has been smoothing the escrow closes, which often are alternating very high weeks followed by very low weeks. If anybody can figure this one out, please let me know. Interesting.
So what has this done to pricing? First, let’s look at the history.
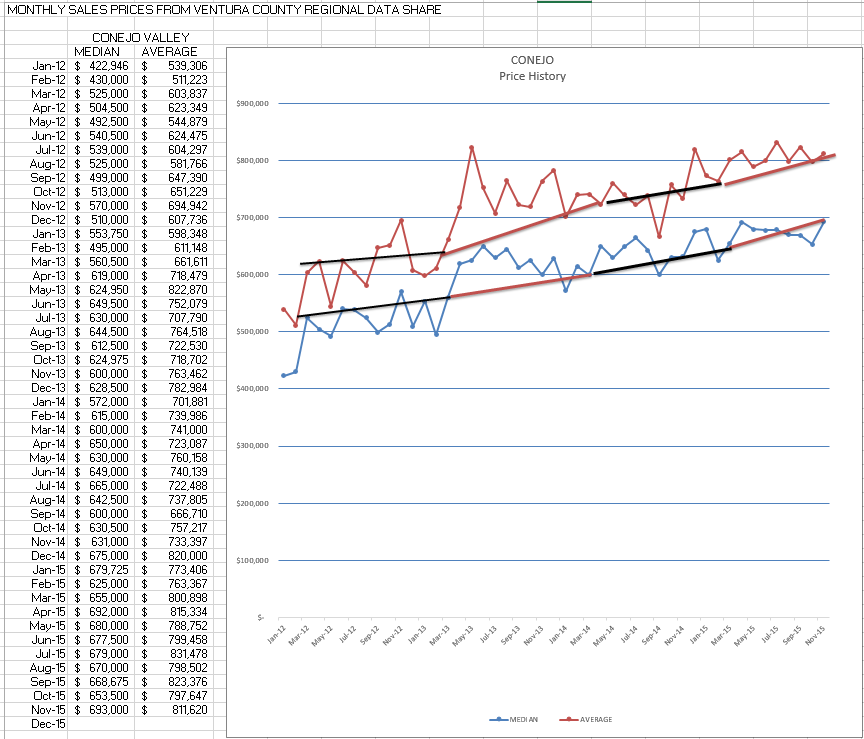
Because of the low inventory in 2013, prices jumped in the beginning of the year. Watch for the same thing to begin 2016.
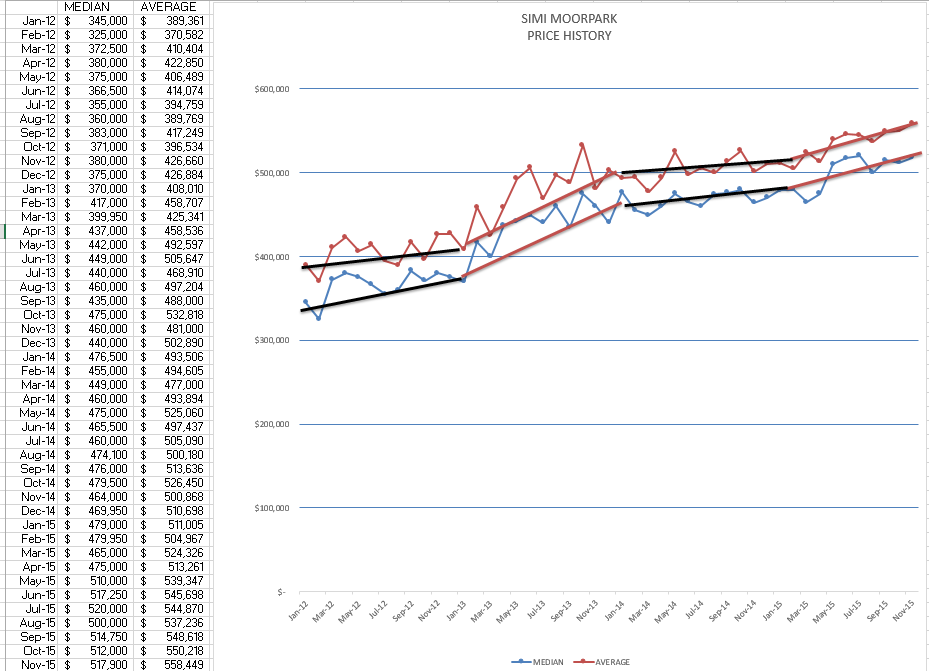
Same story in Simi Valley. Same forecast.
Taking an elevator ride? Someone asking about real estate? What should you say?
The market has been very strong, with prices up 8% over last year, and 8% more homes being sold. Inventory is very low, representing only two months worth of sales. The inventory of homes priced below $750,000 is particularly tight. C.A.R. is forecasting an increase of 6.3% in units and 3.2% in prices. I think prices could easily increase more than that. Would you like me to send you some information?
Although Thanksgiving has past, there is still plenty to be thankful for. A healthy mind and body, good friends and family, and it appears the economy continues to get better, but not overheated. Lots could go wrong, but let’s concentrate on all the things that are going right.
Chuck