The Fed Plan, that is. The FED wants to slow down the economy to bring inflation down.
In the first quarter of 2022, Gross Domestic Product (GDP) decreased by 1.6%. A recession is formally identified as a fall in GDP in two successive quarters. We are half way into a recession.
One of the most important important components of the economy is consumer spending, and an early measurement of consumer spending is consumer confidence. Below is the latest chart from the Conference Board. They lack confidence.

In the Covid years, the Fed has engaged two major policies to lower mortgage rates. They have kept interest rates low, and they have bought large amounts of Mortgage Backed Securities (MBS) for their portfolio. This year, they have significantly raised interest rates, and they are no longer purchasing MBS, The chart below displays the FED rate history.
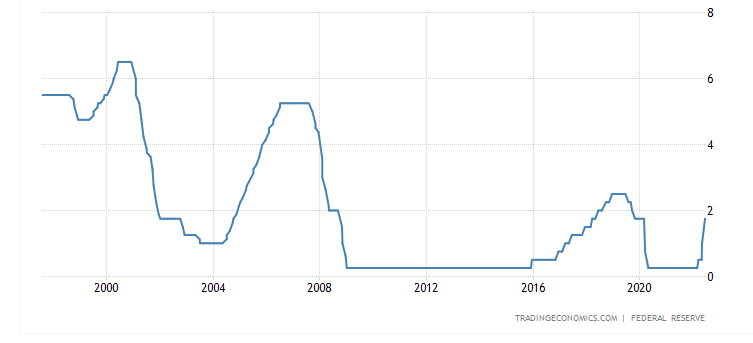
Interest rates still remain relatively low. Rates were raised considerably prior to the 2008 Super Recession, and then dropped and kept near zero to provide stimulus to the economy. In 2016, things were going well and the FED consistently raised rates 1/4% point almost monthly, until early 2020 when COVID threatened another recession.
In addition to the FED dropping rates (Monetary Policy), Congress threw massive amounts of money at the economy to keep it afloat. (Fiscal Policy) Look at my past blogs to see how much.
Mortgage rates do not follow the Fed Funds rate, they normally follow the 10-year treasury rate. Except for the drop in rates caused by COVID, the 10-yer bond is what closely coincides with the 30-year fixed Mortgage. The chart just below is the past five years of 10-year bond rates, and the chart below is for the 30-year mortgage for the same time frame.
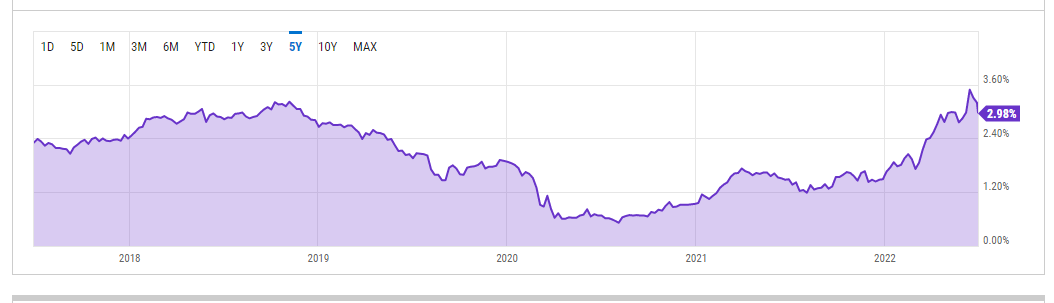
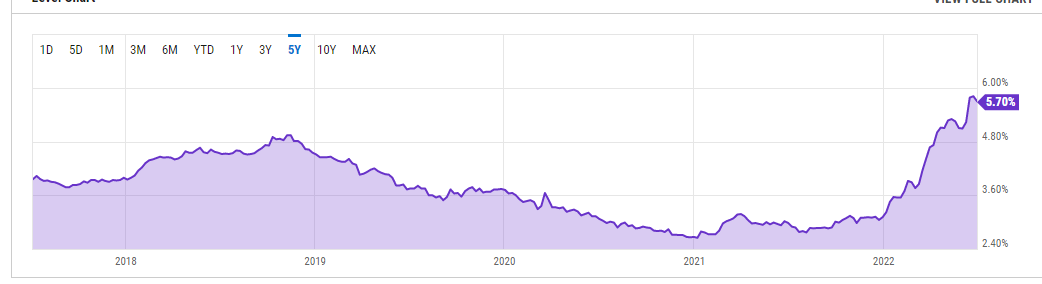
The 10-year bond is the one to watch to see where mortgage rates are going. And in this time of inflation, it is important to compare apples and apples. There are reports of food manufacturers selling good in smaller packages, effectively raising the cost without raising the price for a box. And I now consistently see quotes for mortgages with points added. Make sure you compare apples to apples.
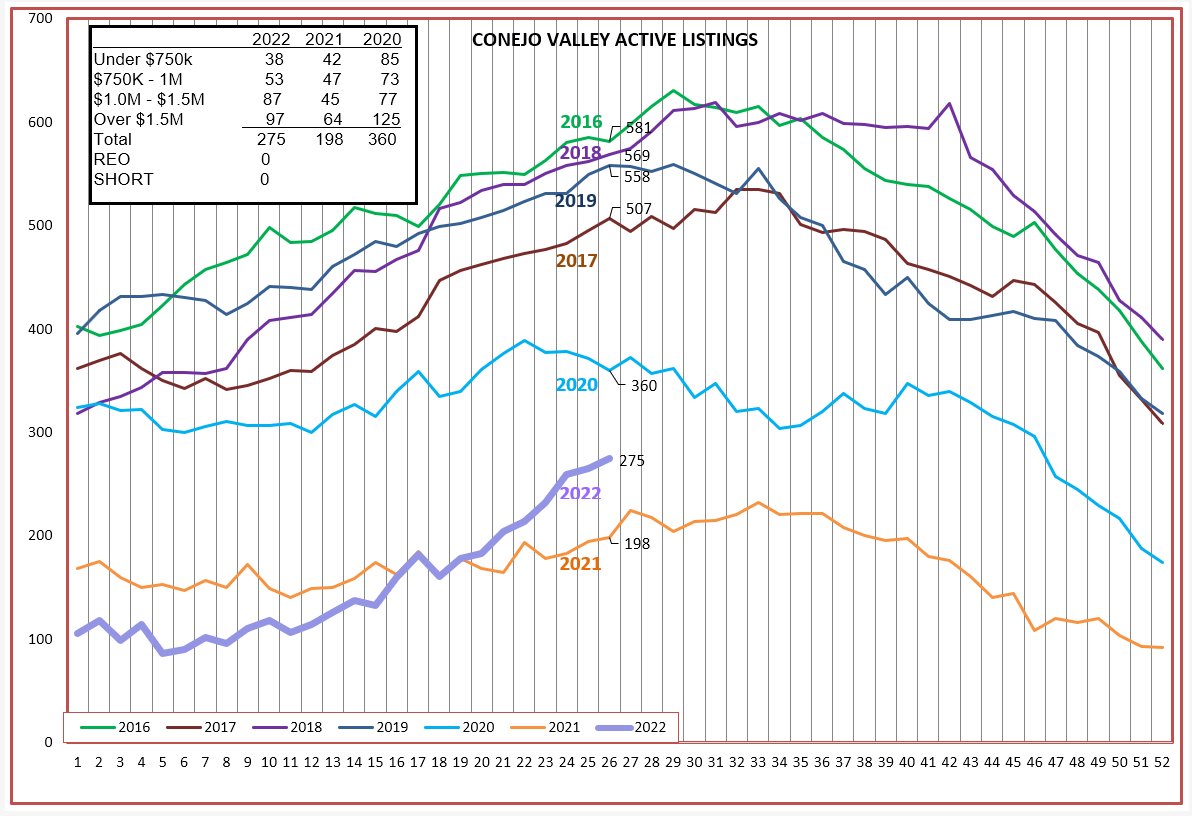
All this talk of tightening in the recent announcements from the FED should be slowing the market down. Yes, it has begun. When our market slows down, we expect to see inventory increase. The number of Pending listings will drop, forecasting a drop in the number of closed escrows. And prices will stabilize, or may even drop a little. Homes will stay on the market longer. The number of listings attracting multiple offers will decrease. There are charts for all these metrics, but I will give you the local charts I have been following.
A strong move to increase inventory is taking place. 2020 and 2021 saw practically no growth as the year proceeded, but 2022 seems to be following the path we normally expect as we go into the summer months.
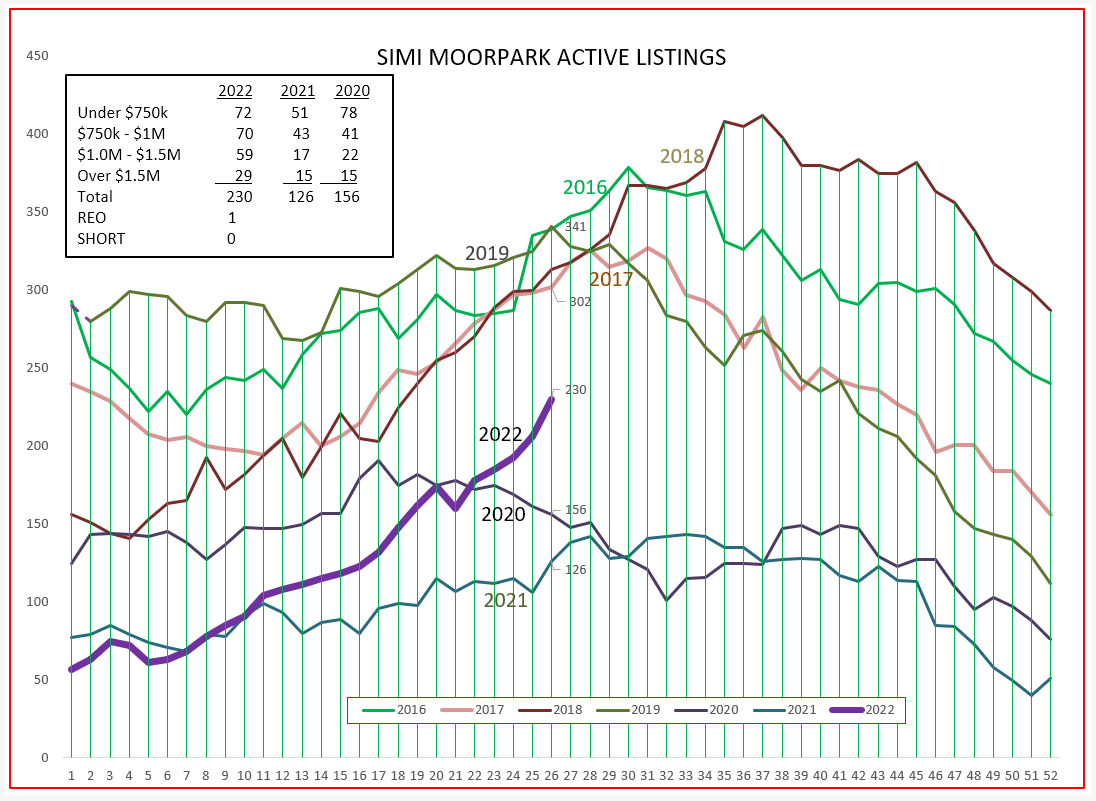
Simi Valley and Moorpark are seeing very strong inventory growth, almost double the amount of listings available last year.
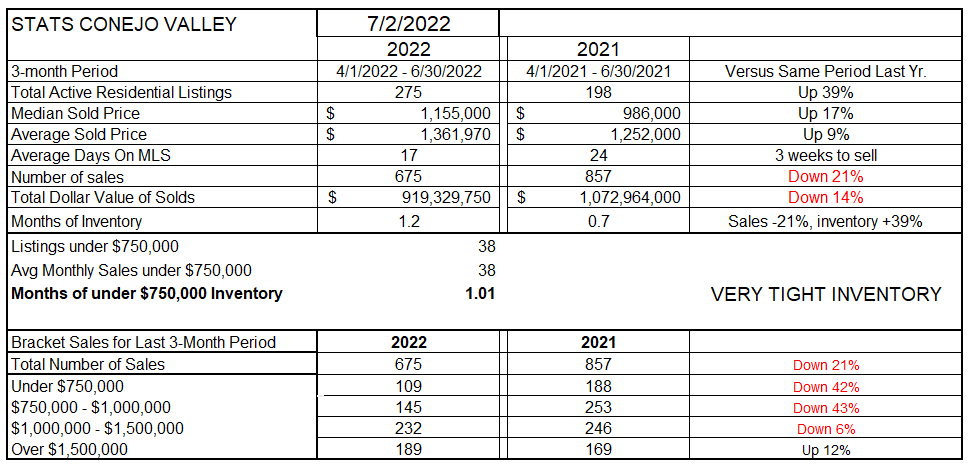
Let’s see how this year and last year compare on the statistics table. For Conejo, inventory availability is up 39%, while the number of sales is down by 21%. But remember, the sales number is not what is happening today, it represents contracts written two months ago. This table records the average of the last three months versus those same three months a year ago. Prices are stabilizing, particularly the average prices, which are more influenced by the number of higher priced homes. Lookin at the bottom of this chart, the number of sales for all price tranches (slices) are down significantly except the highest price group.
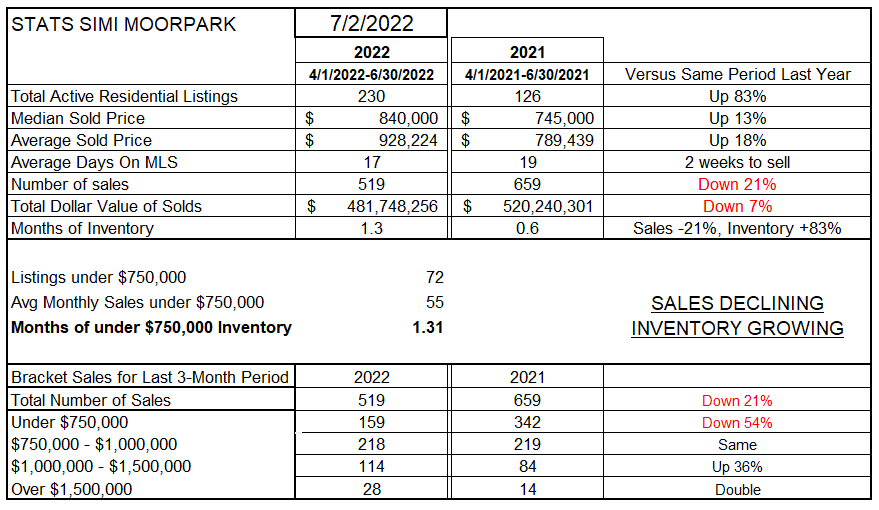
For Simi Valley and Moorpark, the story is similar. Inventory has been minimal to non-existent for a couple of years in Simi/Moorpark, but now the numbers are increasing strongly and are 83% higher than a year ago. Median prices are stabilizing, but average prices remain high because (bottom of the table) sales of homes above $1 million are very strong. Inventory is up 83% while sales are down 21%.
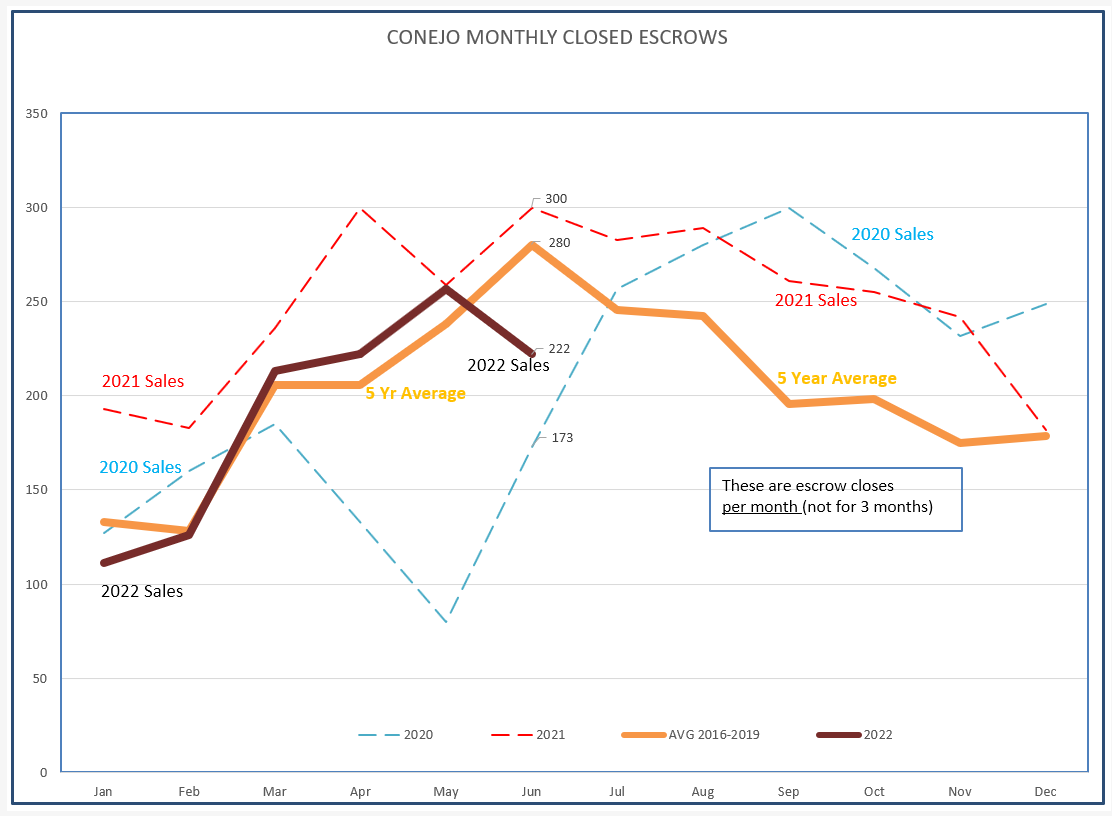
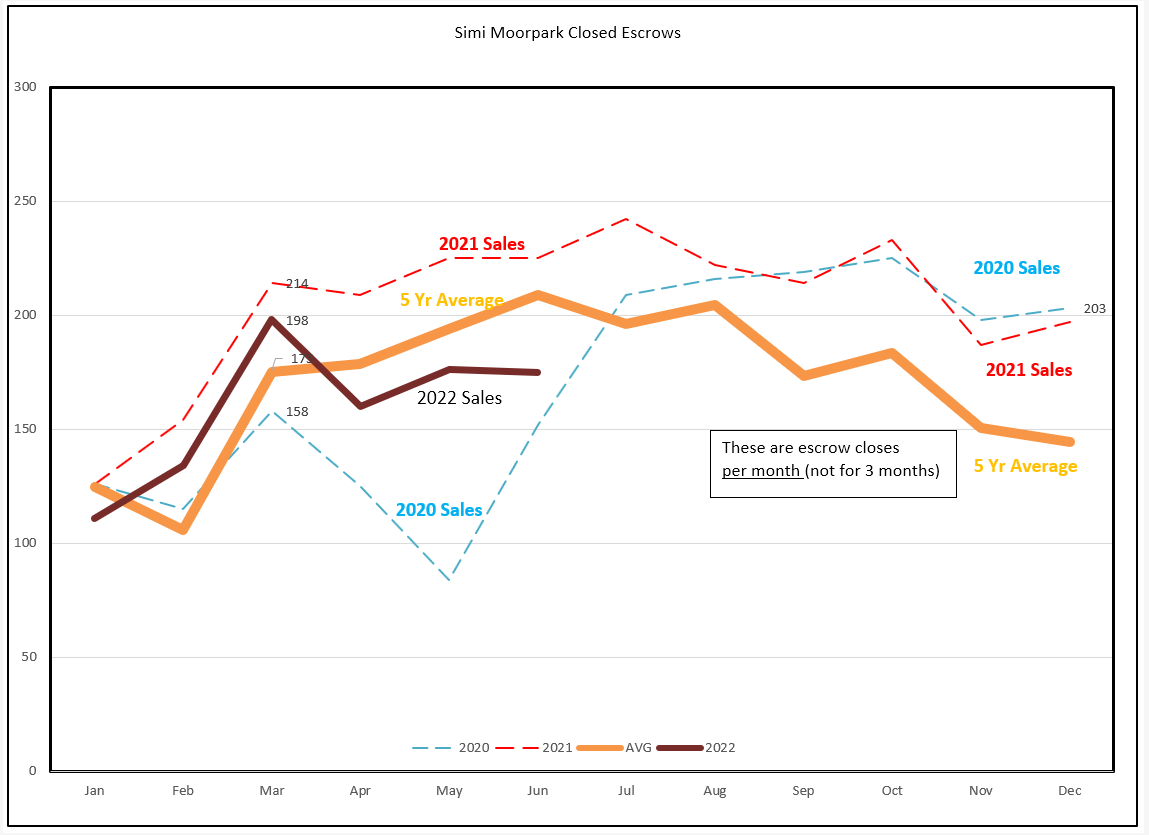
How is demand doing? Again, these charts are based on contracts written two months ago. I have changed the covid years to dotted lines, because they are abnormal. The heavy 2022 line was following the 5-year average, but dipped strongly last month. I expect that dip to continue as this year progresses. Inflation pressure, high home costs, concerns about inflation, consumer confidence, and the almost doubling of mortgage rates will continue to have an effect.
For Simi/Moorpark, the same holds true. This year started out more normal, but things are changing, decreasing sales.
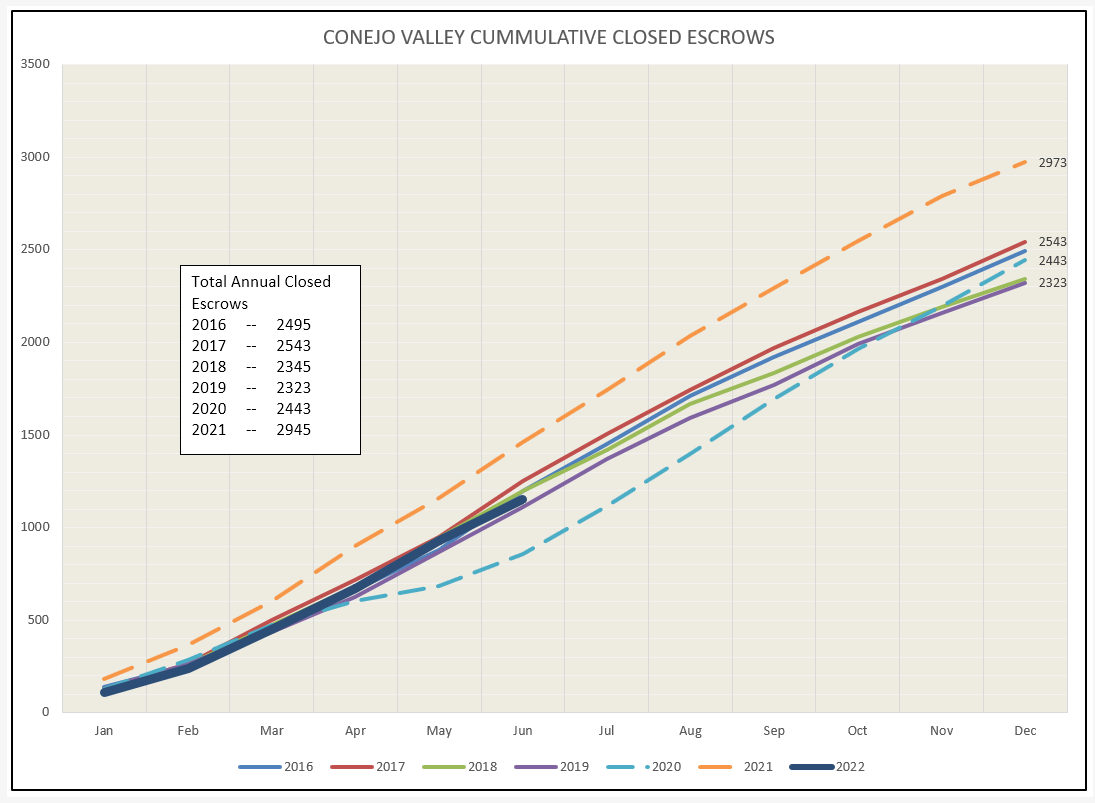
Looking at the same information to see how things are changing as the year progresses, let’s look at the cumulative sales charts. You can see that the curve started out pretty much in line with previous years, but has taken a recent dip.
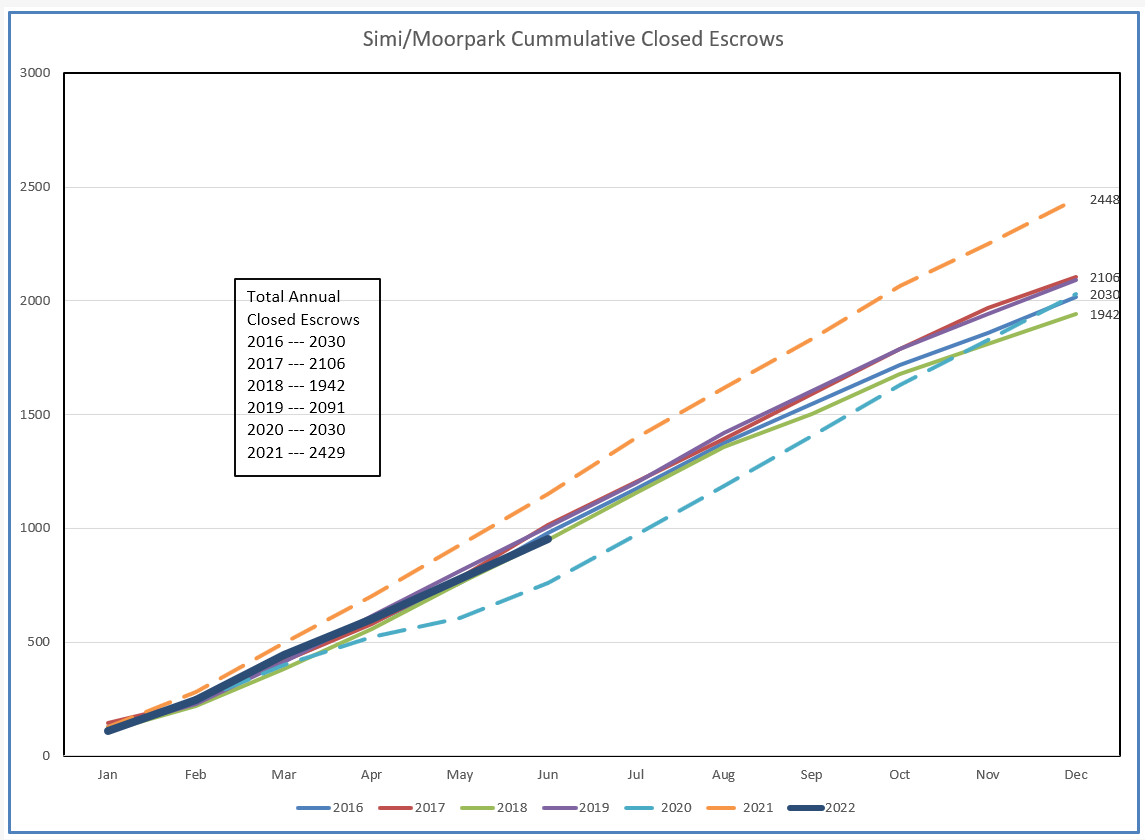
Simi/Moorpark is similar, the trend is down.
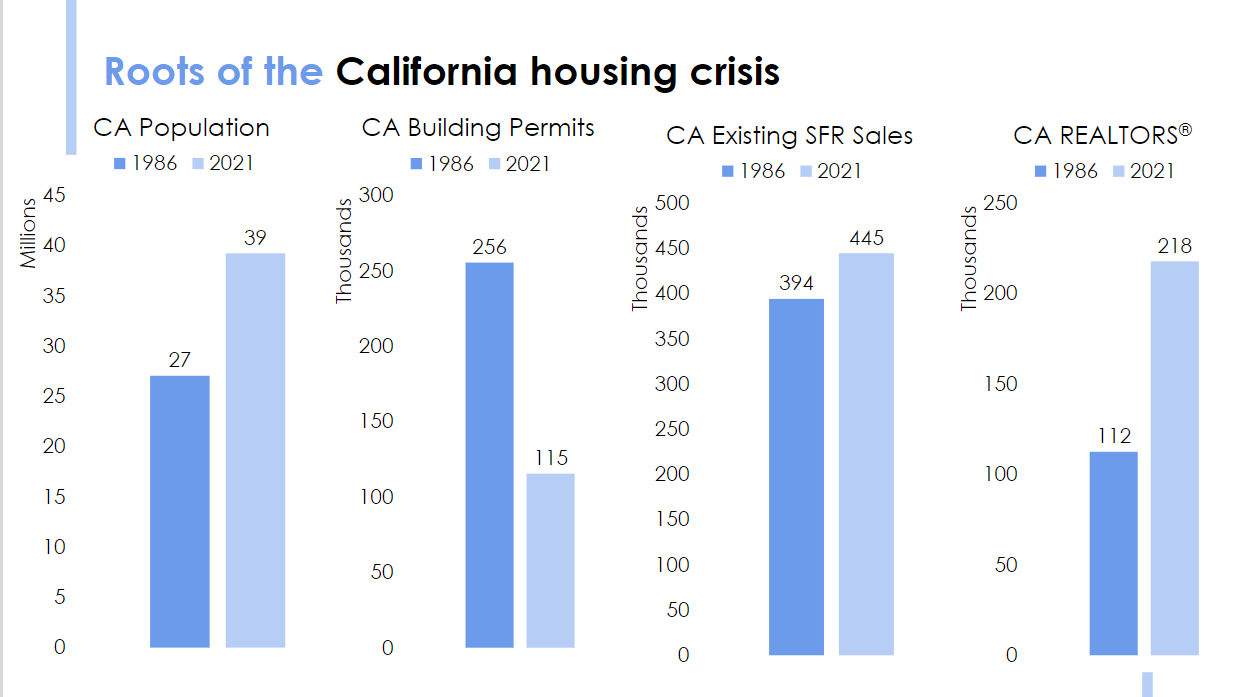
With inventory increasing and sales decreasing, we look for prices to begin to stabilize. They should not fall through the floor because 1) there is no bubble and 2) we continue to experience the result of years of underbuilding. I suggest you go to the CAR website to view the presentation Jordan Levine made on June 24 to the AEs and GADs. Copied below is one of his slides. Population in California was 27 million in 1986, increasing to 49 million in 2021, a 44% increase. Building permits in 1986 of 256,000 units compare to only 115,000 units in 2021, even though we know we are desperately short of housing. There continues to be a housing shortage, with no quick solution in sight.
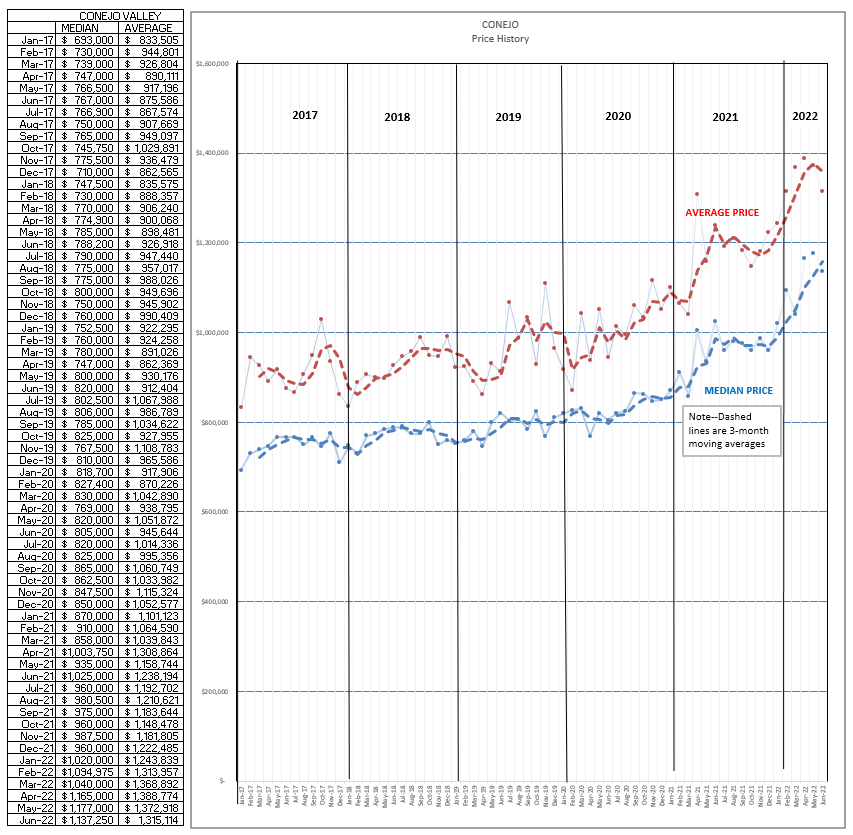
Finally, let’s look at the history of prices. These prices represent the median and average prices for one month, not a three-month average. But they also represent contracts that were written two months ago. The three-month comparison table showed average prices beginning to stabilize, down to only 9% after months of double digit increases. However, median prices remain strong, up 17% based on the information in the table. The difference between the two lines represents the strength of the higher priced inventory. In future months, I predict both figures will stabilize, strong increases will give way to average increases.
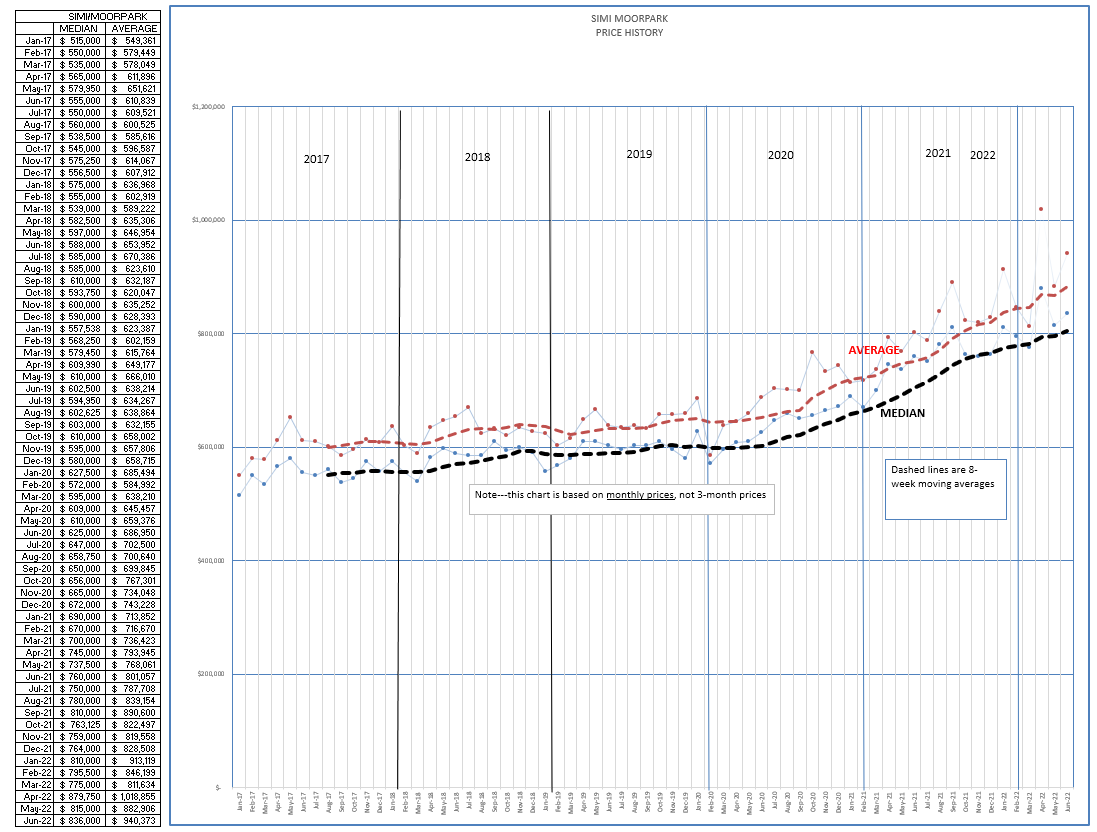
For Simi/Moorpark, the distance between the two lines has been increasing due to the strong sales of properties priced above $1 million. Considering the rapid growth in active inventory, I forecast these to also begin to level out.
So, that’s what I think will happen. The charts represent history, they are accurate, the past is locked in and recorded.
Based on this history, and your feelings about what the market is doing today, what do you think is going on? Please let me know, I value your thoughts.
Stay safe out there. Covid does not seem to be ready to die, it is very persistent.
Chuck