The FED wants the economy to slow down. They are using their #1 tool, interest rate increases, to slow the economy down. Use of that tool particularly affects the housing market. Before we see how housing is doing, let’s look at some measurements of the economy.
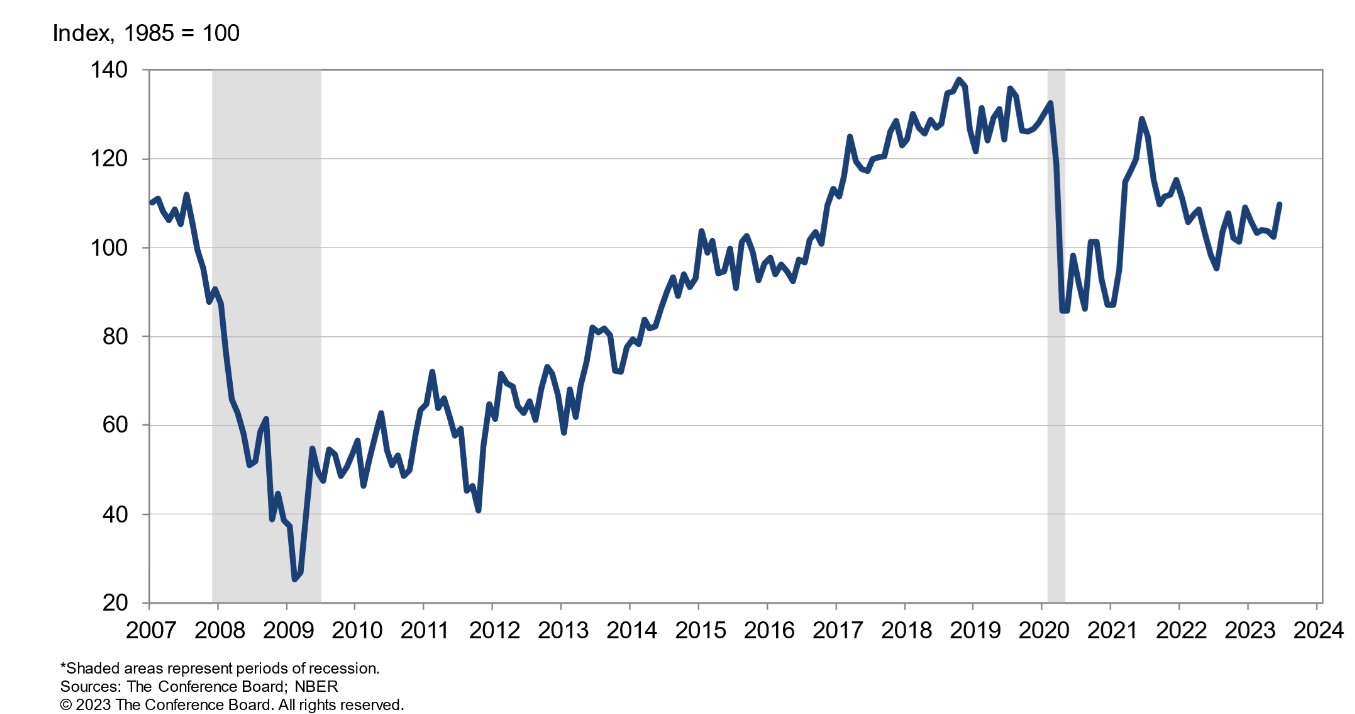
First, consumer confidence. With all the news in print, and the FED forecasting even more interest rate increases, the news would logically cause consumers to worry about the strength of the economy. So how it that going? See below, consumer confidence remains very strong. Consumer spending makes up the largest contributor to GDP, 68% last month compared to the long term average of 64%. The economy continues strong.
Consumer Confidence Index:
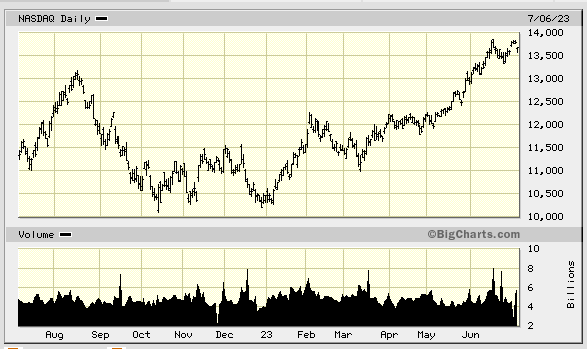
The stock market is consistently a leading indicators. It foretells what the economy will be doing in the near future. The FED is concerned with the future, not just the present. So how is that going? Both the Dow Jones and Nasdaq charts sure look strong over the last year, a year of tightening by the FED. Even though the FED doubled interest rates over the past 12 months, the tightening seems to be ignored by this leading indicator.

A recession is classically defined as two consecutive quarters of declining GDP. So how is that going? The FED began raising interest rates in Q3 of 2022. According to this classic definition, they raised rates right after a recession occurred. That should have punctuated and extended the recession. Since raising rates last year, the GDP has been performing decently.

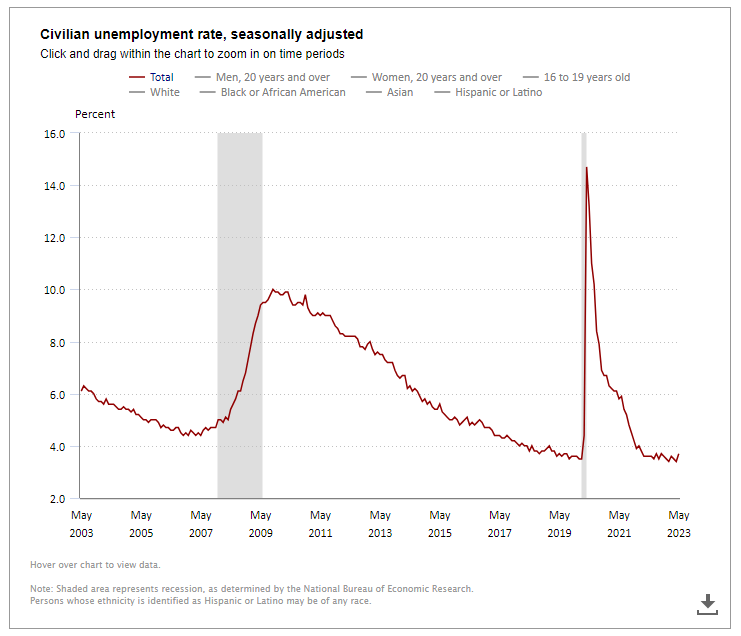
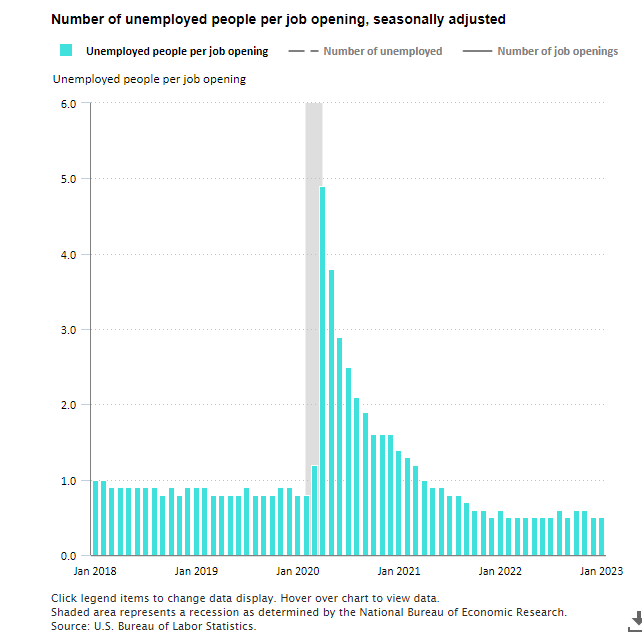
One of the unfortunate consequences of the FED’s effort to control inflation has to do with job losses, fostering job losses and people out of work. So how is that going? The unemployment rate remains at historic lows. And there are twice the number of job openings as there are people looking for jobs.
One final indicator we should talk about is the inversion curve. This occurs when the shorter term 2-year treasury bond has a higher yield than the 10-year treasury. In normal times, the longer term you borrow money, the higher the rate, due to unknowns over the longer term. The 10-year is particularly important to us in real estate as it is used by most mortgage lenders to determine mortgage rates. They can protect a mortgage rate over the first 10 years by an investment in a 10-year bond. This inversion is why mortgage rates have fallen recently, even though FED short-term interest rate hikes continue to rattle markets. When short term rates are higher than long term rates, the chart below “inverts” to a minus number. That effectively means mortgage rates can go down even though FED short term interest rates are going up.
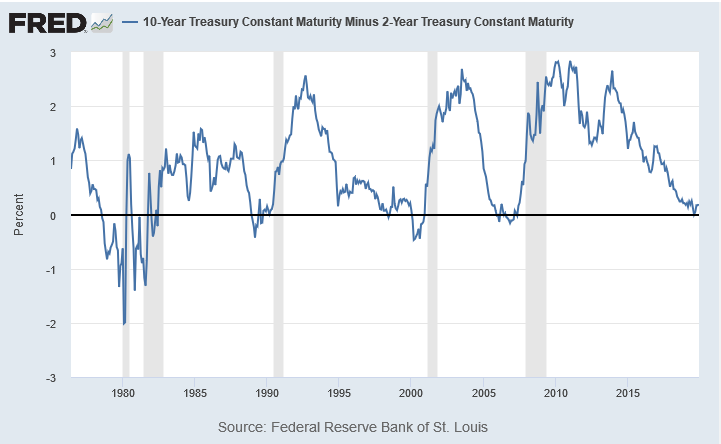
This is both good and bad news. A yield curve inversion has been a reliable signal of upcoming recessions. The 2/10 year yield curve has inverted six to 24 months before each recession since 1955, according to a 2018 report by researchers at the San Francisco Fed, offering only one false signal in that time. ( It is not a perfect predictor.) If we go into recession, that is bad news. But the inversion also means mortgage rates have not followed lockstep with the FED increases. In reality, mortgage rates have come down in recent months.
In summary, even though the FED has been pouring cold water onto the economy, economic fires continue to burn strongly.
Warning—The FED is not done.
Enough general economic discussion. Now to our local real estate market.
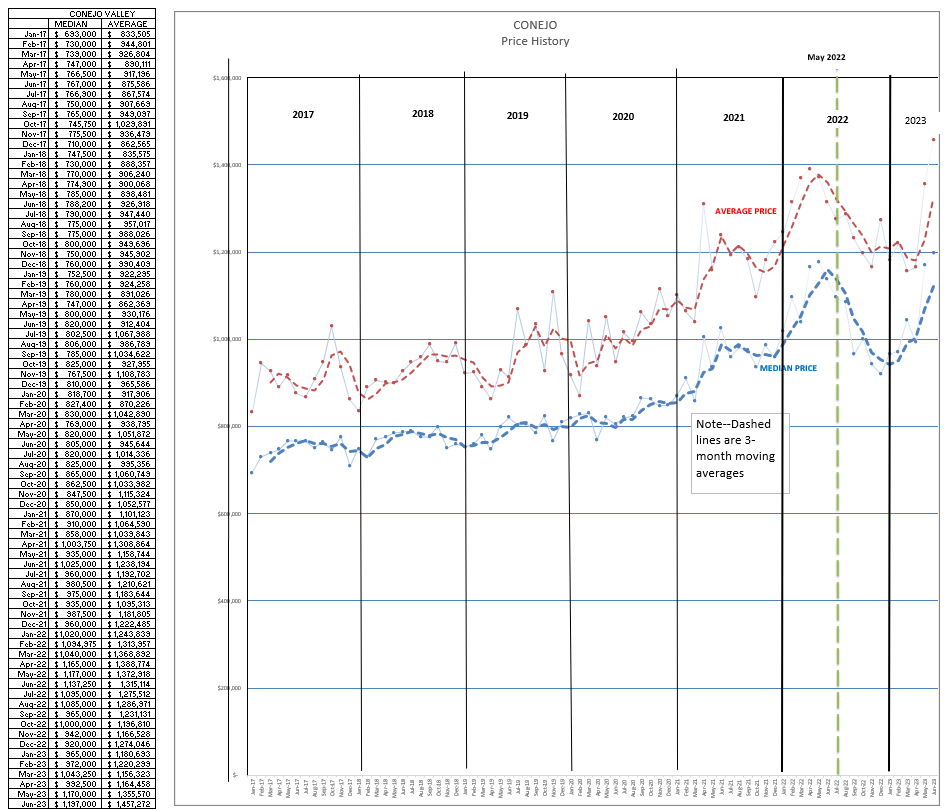
Our housing market shows pricing continue to be strong. Even though the FED doubled interest rates, causing monthly housing payments to nearly double, home prices have not tanked. Recently they have gone up. Conejo prices did drop significantly mid-2022 (the green dashed line) as the FED began tightening. It is important to look at what prices did during the entire course of 2022. Prices did rise significantly in the first half of the year, but then receded by year end to the level at which they began 2022. Prices both rose and fell in 2022. Since the beginning of 2023, prices have been rising strongly. The median price in Conejo is over $1.1 million.
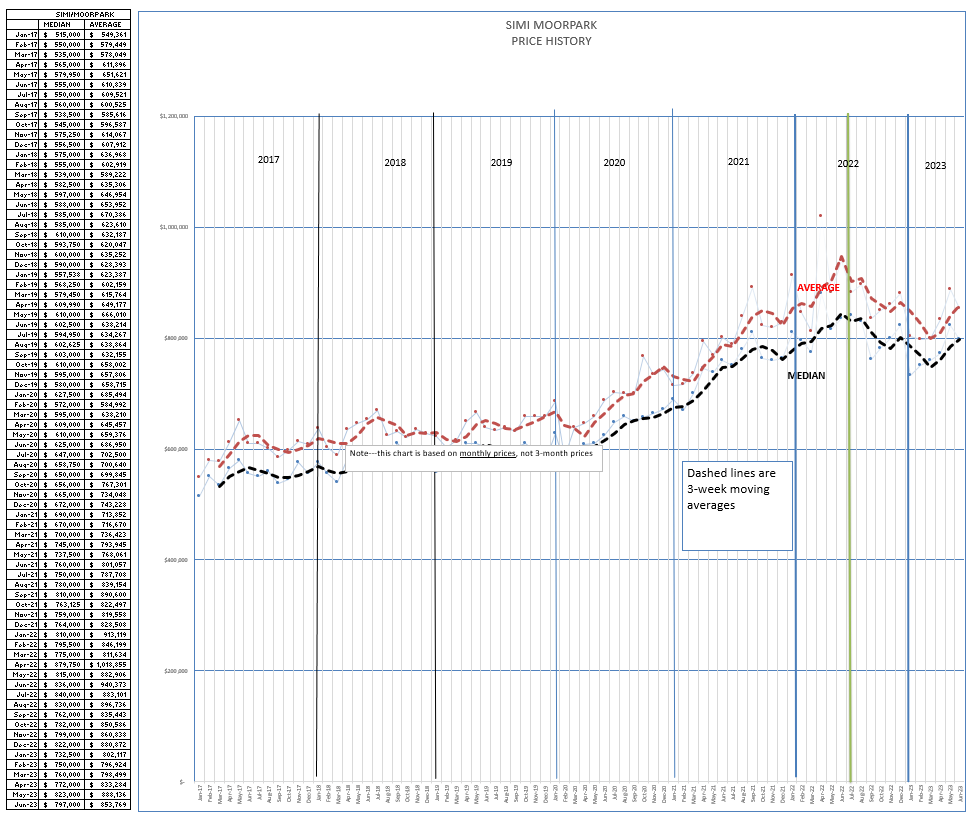
The same for Simi Valley/Moorpark. Prices in December 2022 returned to the level of prices in January 2022, after going through a strong increase and then a similar decrease during the year. The median price in Simi Valley/Moorpark is around $800,000, a little higher than both the beginning and end of 2022.
Why is this happening? If the FED is so powerful and has increased interest rates so strongly, why haven’t home prices dropped?
One word—INVENTORY.
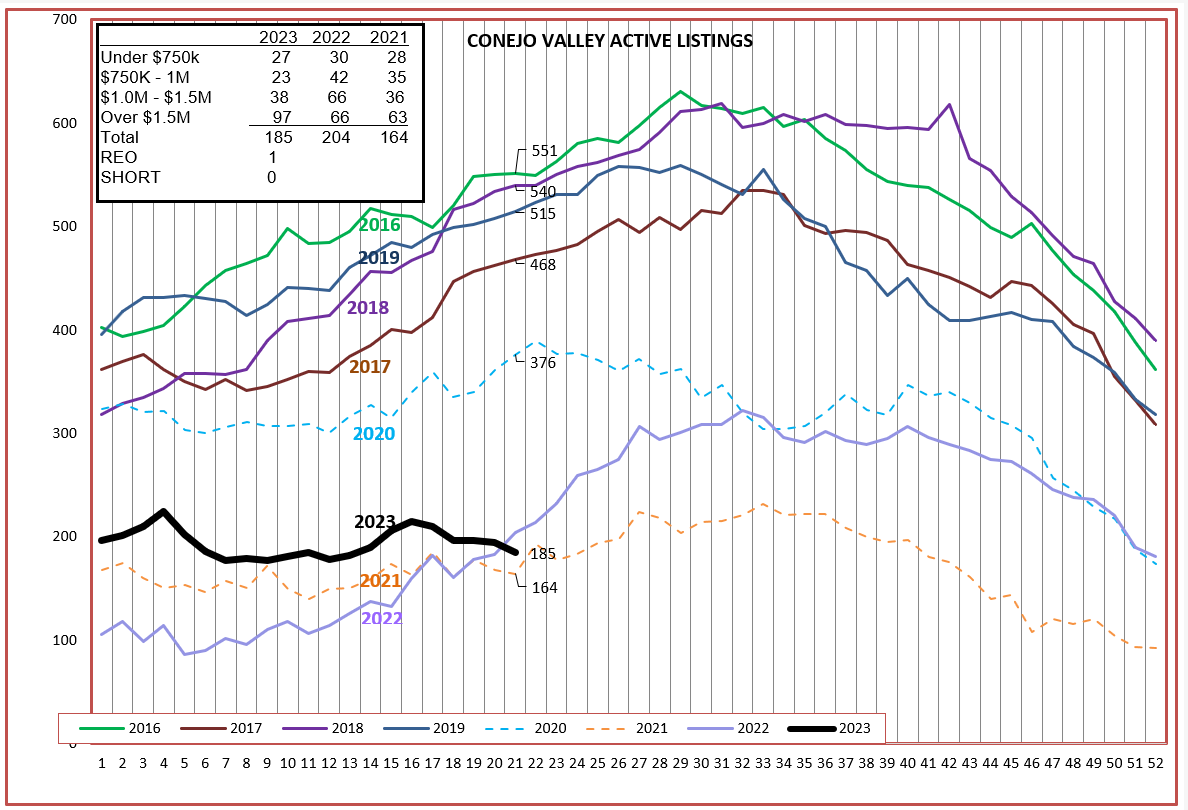
The active inventory in Conejo is at the lowest level reached in the past 8 years. The number of homes on the market was extremely low during the COVID years of 2021 and 2022, around 200 homes on the market at any time. Compare that 200 homes to the years 2016-2020, around 500 active listings at this time of the year. Look at the box within the chart, and you will see that 50% of current listings are over $1.5 million, a large increase over 2021 and 2022. There were 180 home sales YTD in this price category for 2023, versus 293 for the first 6 months of 2022. Our highest price homes are taking longer to sell and they are not selling as well as they did last year.
There are only 50 homes available priced below $1 million in the Conejo.
For Simi Valley/Moorpark, the inventory situation is worse than the low inventory years of 2021 and 2022. Only 61 active listings priced below $1 million, versus 142 listings last year.

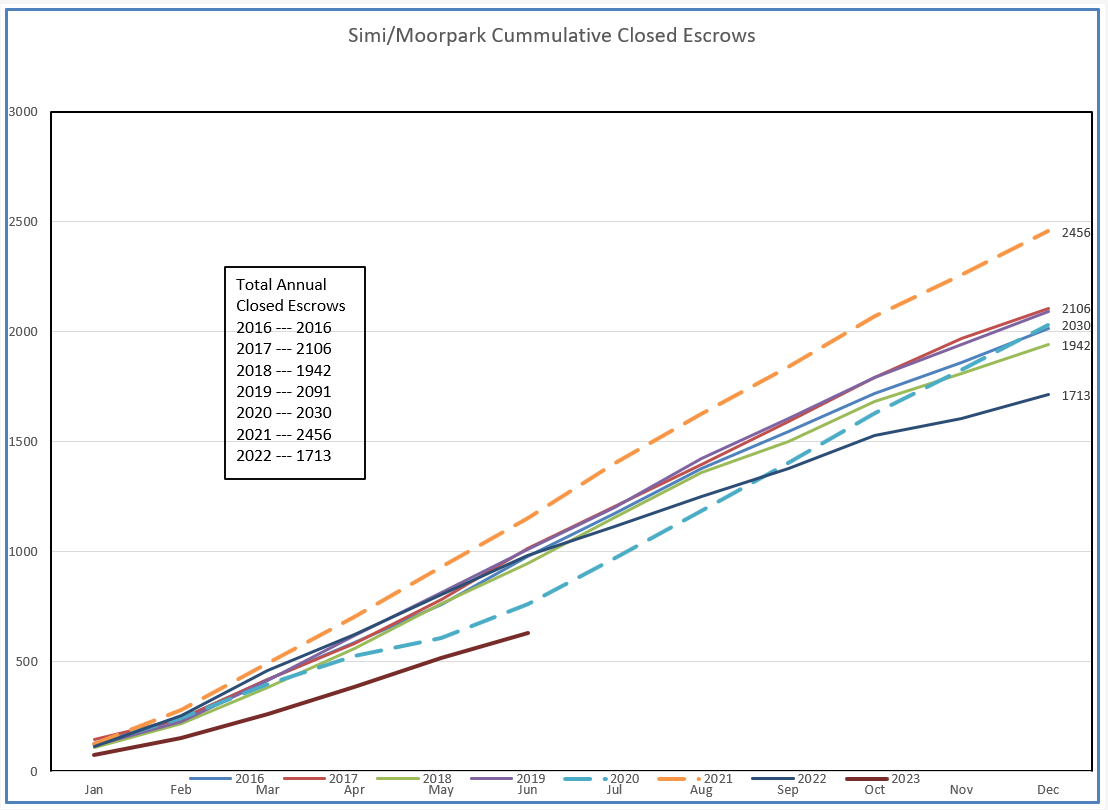
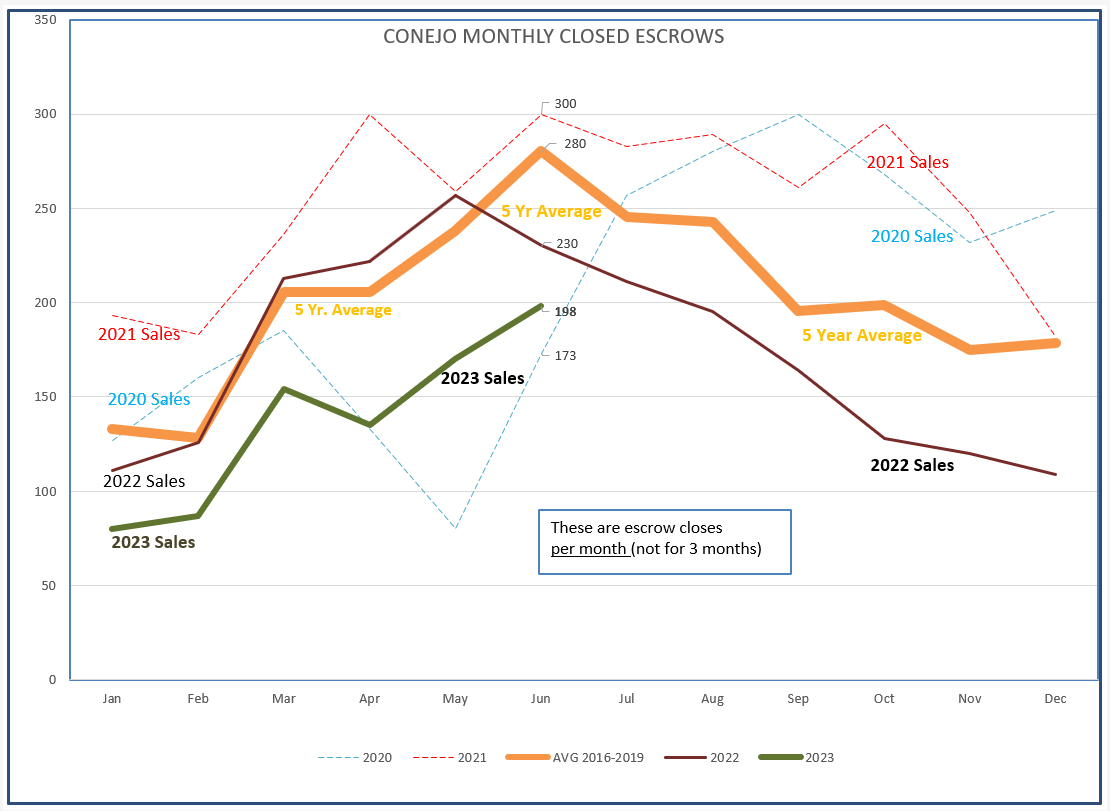
Low inventory means more competition and higher prices. But low inventory also means fewer sales. The graphs below display the total number of sales as the year progresses. We are headed for a comparatively low year. Home prices are strong, demand is strong, but without inventory the total number of sales this year will be restricted compared to previous years.
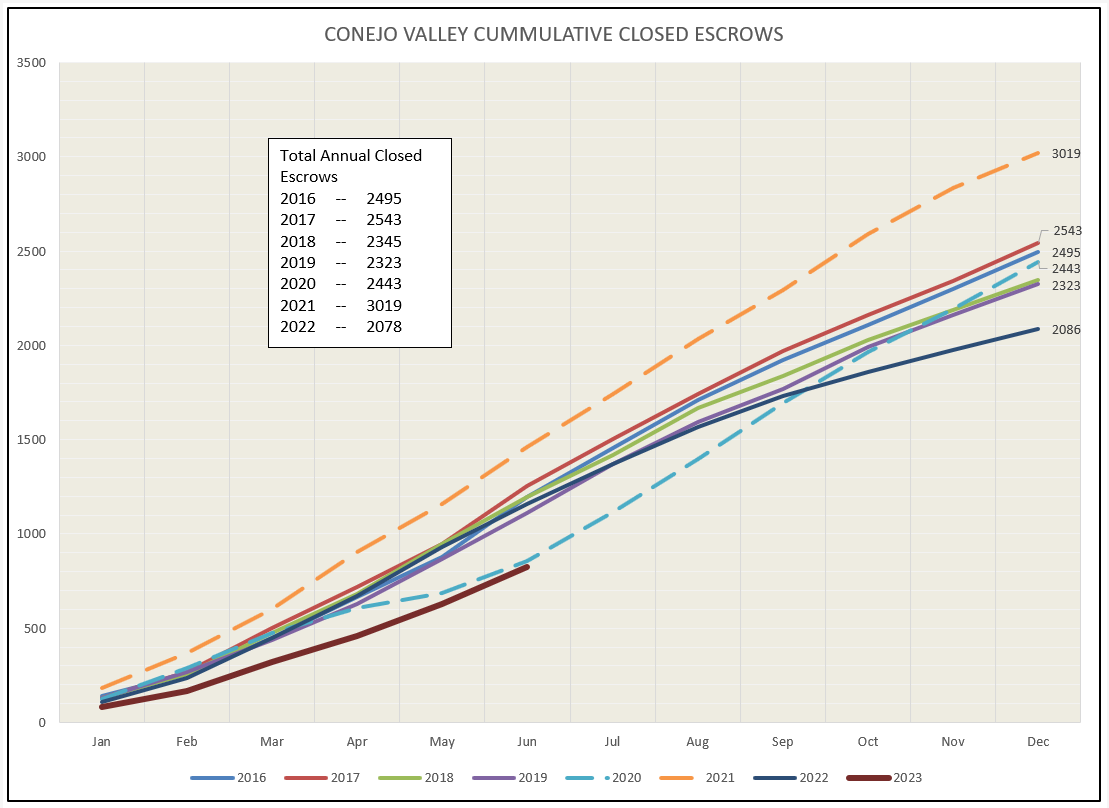
Looking at closed sales in a different way, Conejo sales are following the path of the 5-year average (orange) but this year will be far from normal due to the lower level of sales. However, it is satisfying to see a “normal” curve.
For Simi Valley/Moorpark, sales would to the level of normal (orange) if only we had more inventory.

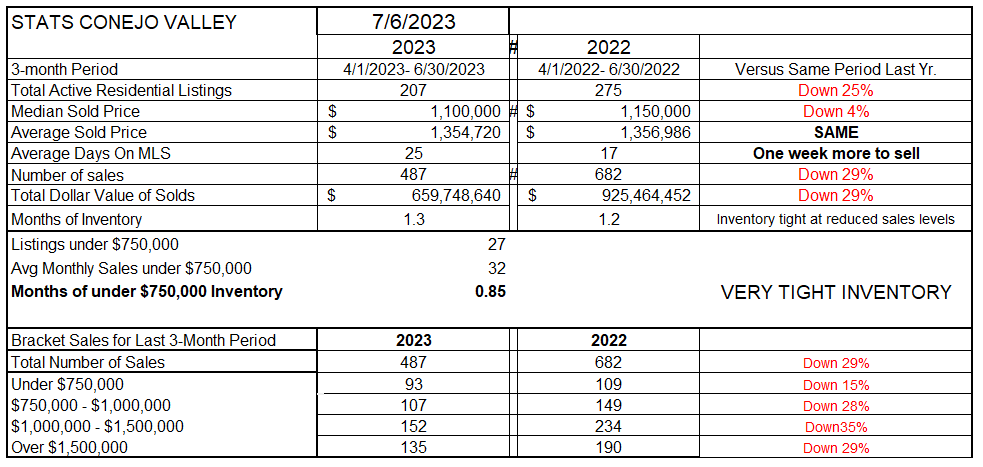
Finally, let’s review the annual comparison tables, the past 3 months this year versus the same 3 months last year. Inventory is down 25% from last year. Median prices are down 4%, average prices the same. Listings do take one more week to sell on average. The number of sales during this 3-month period is 29% lower than last year. Inventory remains very tight at 1.3 months worth of current sales levels. In our area, a normal inventory would be closer to 3 months worth of sales, which is why we still have a seller’s market.
For SImi Valley/Moorpark, inventory is 33% lower than last year. Prices are rising since the beginning of 2023, but have not caught up with the same months last year, prior to the decline in late 2022. The number of sales is down 28%, and listings take a week longer to sell. Even based on fewer sales, the inventory is so low it only represents 3 weeks worth of sales.

Sales levels this year have been lower, down almost 30% from “normal” levels. That is challenging, as more agents compete for fewer sales. The consumer is oblivious to that pressure, since prices and demand are very strong.
I began this report viewing the current economic factors in light of the FED pressures to slow down the economy. Those pressures continue. We are in a precarious economic time. Even though consumer confidence is high, economist confidence is not. The FED is continuing to provide pressure to slow down inflation and the economy. I personally find it surprising that demand has remained this strong, given that borrowing costs have gone up substantially. It shows that people believe in homeownership and the value of homeownership to create wealth.
Prices remain high because we just don’t have enough housing.
Stay safe out there.
Chuck