I have said that time and time again to my agents. Our clients are interested in the national housing market, but they are REALLY interested in what that house down the block sold for.
Last week, I attended an economic forecast done by CLU’s CERF (Center for Economic Research and Forecasting). Dr. Matthew Fienup was joined by Danielle DiMartino Booth to begin with a national perspective and then drill down to Ventura County. As part of her presentation, DiMartino Booth included the following graph from C.A.R:
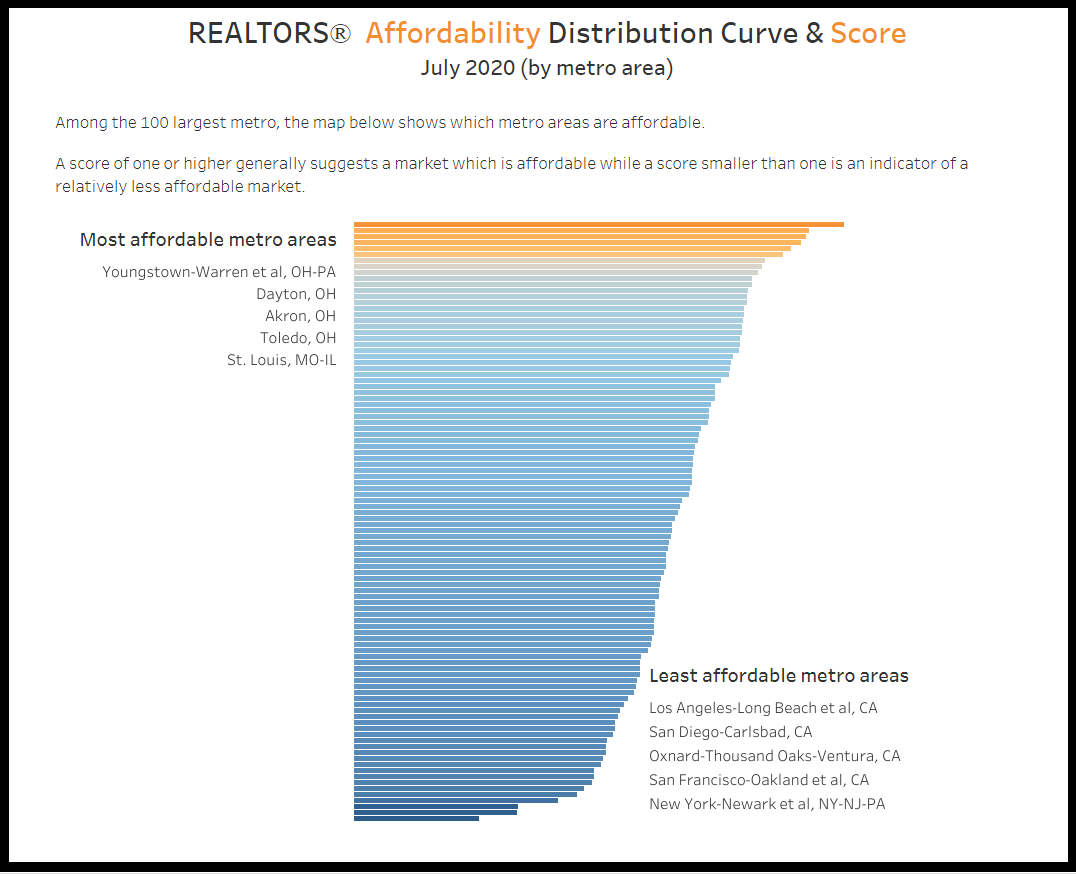
This shows the metro area of Oxnard-Thousand Oaks-Ventura to be the third least affordable area in the entire country, behind New York and San Francisco, and followed by San Diego and Los Angeles. This is a July 2020 survey, I was unable to find a more recent survey.
Translation: Based on home prices versus the average income of residents of our community, we are in a very unaffordable place to live.
If you have equity from previous home ownership, or you have an exceptional income, you can afford to live here. However, if you do not, you cannot. Notice that metro areas like San Jose are not included in the least unaffordable list. Their housing costs are very high, but so are their average incomes.
We have a shortage of places to live. Not just a shortage of homes, but a shortage of apartments and rental units. Some of those units are currently in the process of being built, or at least in planning. A fairly short but extremely good analysis of why we have a housing shortage was recently offered by Tim Freund here. When you have more consumers chasing fewer available items, prices increase. (Economics 101)
In this case, the fewer items is represented by the available housing inventory.
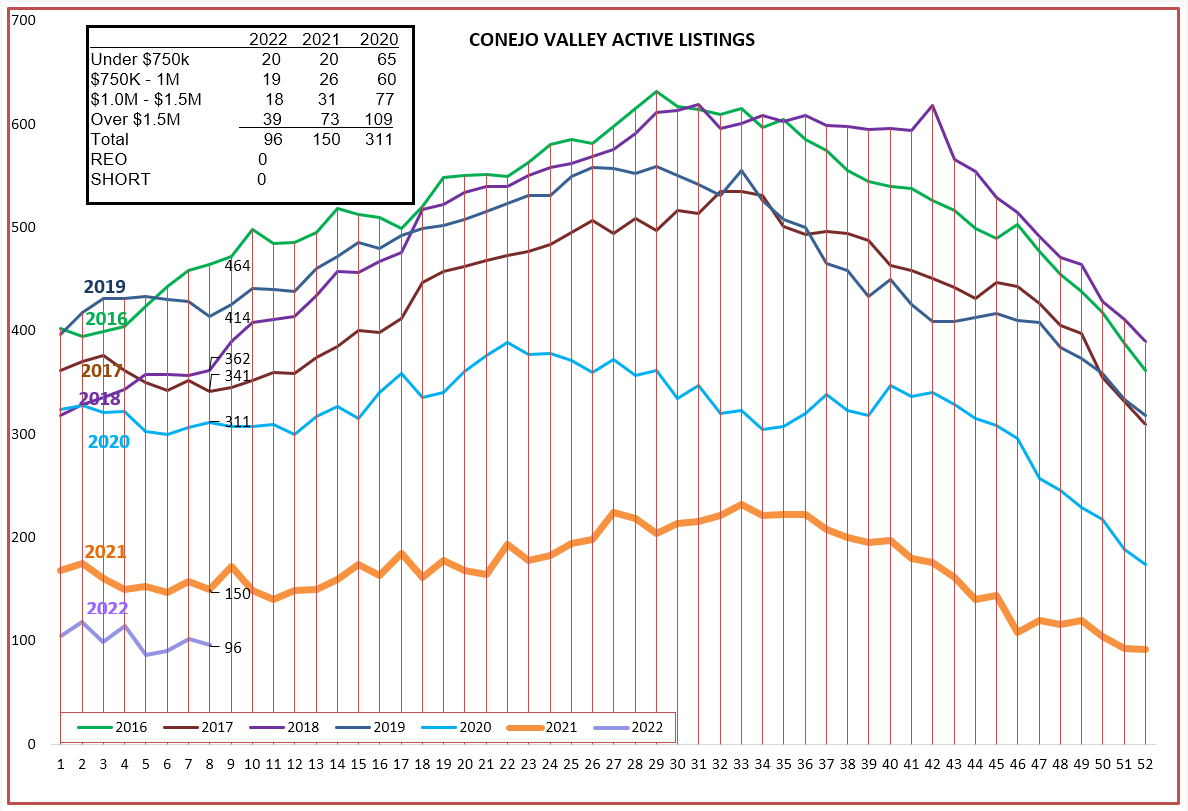
In the Conejo, the inventory remains at a historic low. In 2021 Conejo had a very low inventory, but now the inventory is only 2/3 of 2021.
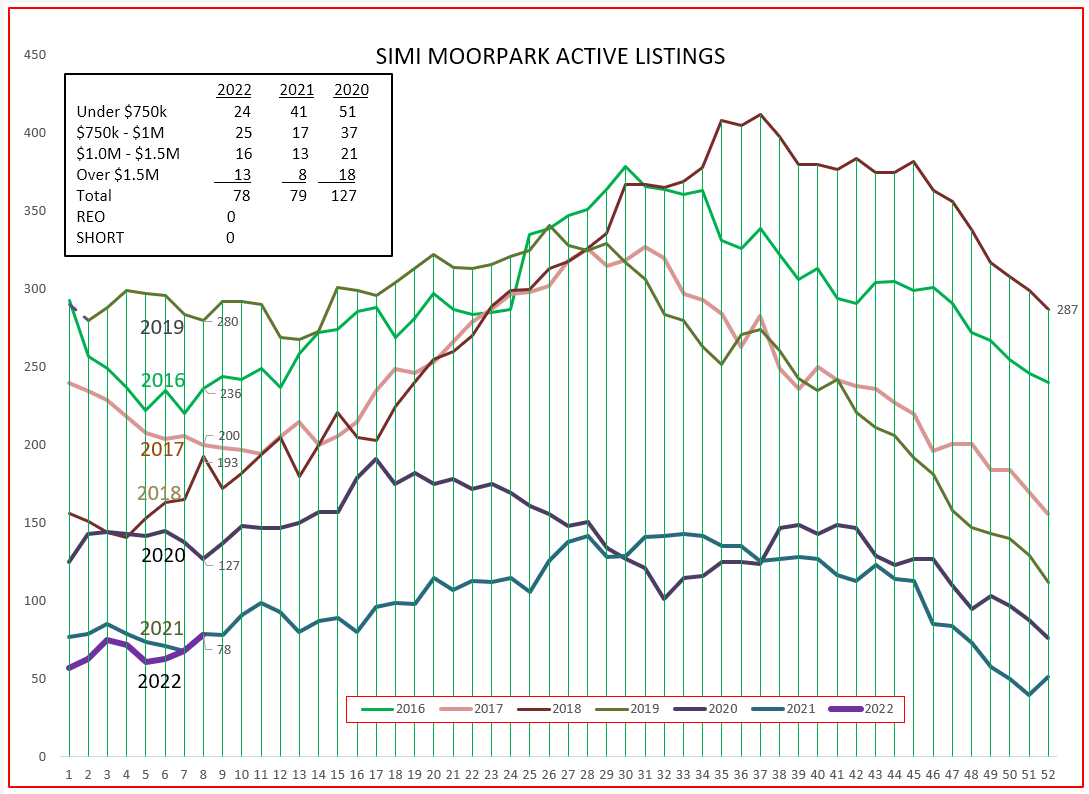
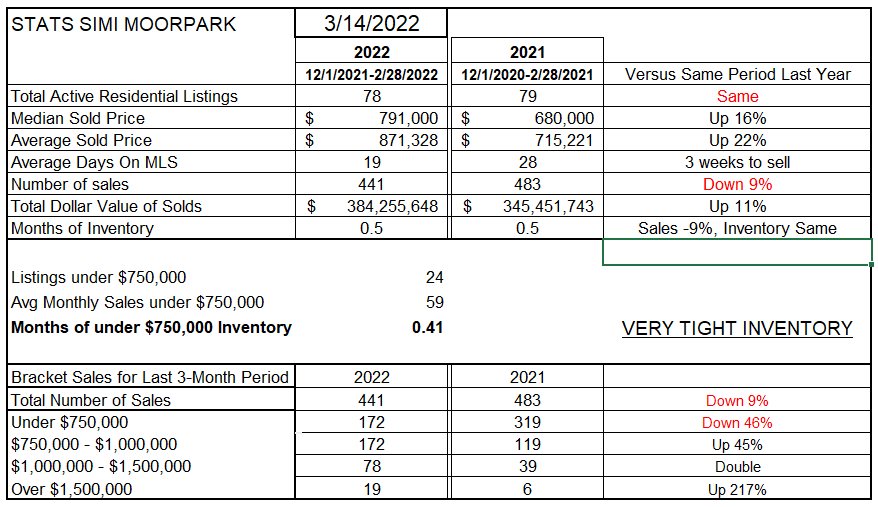
In Simi/Moorpark, the total inventory number is even lower, yet it is the same as last year. Simi/Moorpark has had an inventory problem longer than Conejo. The inventory in both 2021 and 2022 is 2/3 the inventory in 2020. Very little inventory, almost no inventory.
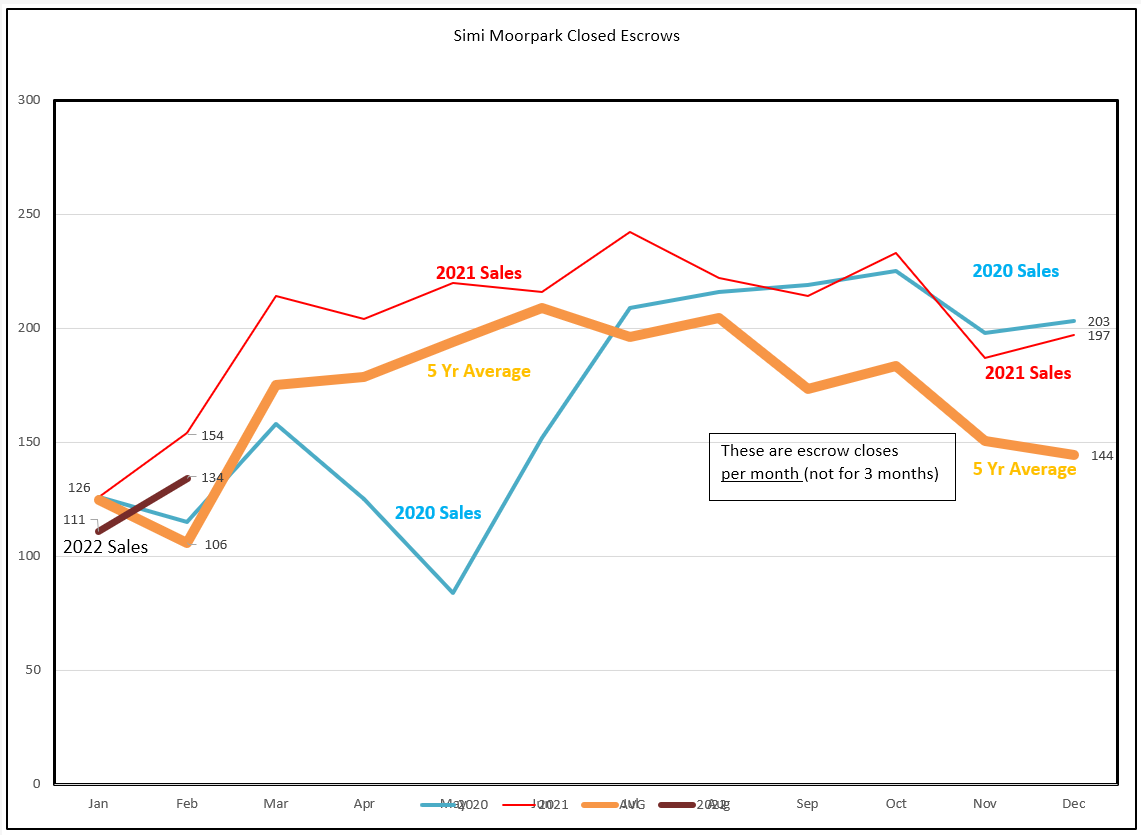
But what of the demand? We can find an indication in the Closed Escrow Chart. For Conejo, closed escrows are at historical lows. Would closed escrows be higher if we had more inventory? Yes, they would. But the inventory is unavailable, therefore prices are rising strongly. In two months, only 237 closed escrows. The first two months of a year are usually low, as seen by the orange 5-year average chart. Will the closed escrow chart rise strongly as it usually does? No. Because inventory is unavailable. The inventory was all used up during 2021.
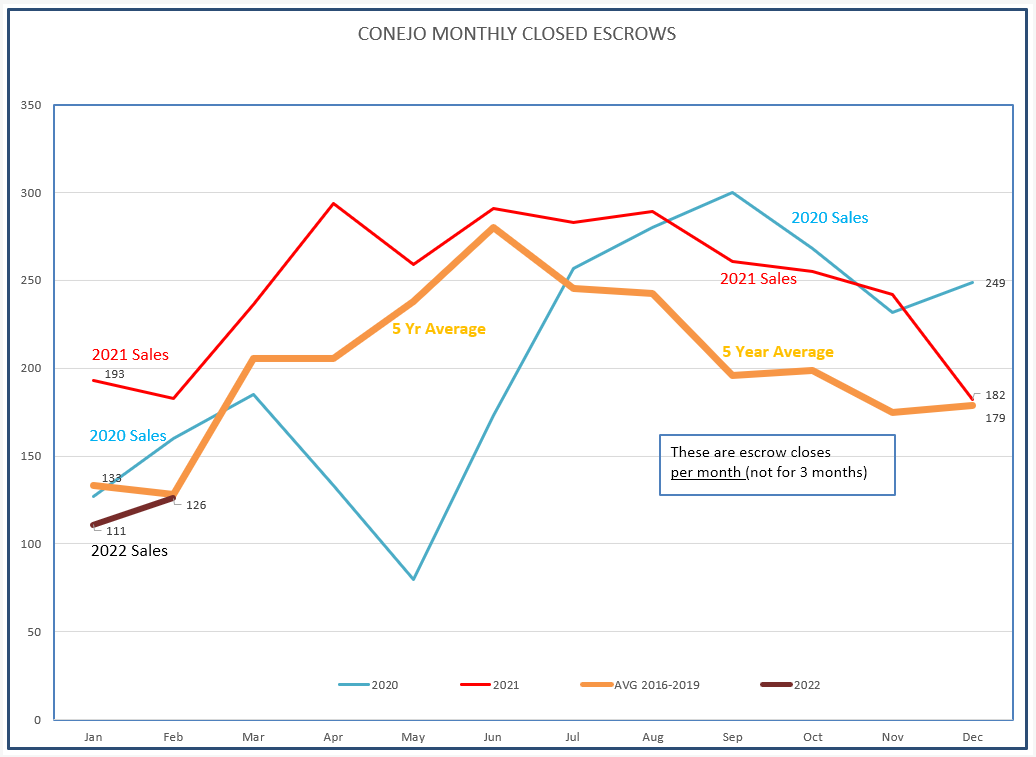
For Simi/Moorpark, in two months, only 237 closed escrows. The exact same number as Conejo. Conejo, with more total homes in the marketplace, slowed down more than Simi. Price had an influence, average and median prices in both valleys rising significantly, making housing less affordable.
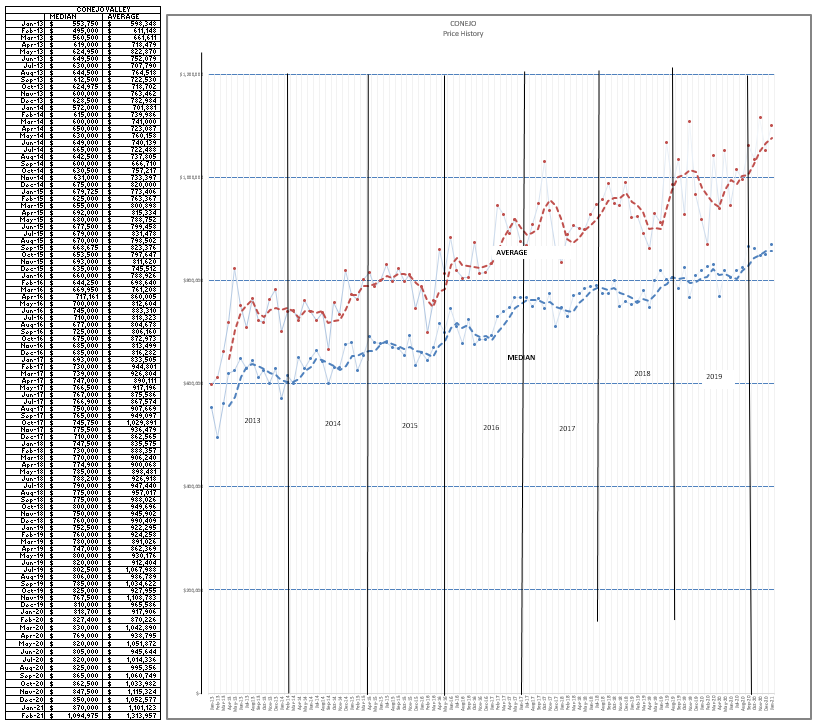
The price chart for Conejo is below. Recent prices (prices for only the most recent month) are leading the median and average price dotted lines even higher. Median Prices far exceeded $1 million, Average Prices exceeded $1.3 million.
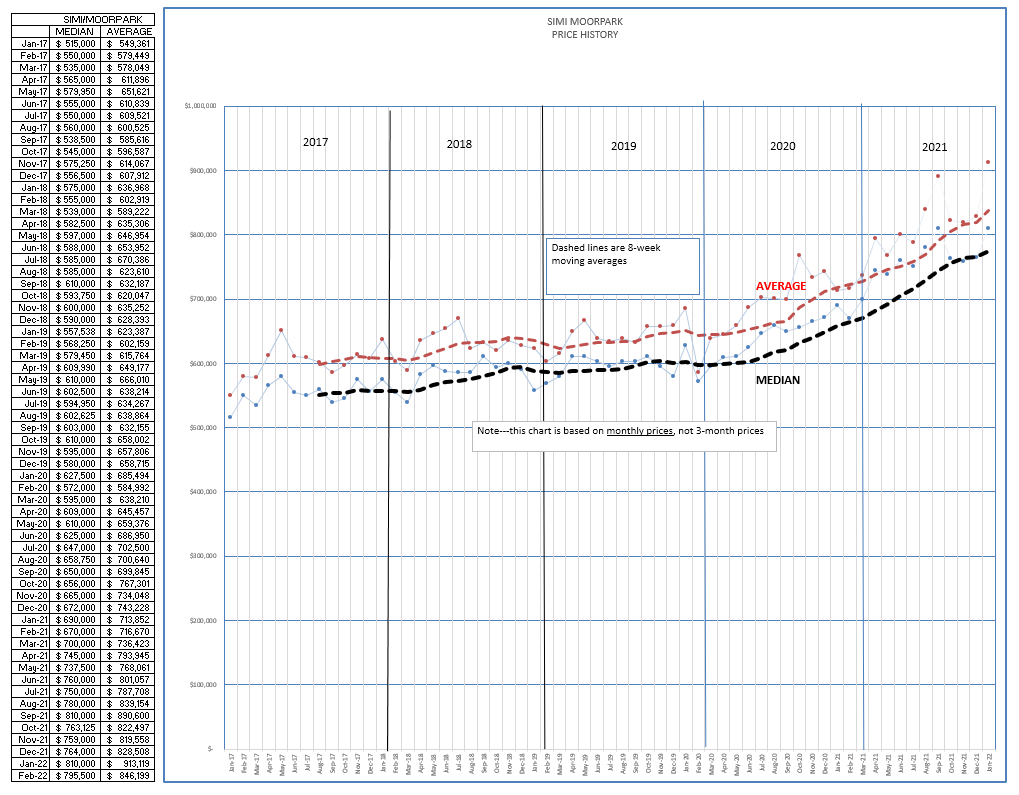
The price chart for Simi/Moorpark shows a Median Price $200,000 lower, at $800,000, while the Average Price is heading towards $900,000. Since Simi/Moorpark is more affordable, their sales numbers are stronger, with more buyers able to afford home purchases.
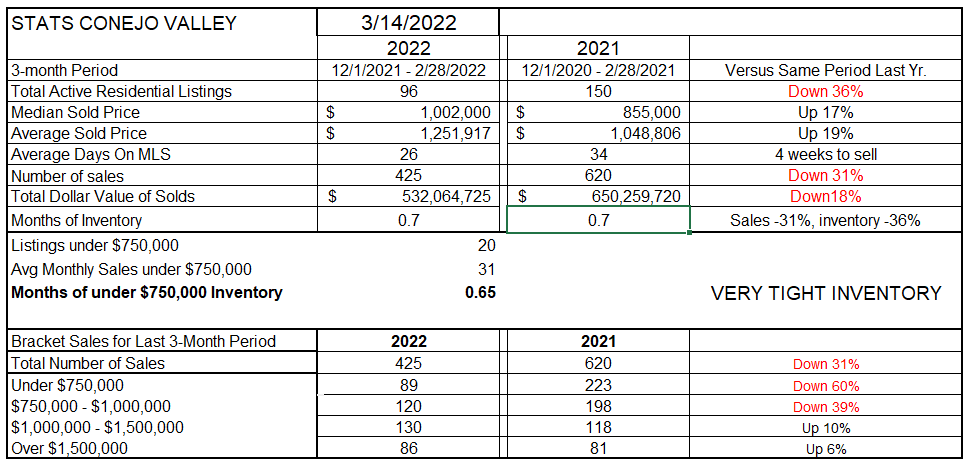
Finally, let’s review the overall statistical chart.
For Conejo, the inventory is down 36% from a year ago. Prices are up 17% for Median and 19% for Average, (or you might say 18%). In one year. And still going strong. Has this affected the number of sales? Certainly. For the three-month comparison this year versus a year ago, sales are now down 31%. Months of supply remains the same at 3 weeks worth of sales. Because prices have increased so much in the past two years, the bottom of the chart shows that sales of inventory priced in excess of $1 million is up, slightly, while homes priced below $1 million are down much, much more. Much of this is due to the fact that inventory is just not available, and homes are no longer easy to find in the lower price brackets.
For Simi Valley/Moorpark, the very low inventory of 2021 is the same as the very low inventory of 2022. But prices are up. Median prices are up 16% and Average prices up 22%. Although the inventory is the same as last year, sales are still lower by 9%. Why? Because prices are higher.
Are prices continuing to increase? Yes, but sales have slowed. Mortgage rates have increased, and will likely be increasing further.
I believe we are at a turning point. As homes get more expensive, as increasing mortgage rates make payments higher, as we see California residents as well as Ventura County residents move to other states and other counties, buying our homes will become more of a challenge and price increases will moderate. Not a bubble, but Economics 101 will remain in charge.
Stay safe out there. It is nice to finally be free of masks, to visit together, and hopefully regain control of our lives.
Chuck