The decision to make long-term investments (a.k.a. buying a home) have been put on hold due to the news being disseminated daily via tweets and the news channels. Everyone is on pins and needles due to speculation about what happens next. A threat to wipe out an entire civilization was followed by claims of victory by both sides when a ceasefire was announced. However, the ceasefire does not seem to be holding, and the two sides have not even sat down together at the table. Some missles continue to fly.
Let’s see what is happening to issues that directly affect real estate.
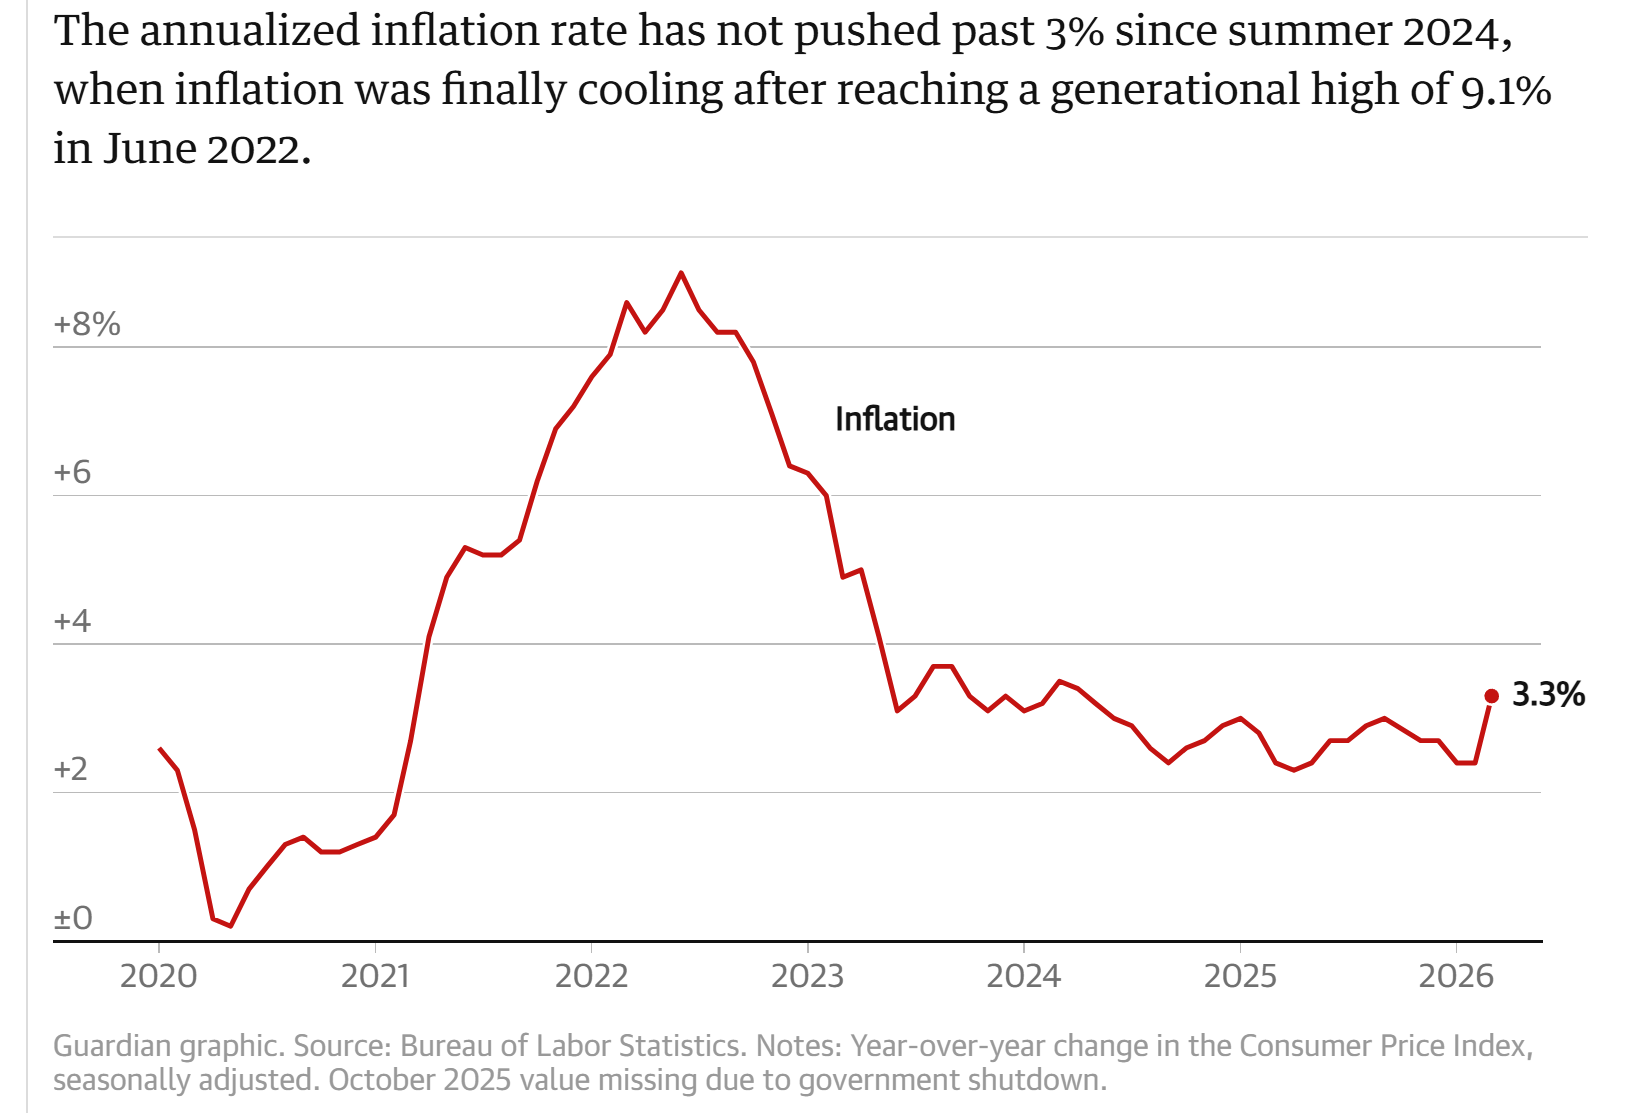
Inflation is increasing and the outlook for a reduction in interest rates is decreasing.
This is the lastest forecast from MORNINGSTAR:
- The March inflation report will likely show a jump driven by higher energy prices, disrupting the moderate rate of growth that has characterized 2026 so far.
- Tariffs are likely to accelerate growth for food and gas prices, further depressing households’ spending power, economists say.
- Analysts widely believe the Fed will keep interest rates unchanged, especially after a strong job report in March.
When the stock market and oil prices can move 3% in a day, depending upon the latest tweet, the points above seems a logical expectation. Yes, tariffs are still in force, pushed way to the back of the news feeds, but still causing inflation. And inflation reduces consumer buying power.
UPDATE. I wrote this blog yesterday, and today the Bureau of Lobor Statistics released the official report. It reported that Consumer prices rose 0.9 percent in March from the month before, the biggest monthly gain since 2022. On an annual basis, prices climbed 3.3 percent, up sharply from 2.4 percent in February. Energy prices drove much of the increase, jumping roughly 11 percent — the largest monthly gain in more than two decades — with gasoline prices posting the biggest single-month spike in the history of the index.
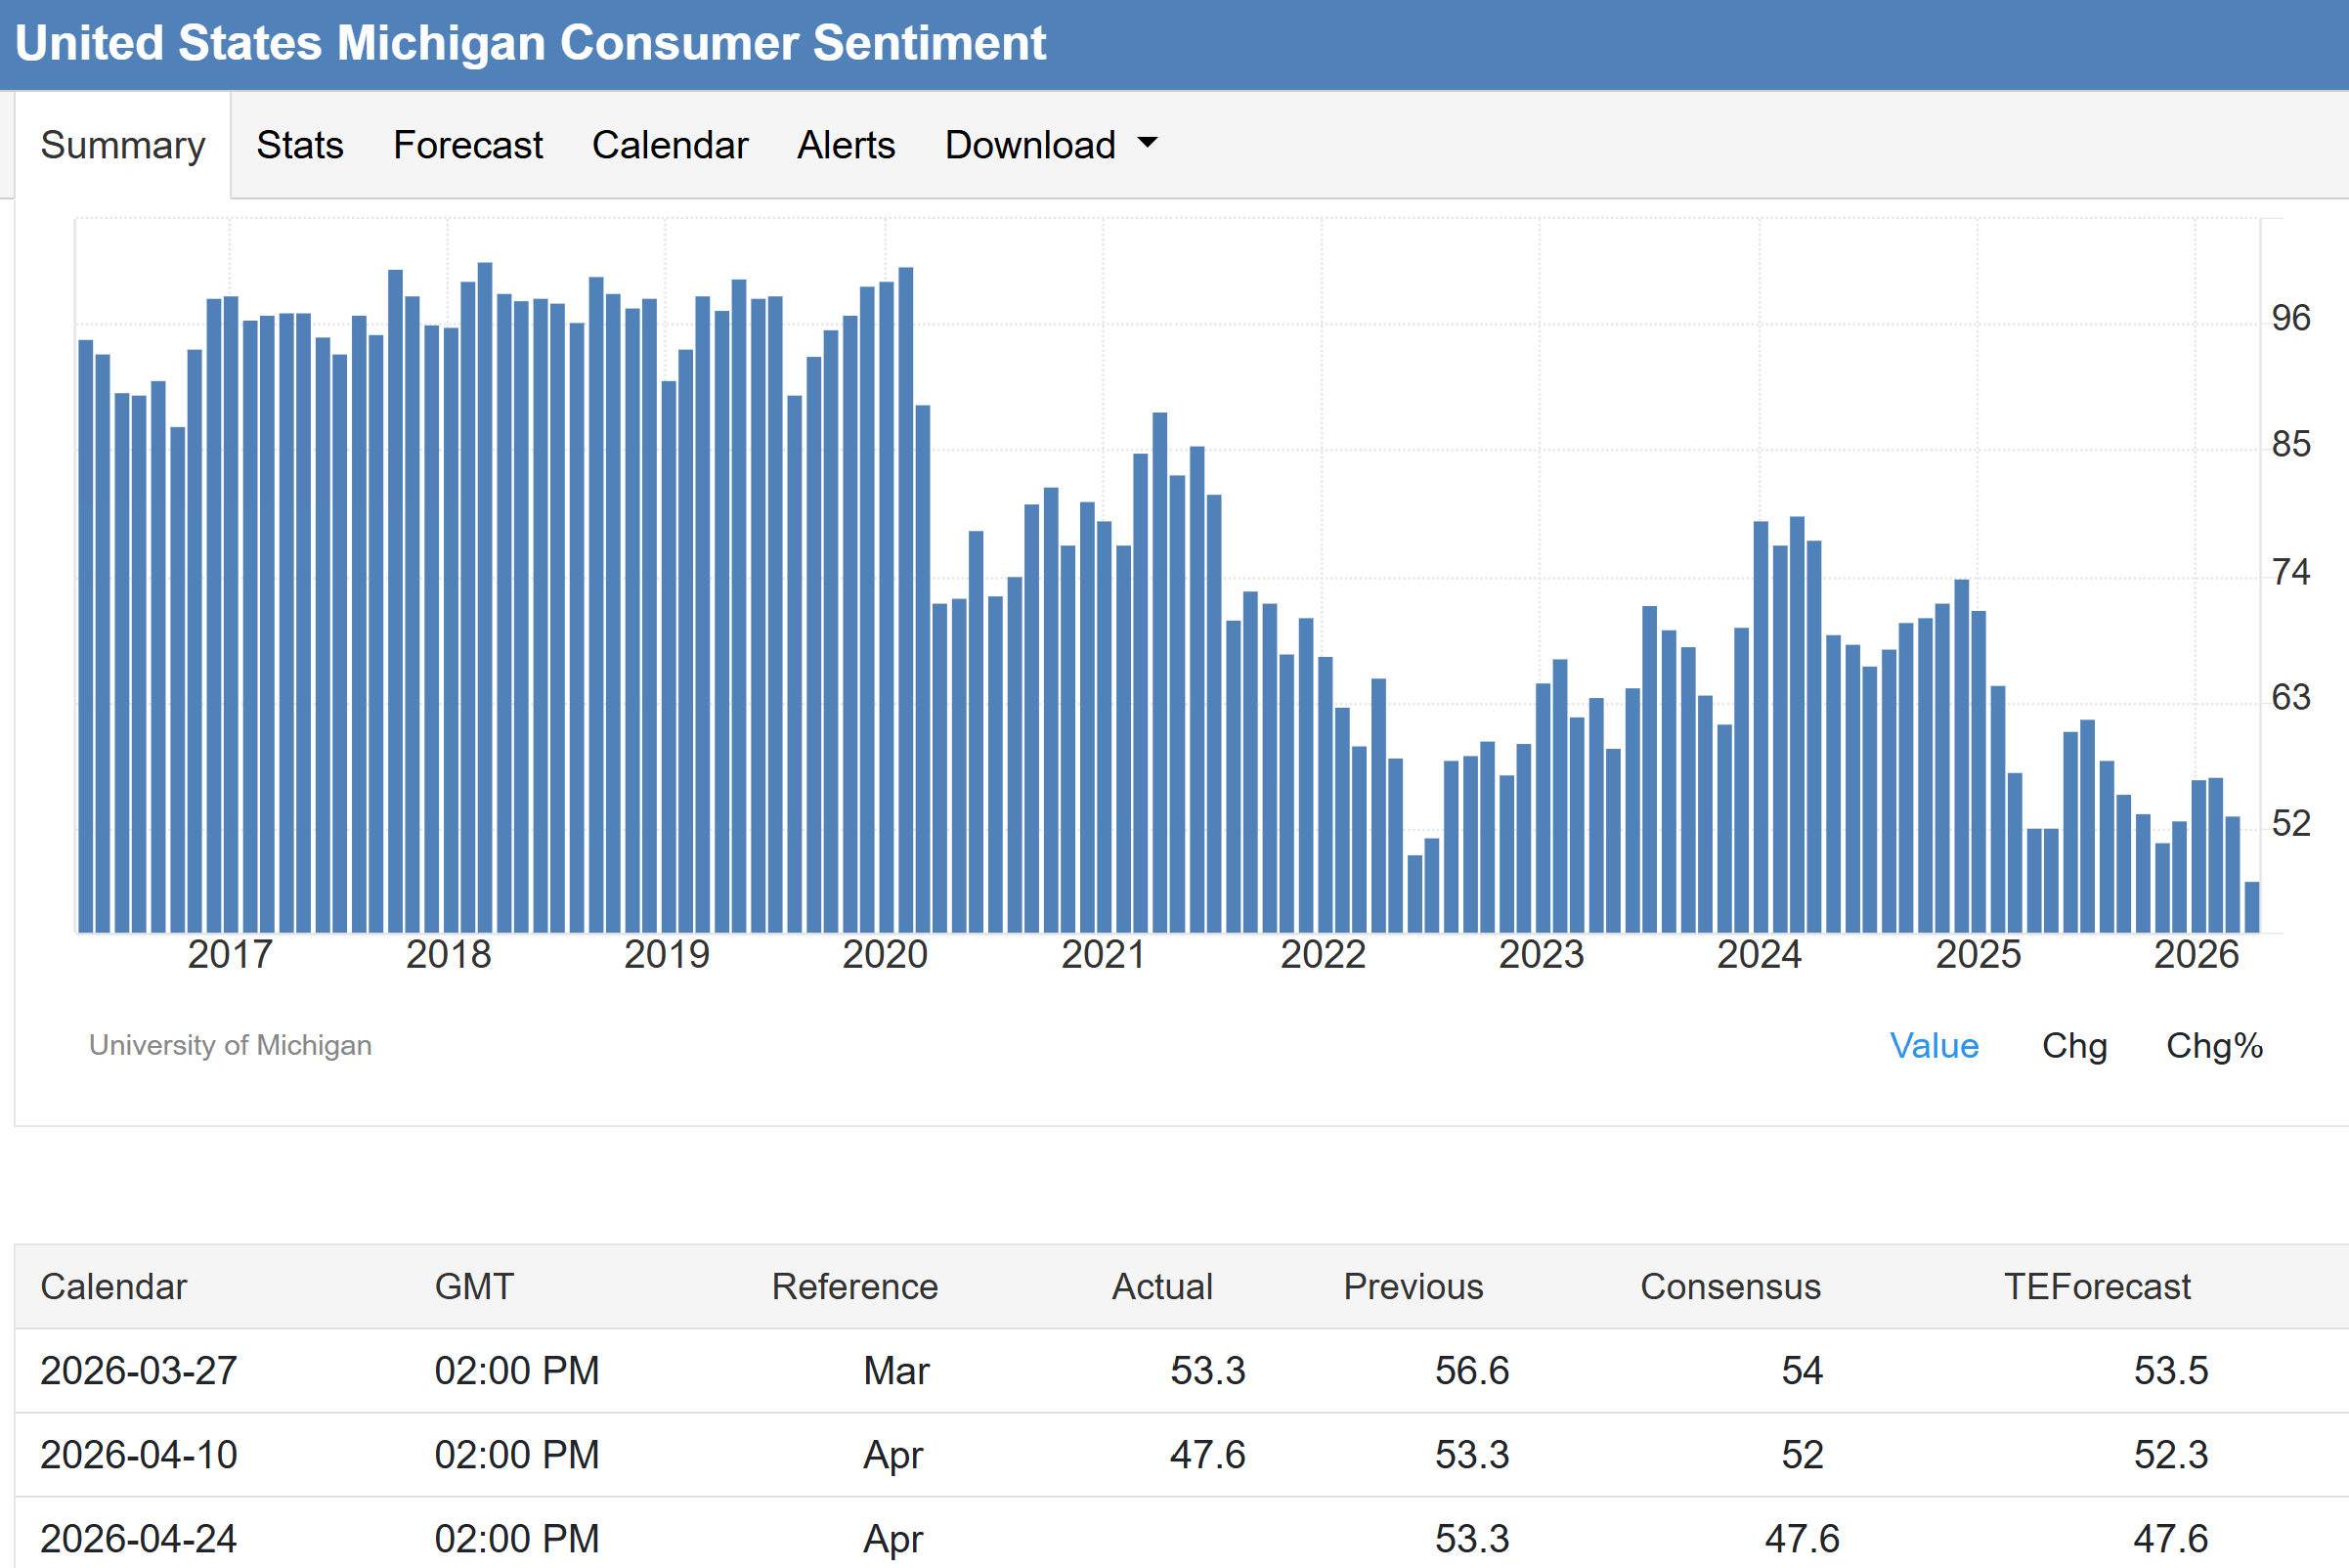
All this uncertainty was measured by the University of Michigan’s Consumer Sentiment Index, which plummeted 11% to a historic low of 47.6 in early April 2026, far below both market expectations of 52 and last year’s level by 9%. Nearly all surveys (98%) were conducted before the temporary ceasefire announcment, underscoring the Iran conflict’s immediate impact on confidence. One-year business condition expectations crashed 20%, while assessments of personal finances fell 11%, with consumers citing rising prices and shrinking asset values as key concerns. Buying conditions for durables and vehicles deteriorated further, again due to high costs linked to the war. Year-ahead inflation expectations spiked to 4.8% from 3.8% in March, while long-term inflation expectations rose to 3.4%.
BTW, when they say historic low, this report has been published since 1946! Consumer Confidence is the lowest in 80 years!
With each passing day, news reports are manipulating consumer confidence like a yo-yo.
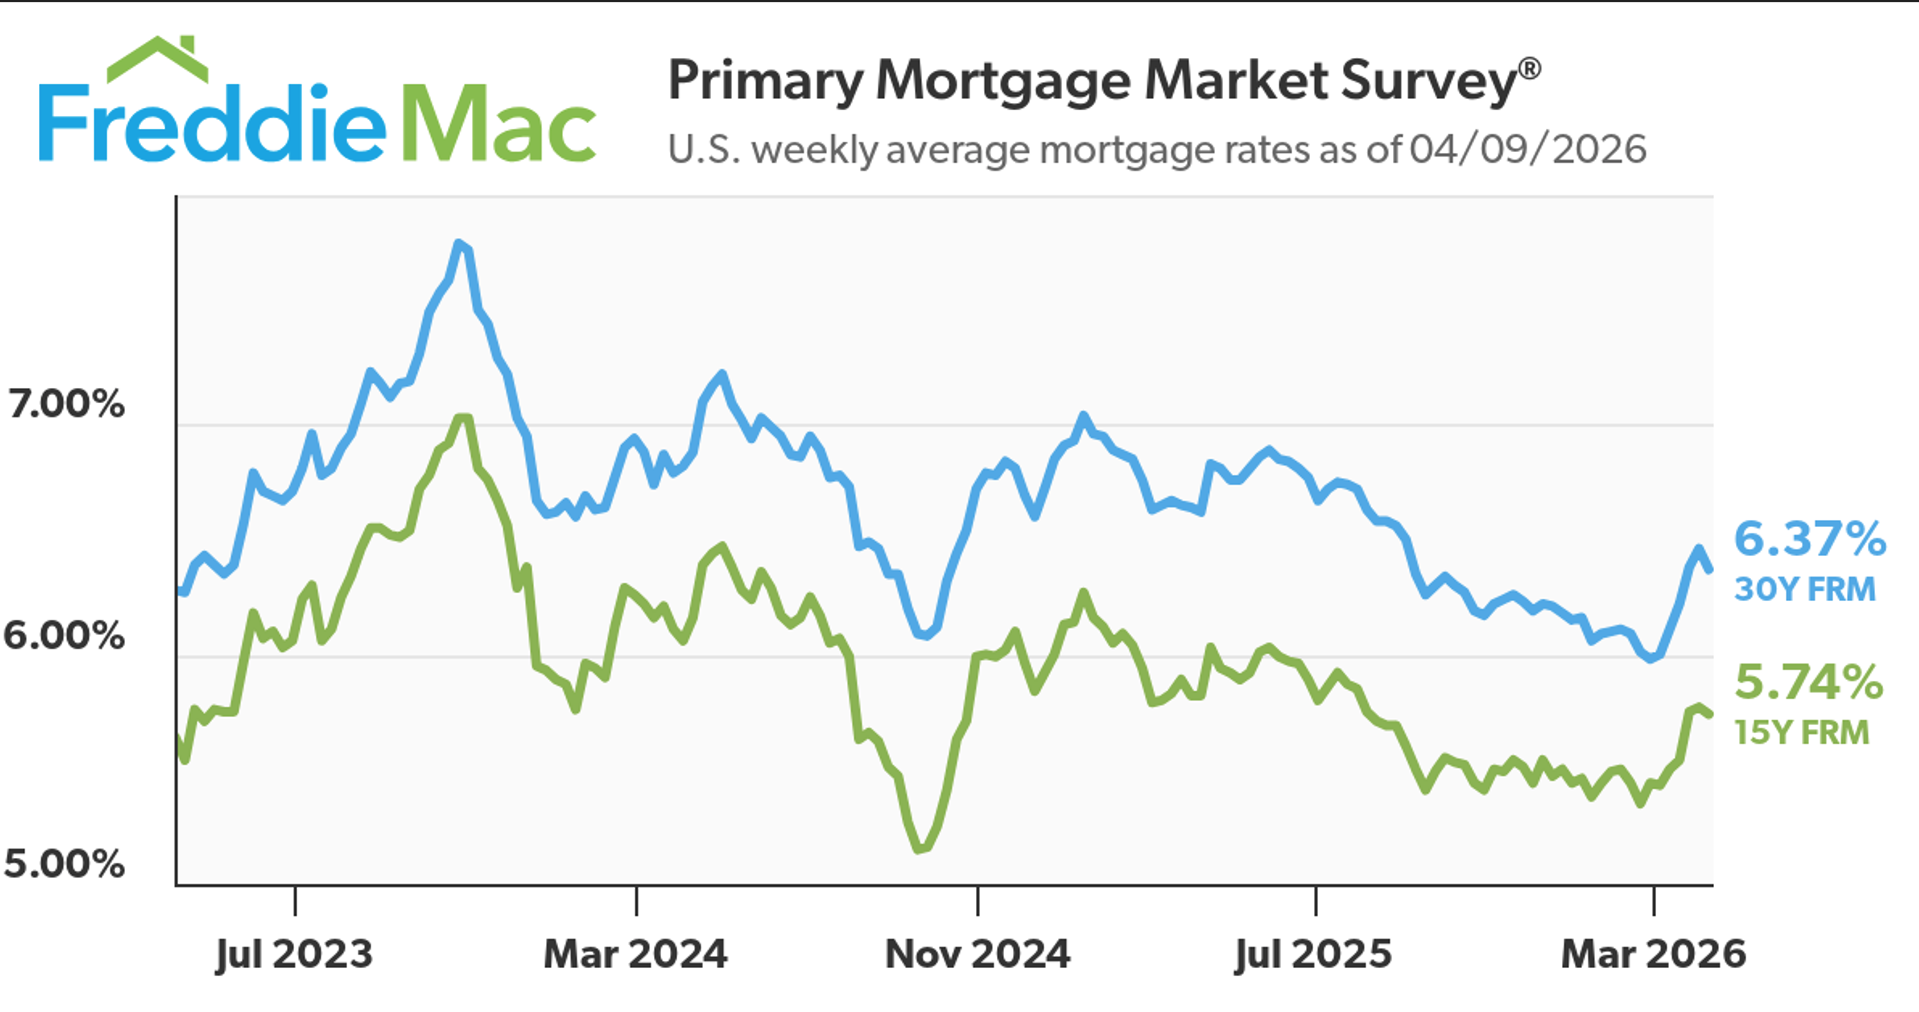
What has this uncertainty done to mortgage interest rates? Rates were trending downward until last month, when rates jumped up, from 6% to 6-1/2%. With news of a ceasefire, there was a slight decrease, just as oil prices decreased and the stock market partially recovered. To continue the comparison, when oil prices rise significantly, supply and demand dictates that less oil will be bought. Similarly, when mortgage rates climb, mortgage applications decrease, fewer purchases take place. There are always life reasons why some need to sell and some need to buy, but those that are considering that decision without strong pressure are sitting on the sidelines.
Let’s look at the tables that show how our real estate markets have been moving in the recent past. The market will never be at a dead stop, but the foot has moved from the accelerator to the brake pedal.
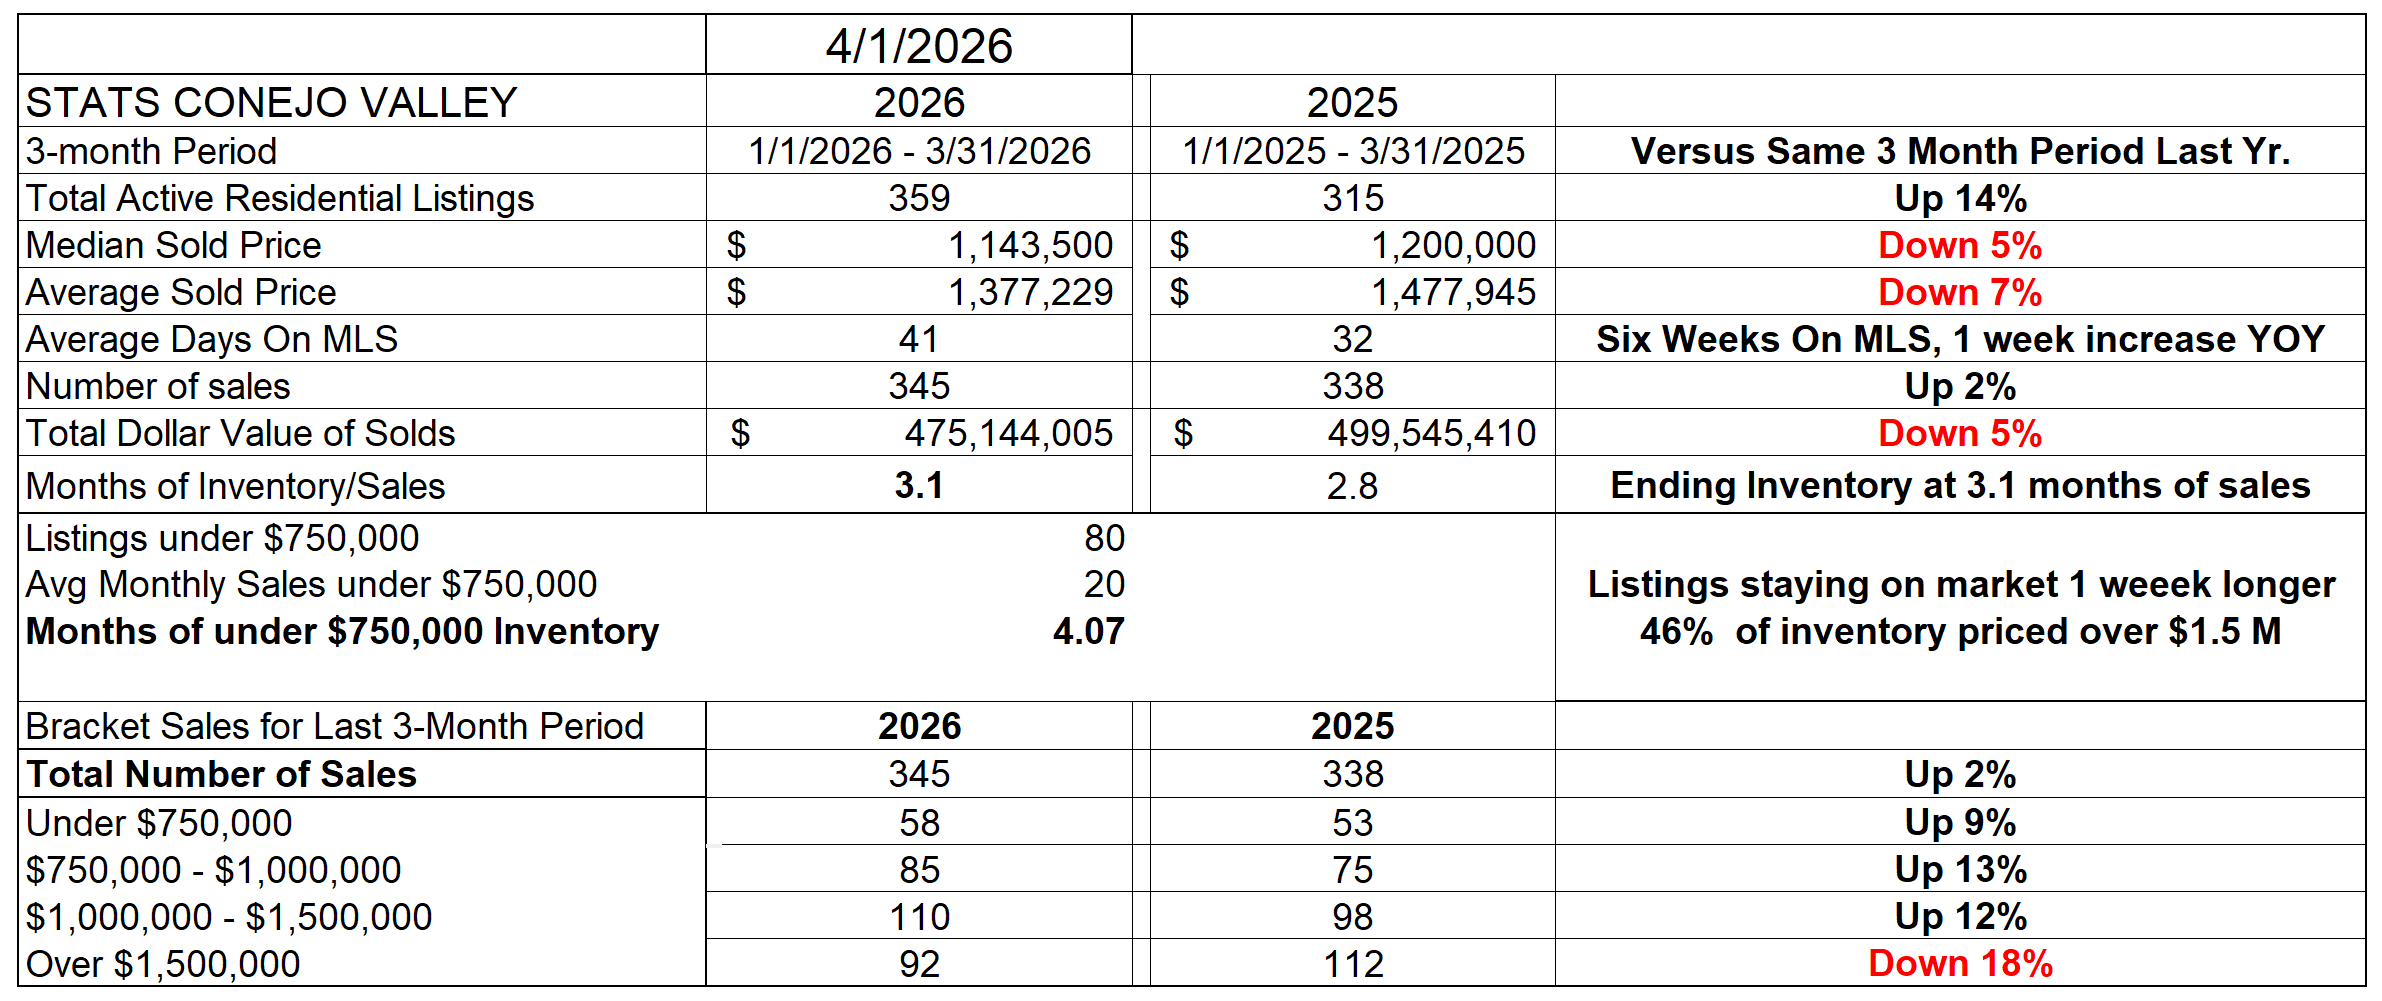
For the Conejo Valley, the number of active listings is up 14% versus the same time last year. However, prices are down, Median prices are down 5% and Average prices down 7%. Remember, these are 3-month averages, chosen by me to smooth out the influence of one particularly bad or good month. Properties are staying on the market a week longer. The one bright spot is that the number of sales actually inceased by 2% versus last year. Based on the history of our area, I suggest 3 months of sales defines a balanced market, trending toward a buyers market but not there yet. The number of very high priced homes, those over $1.5 million, now represents 46% of the entire inventory. As you will see in the bottom half of the table, those highest-priced sales are 18% lower than a year ago, whereas the remainder of the traunches are all up.
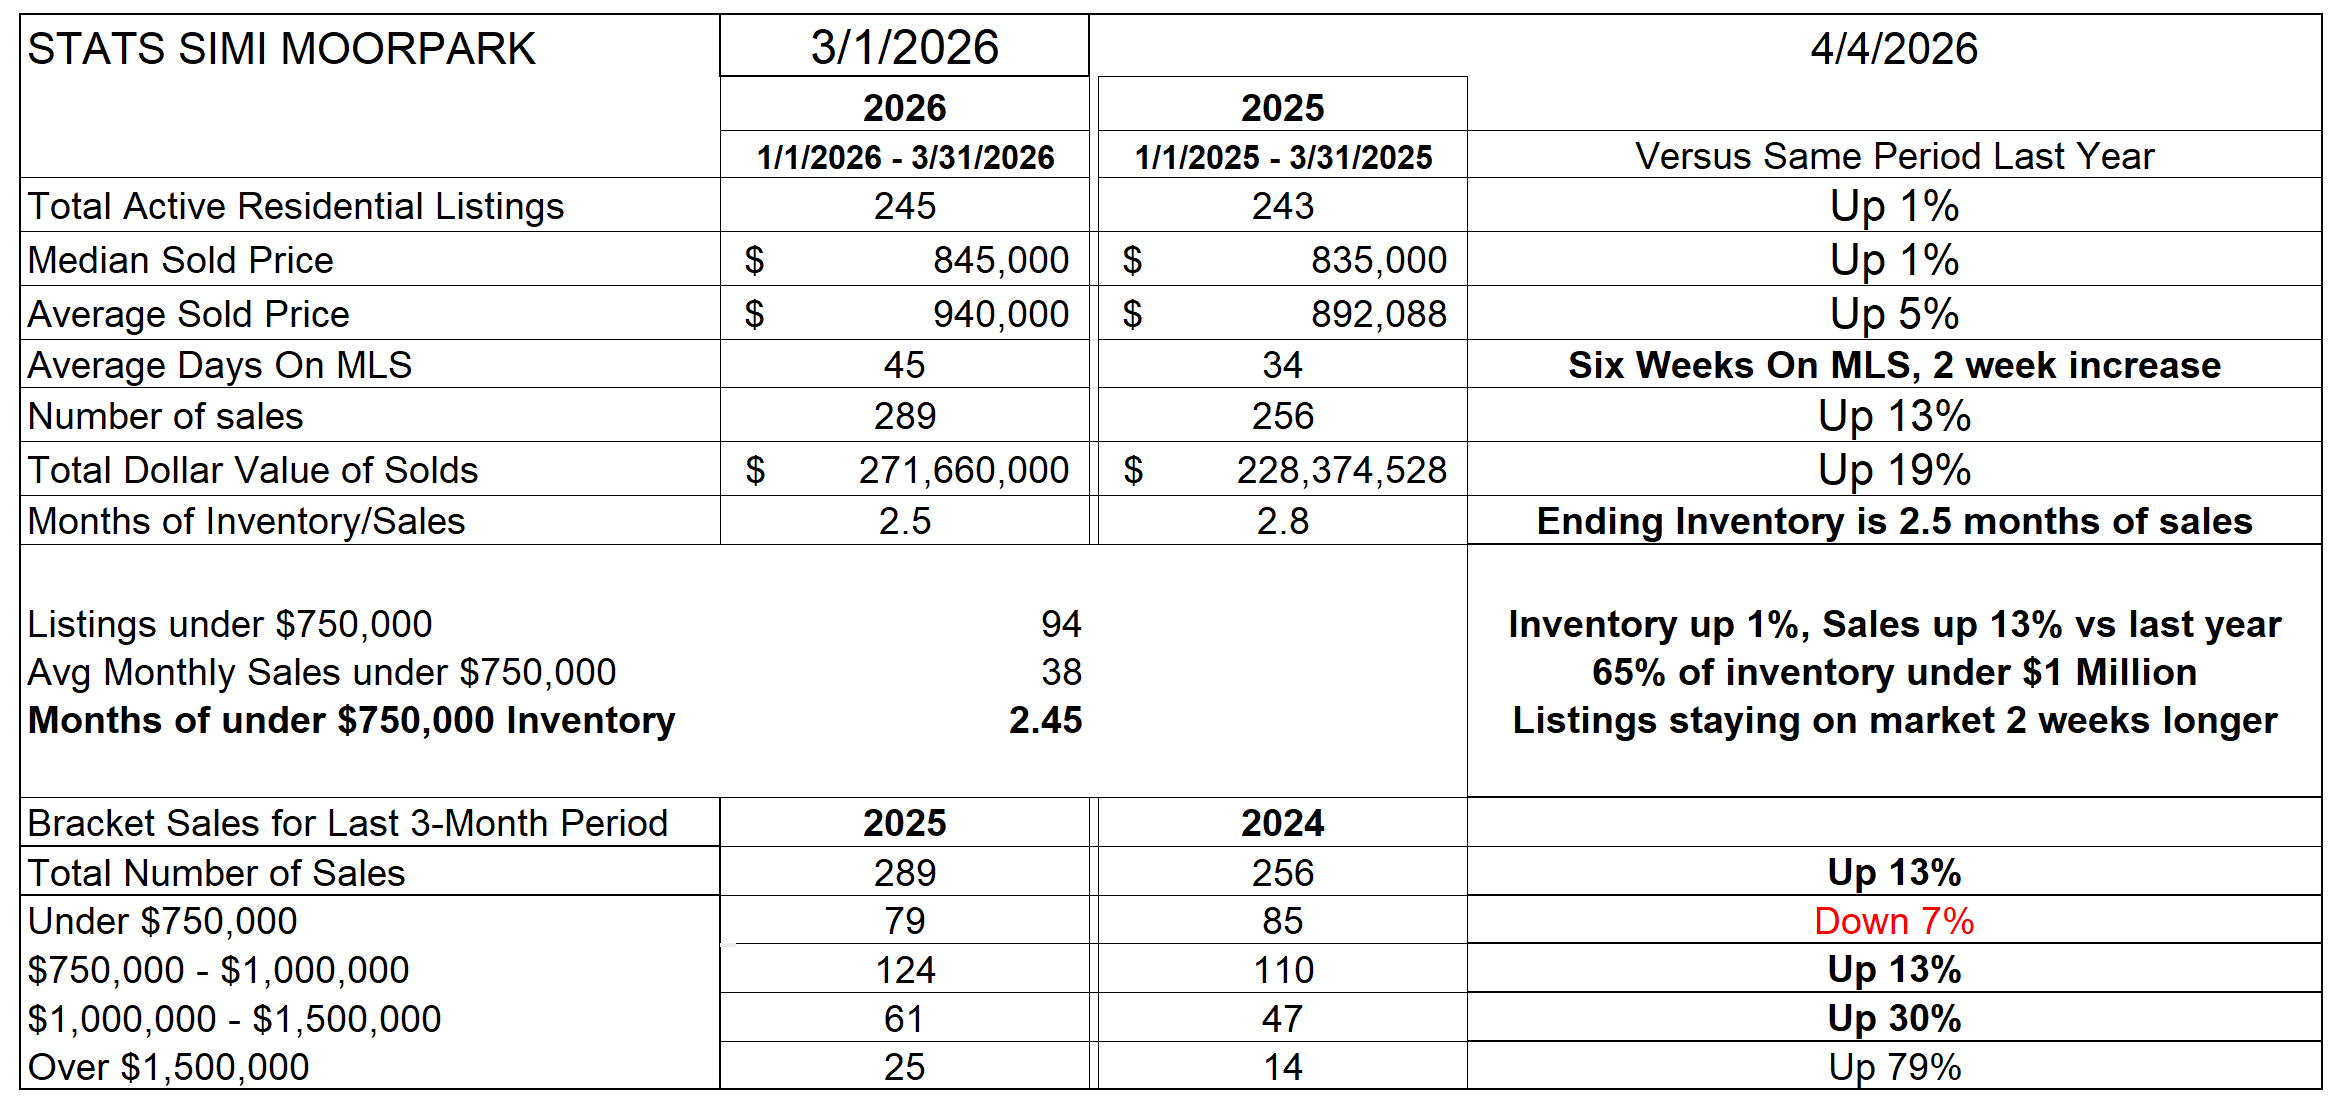
For Simi Valley and Moorpark, a different result. Inventory is about the same as last year, Median prices are up 1% and Average prices up 5%. It does take longer to sell a home, but the number of sales was up significantly, 13%. The ending inventory represented 2.5 months of current sales levels. The primary factor responsible for this difference from Conejo is the lower average price, perhaps better described as more-square-feet-for-your-money price. 65% of active listings are priced below $1 million.
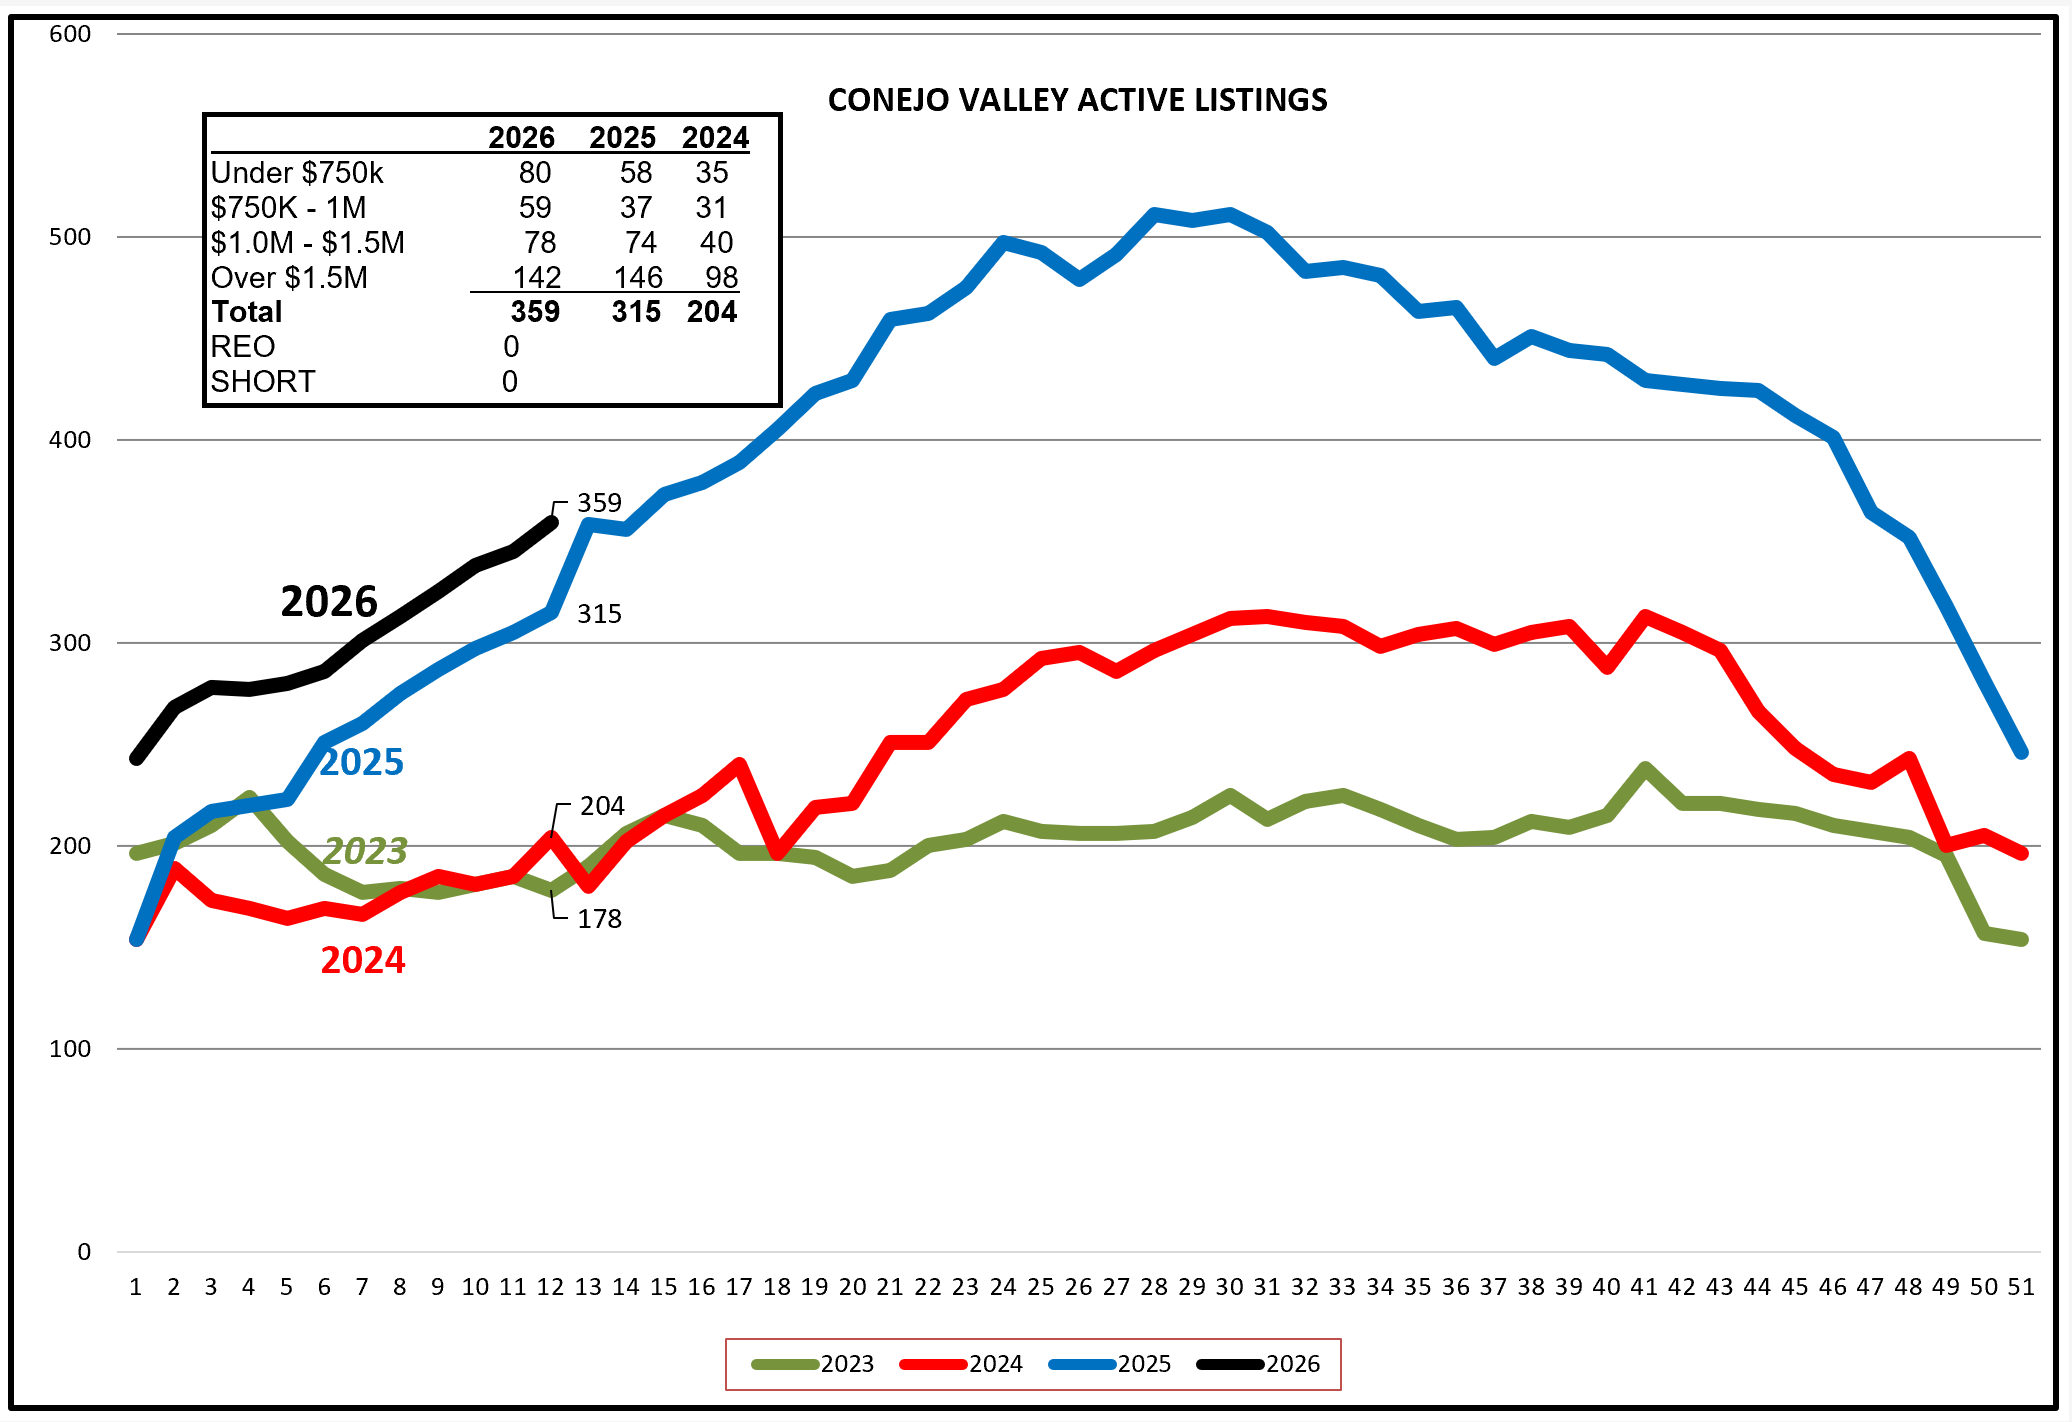
Looking at the inventory in comparison to past years, Conejo inventory is following the same path as 2025, and inventory can be expected to continue to grow as we head into the summer months.
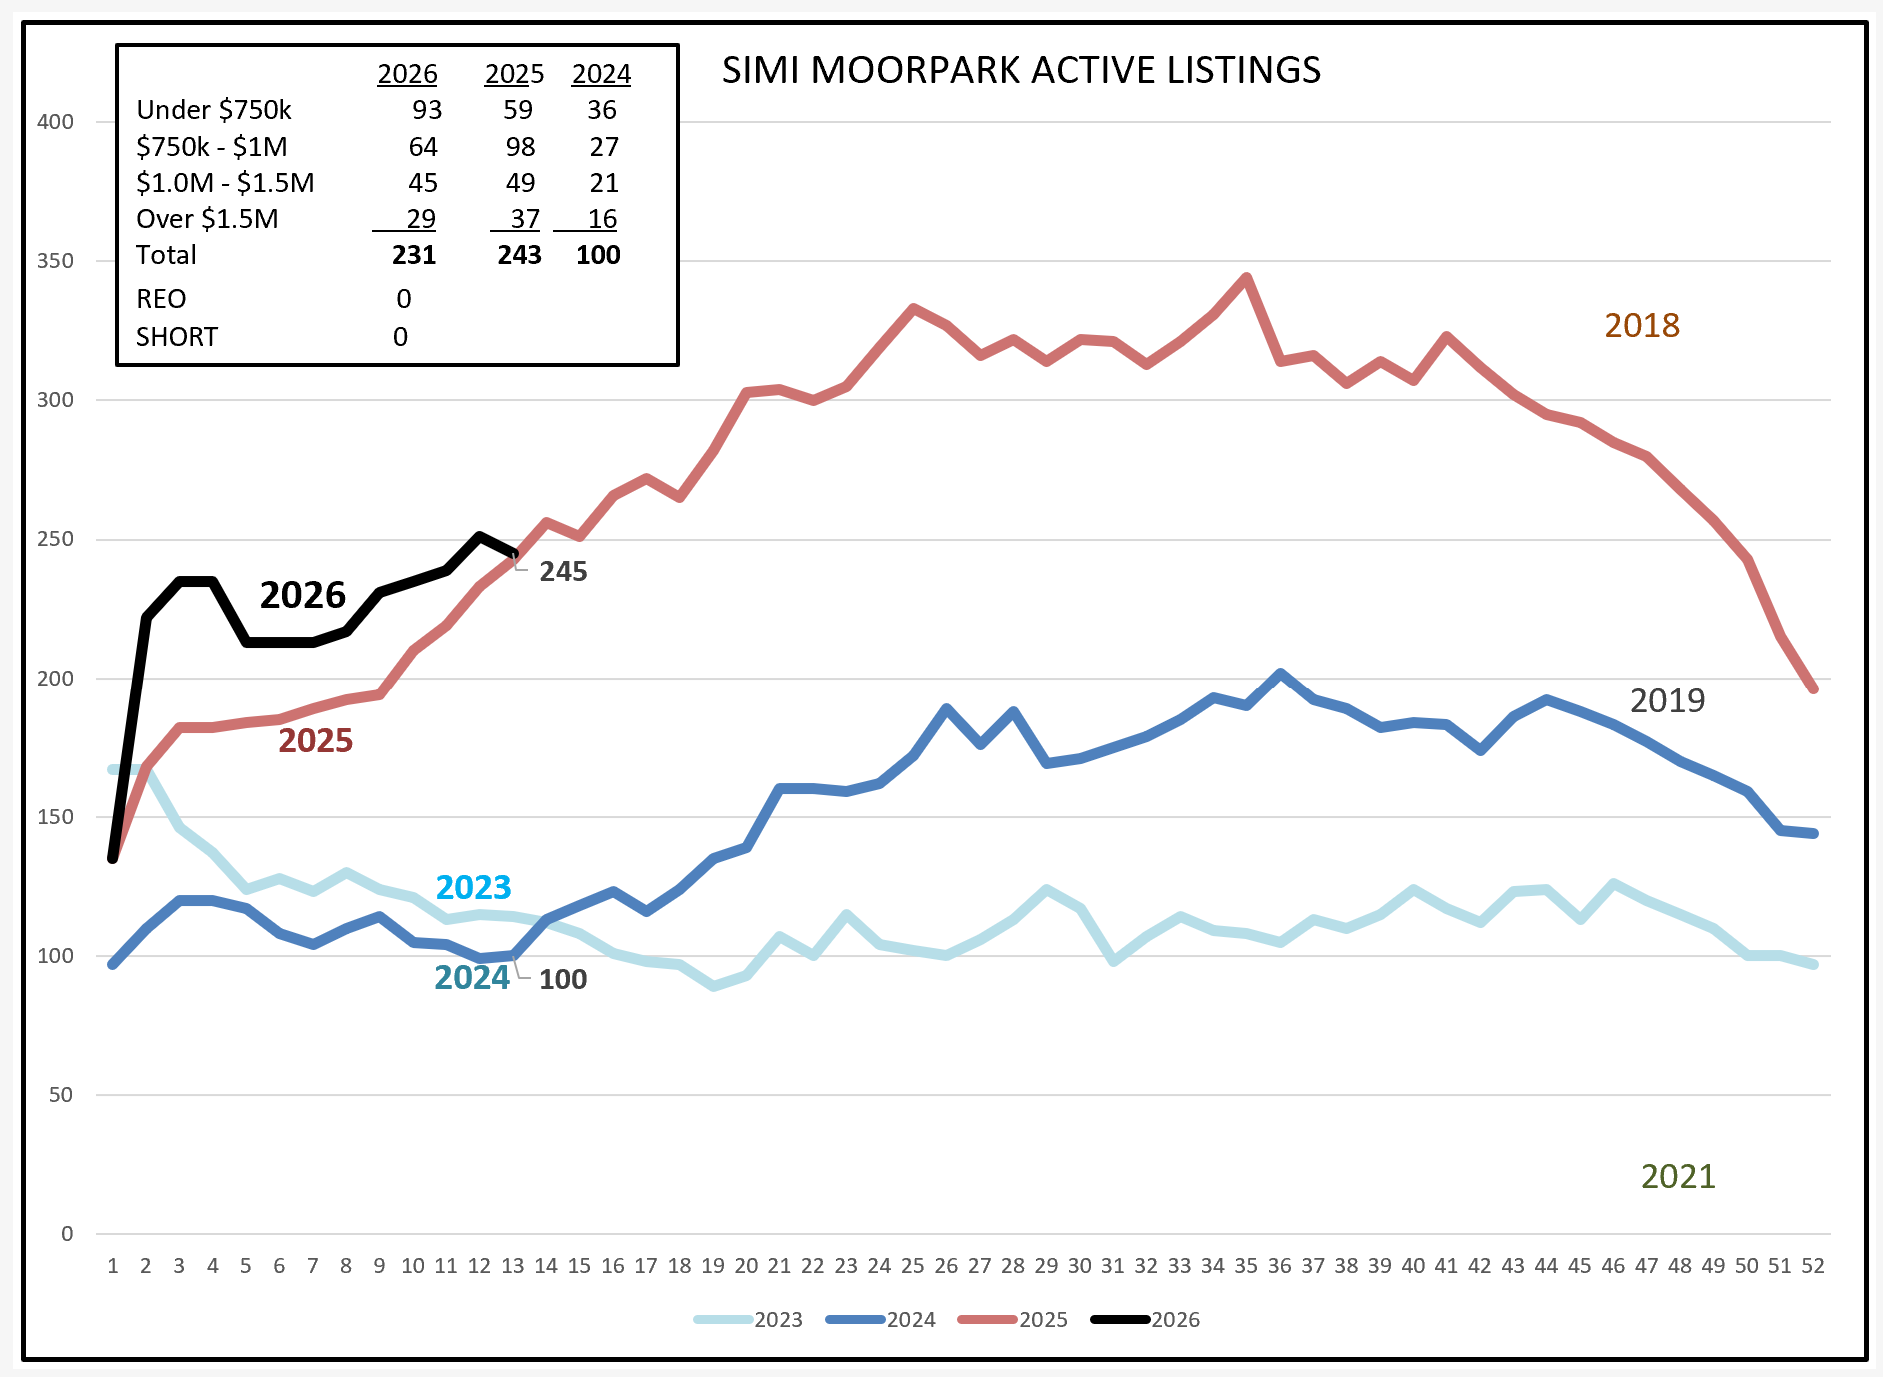
For Simi Valley/Moorpark, inventory is also following the same path experienced in 2025. The good news is that inventory came down a little because sales were up significantly.
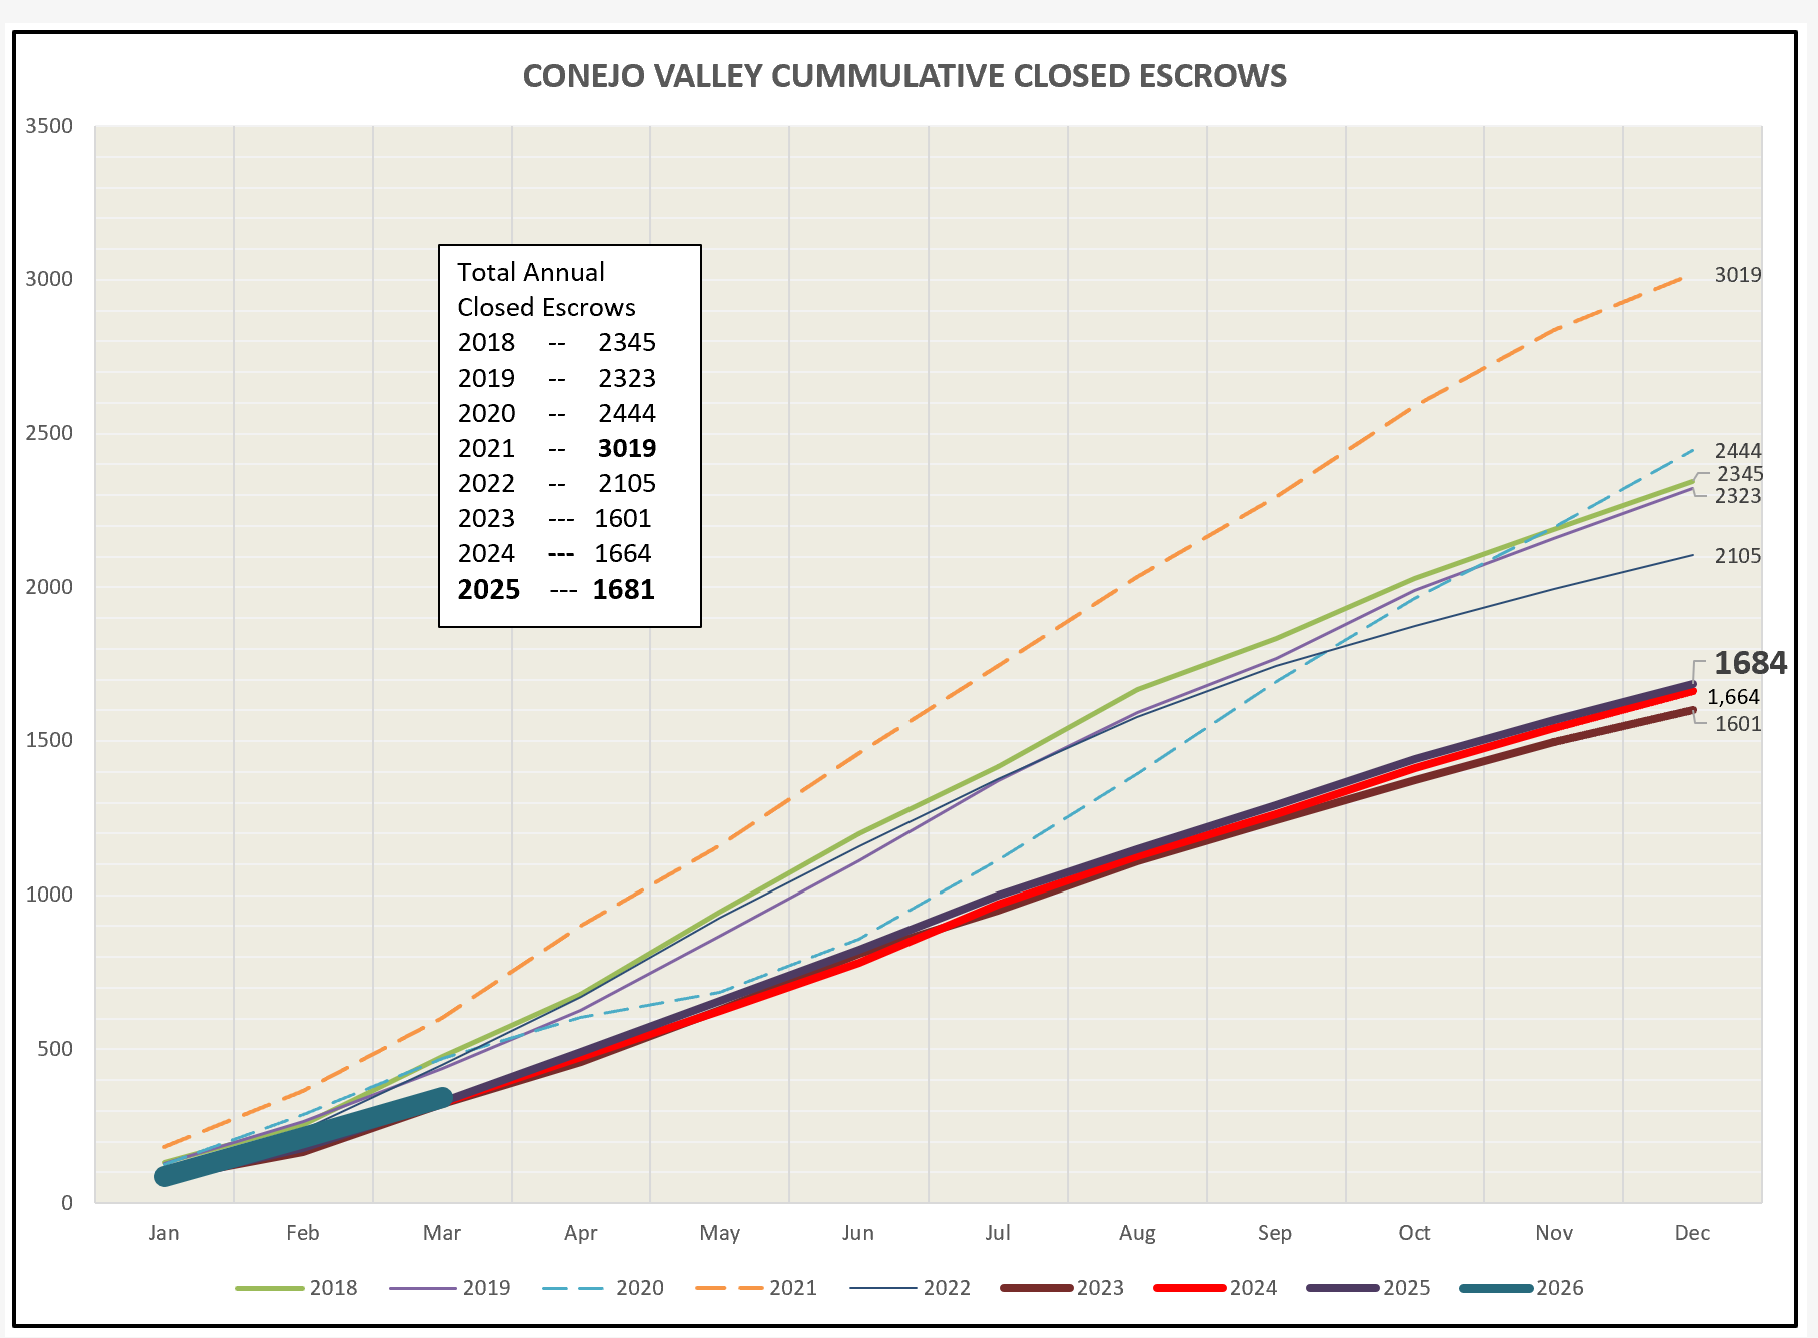
That leaves the other side of the equation, the number of sales taking place. For Conejo, the good start leveled out and now looks to be following the experience of the past three years.
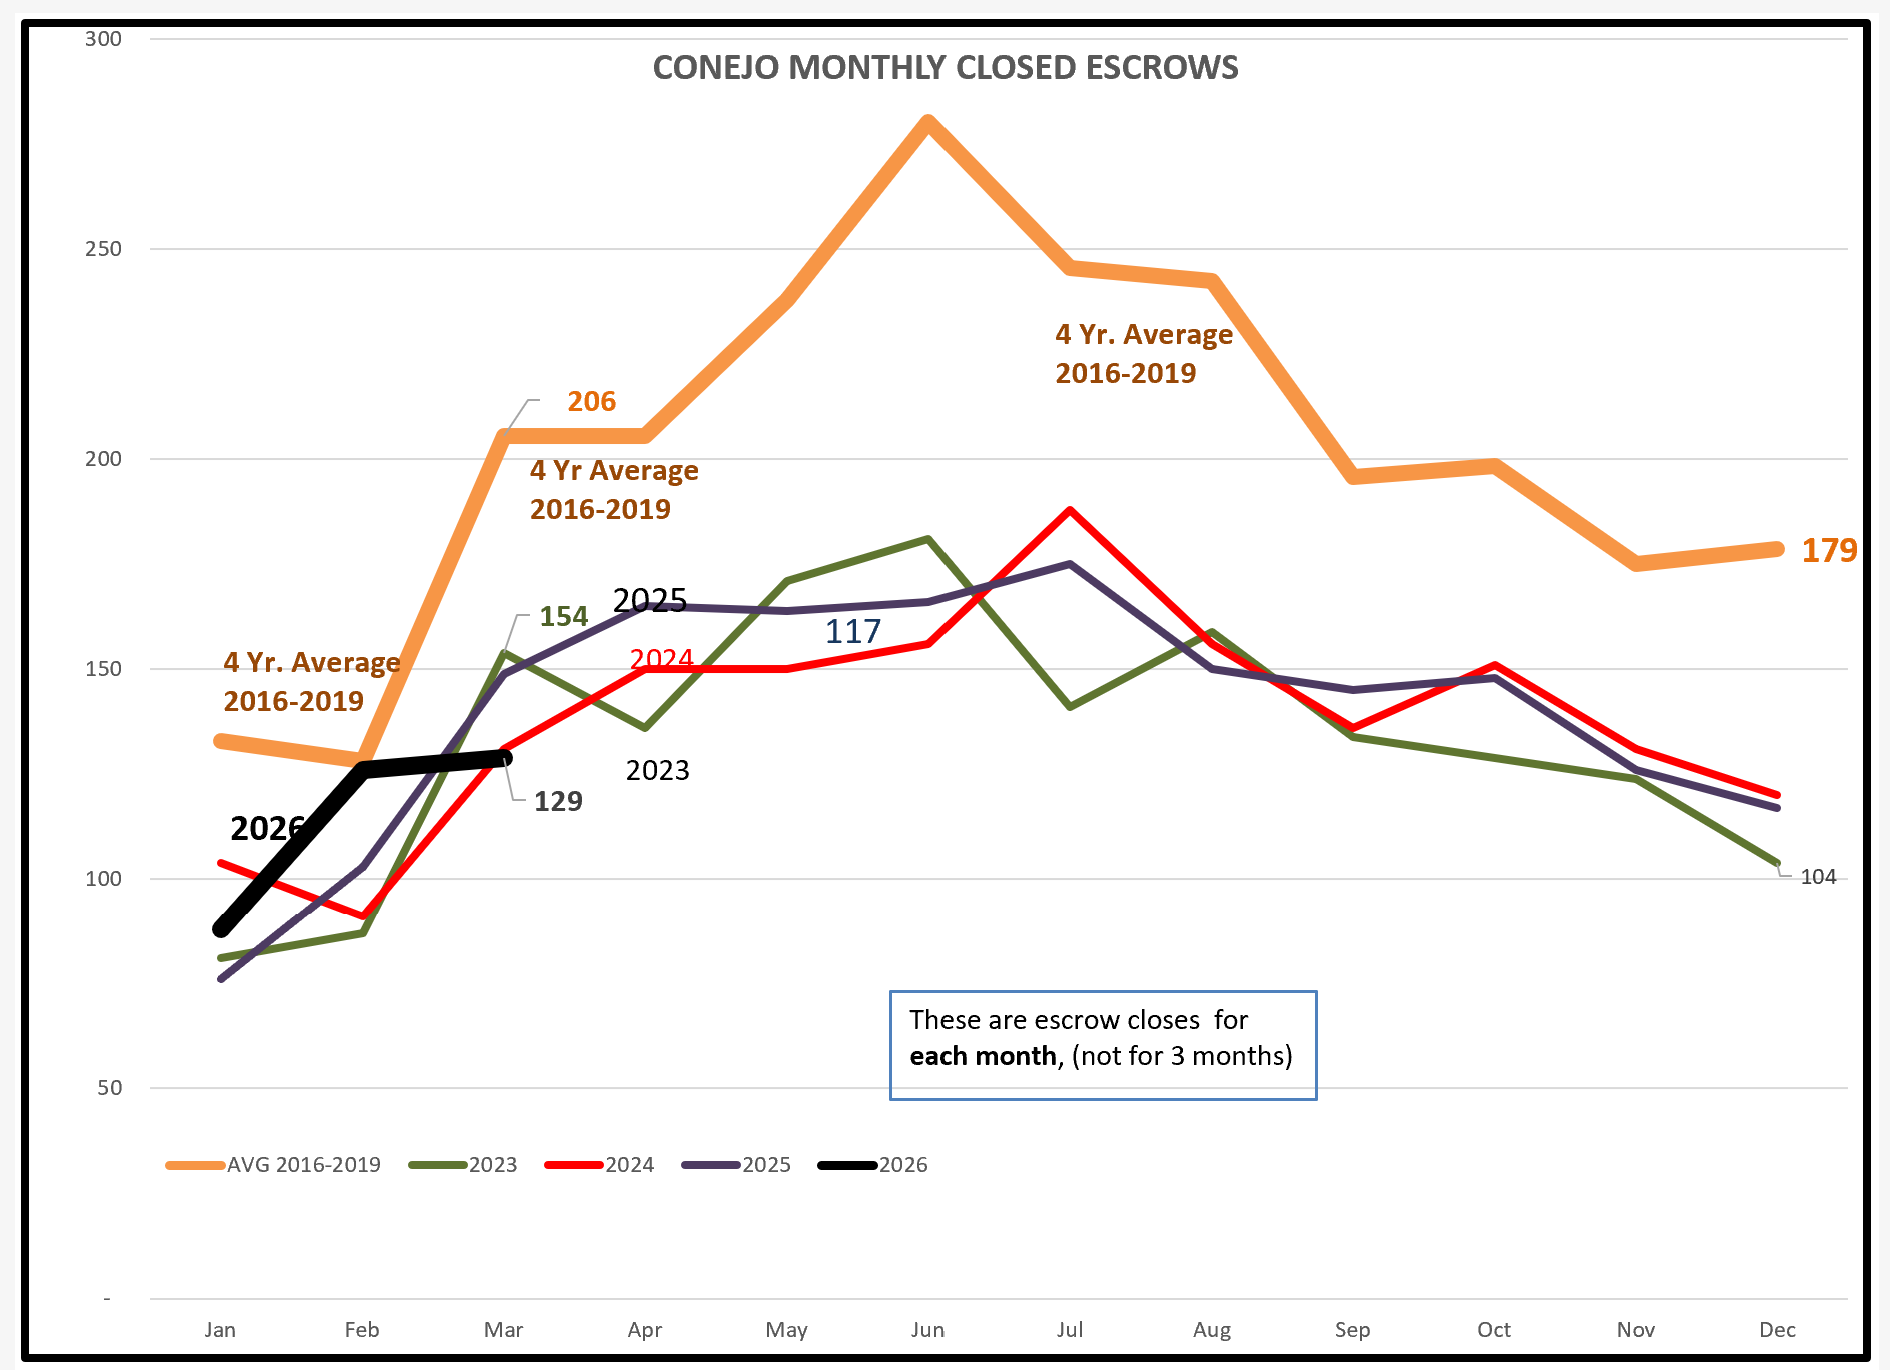
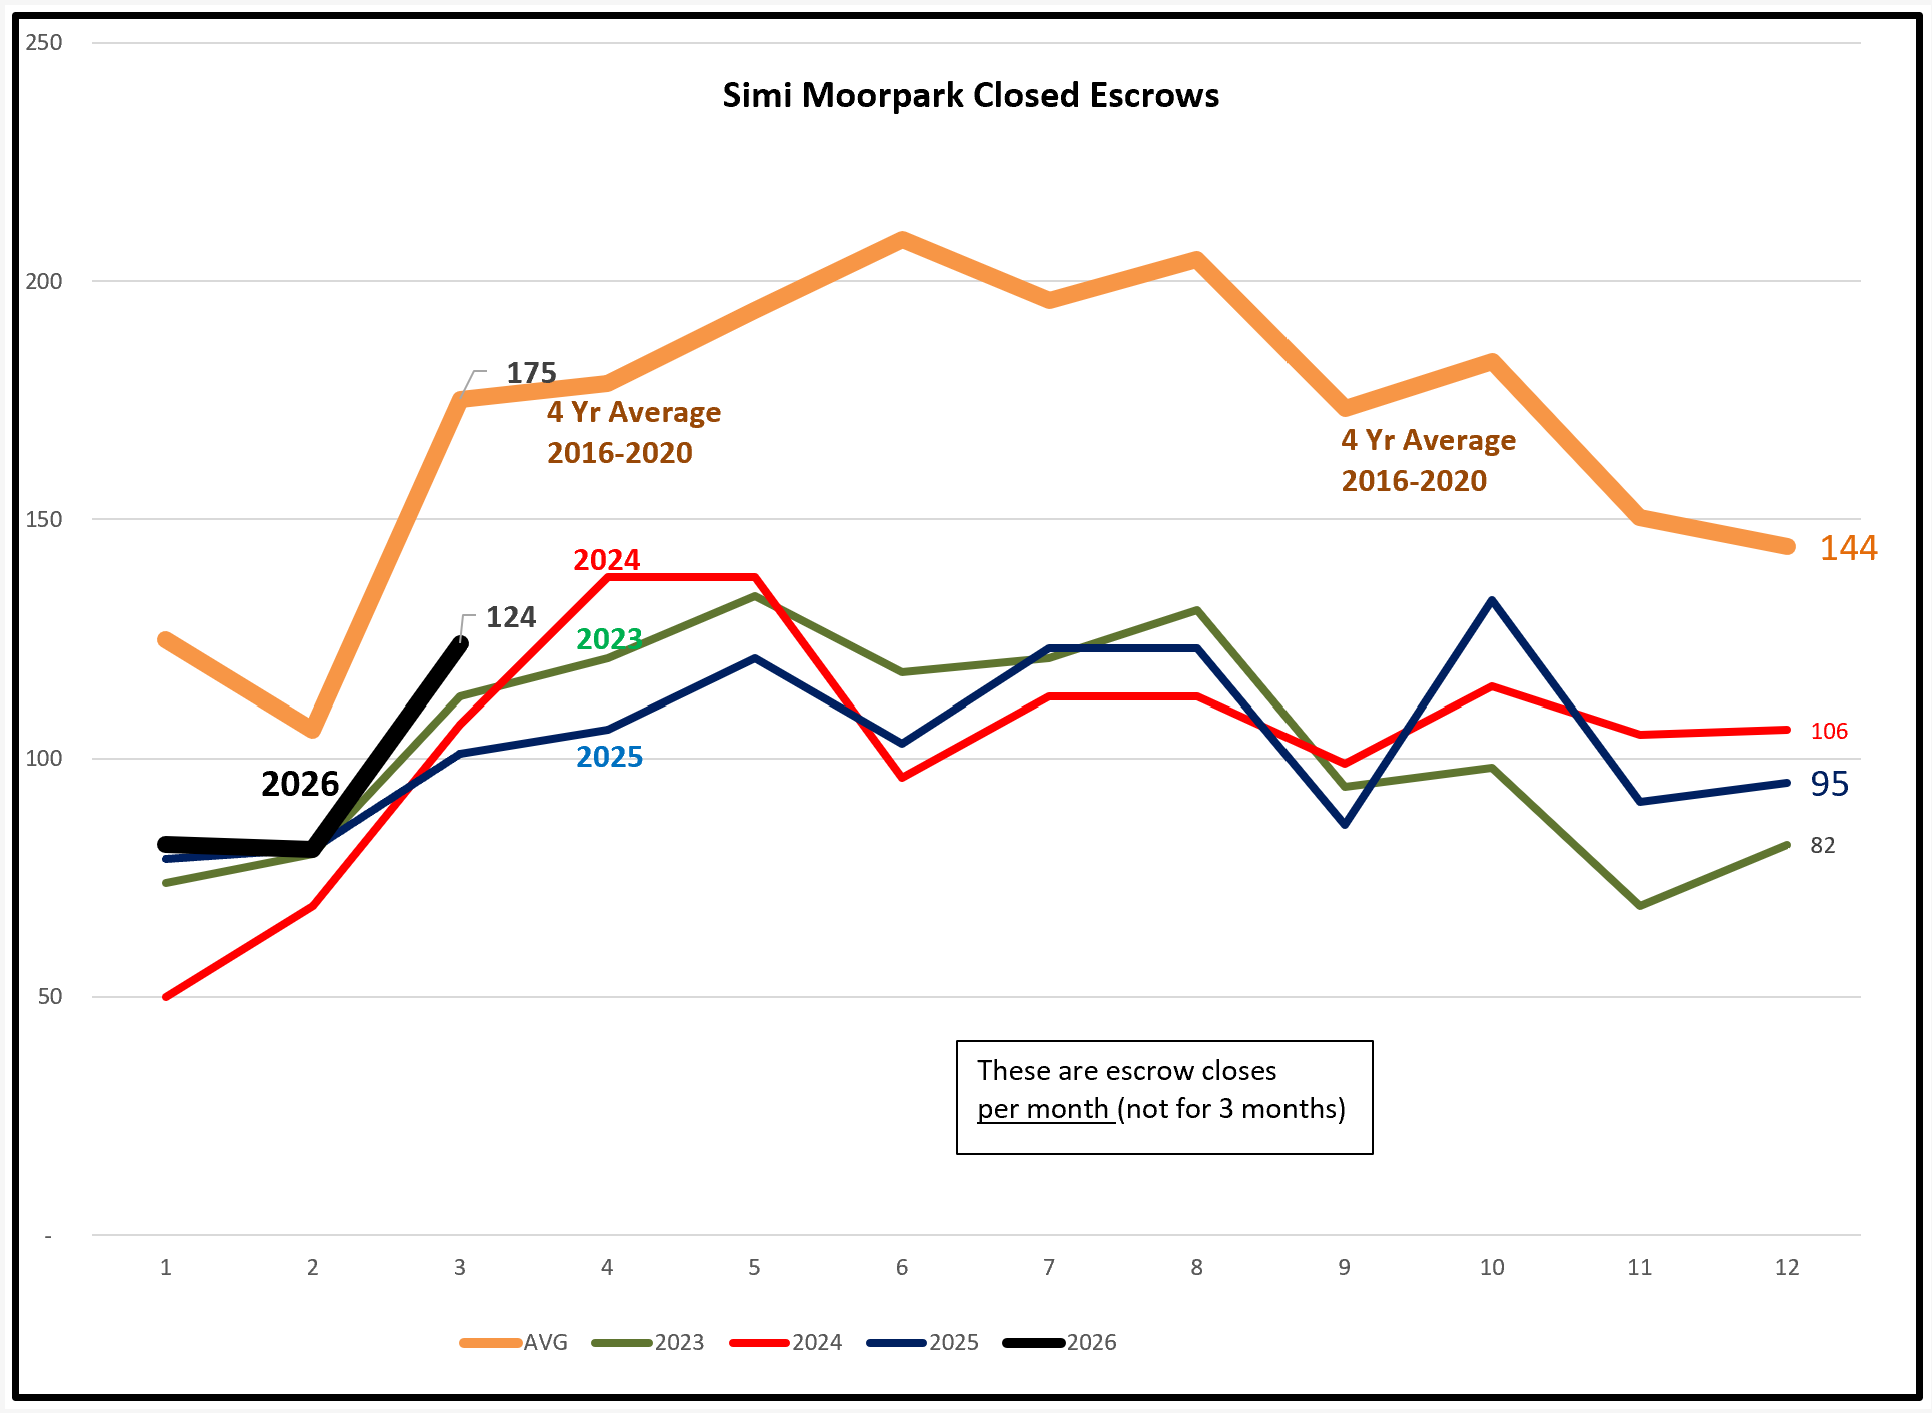
For Simi/Moorpark, the strong sales growth remians below the 2016-2020 average, but sales appear stronger than in recent years.
Looking again at how these sales numbers accumulate as the year progresses, Conejo is on track to equal the same 1600 or so homes sold in each of the past three years.
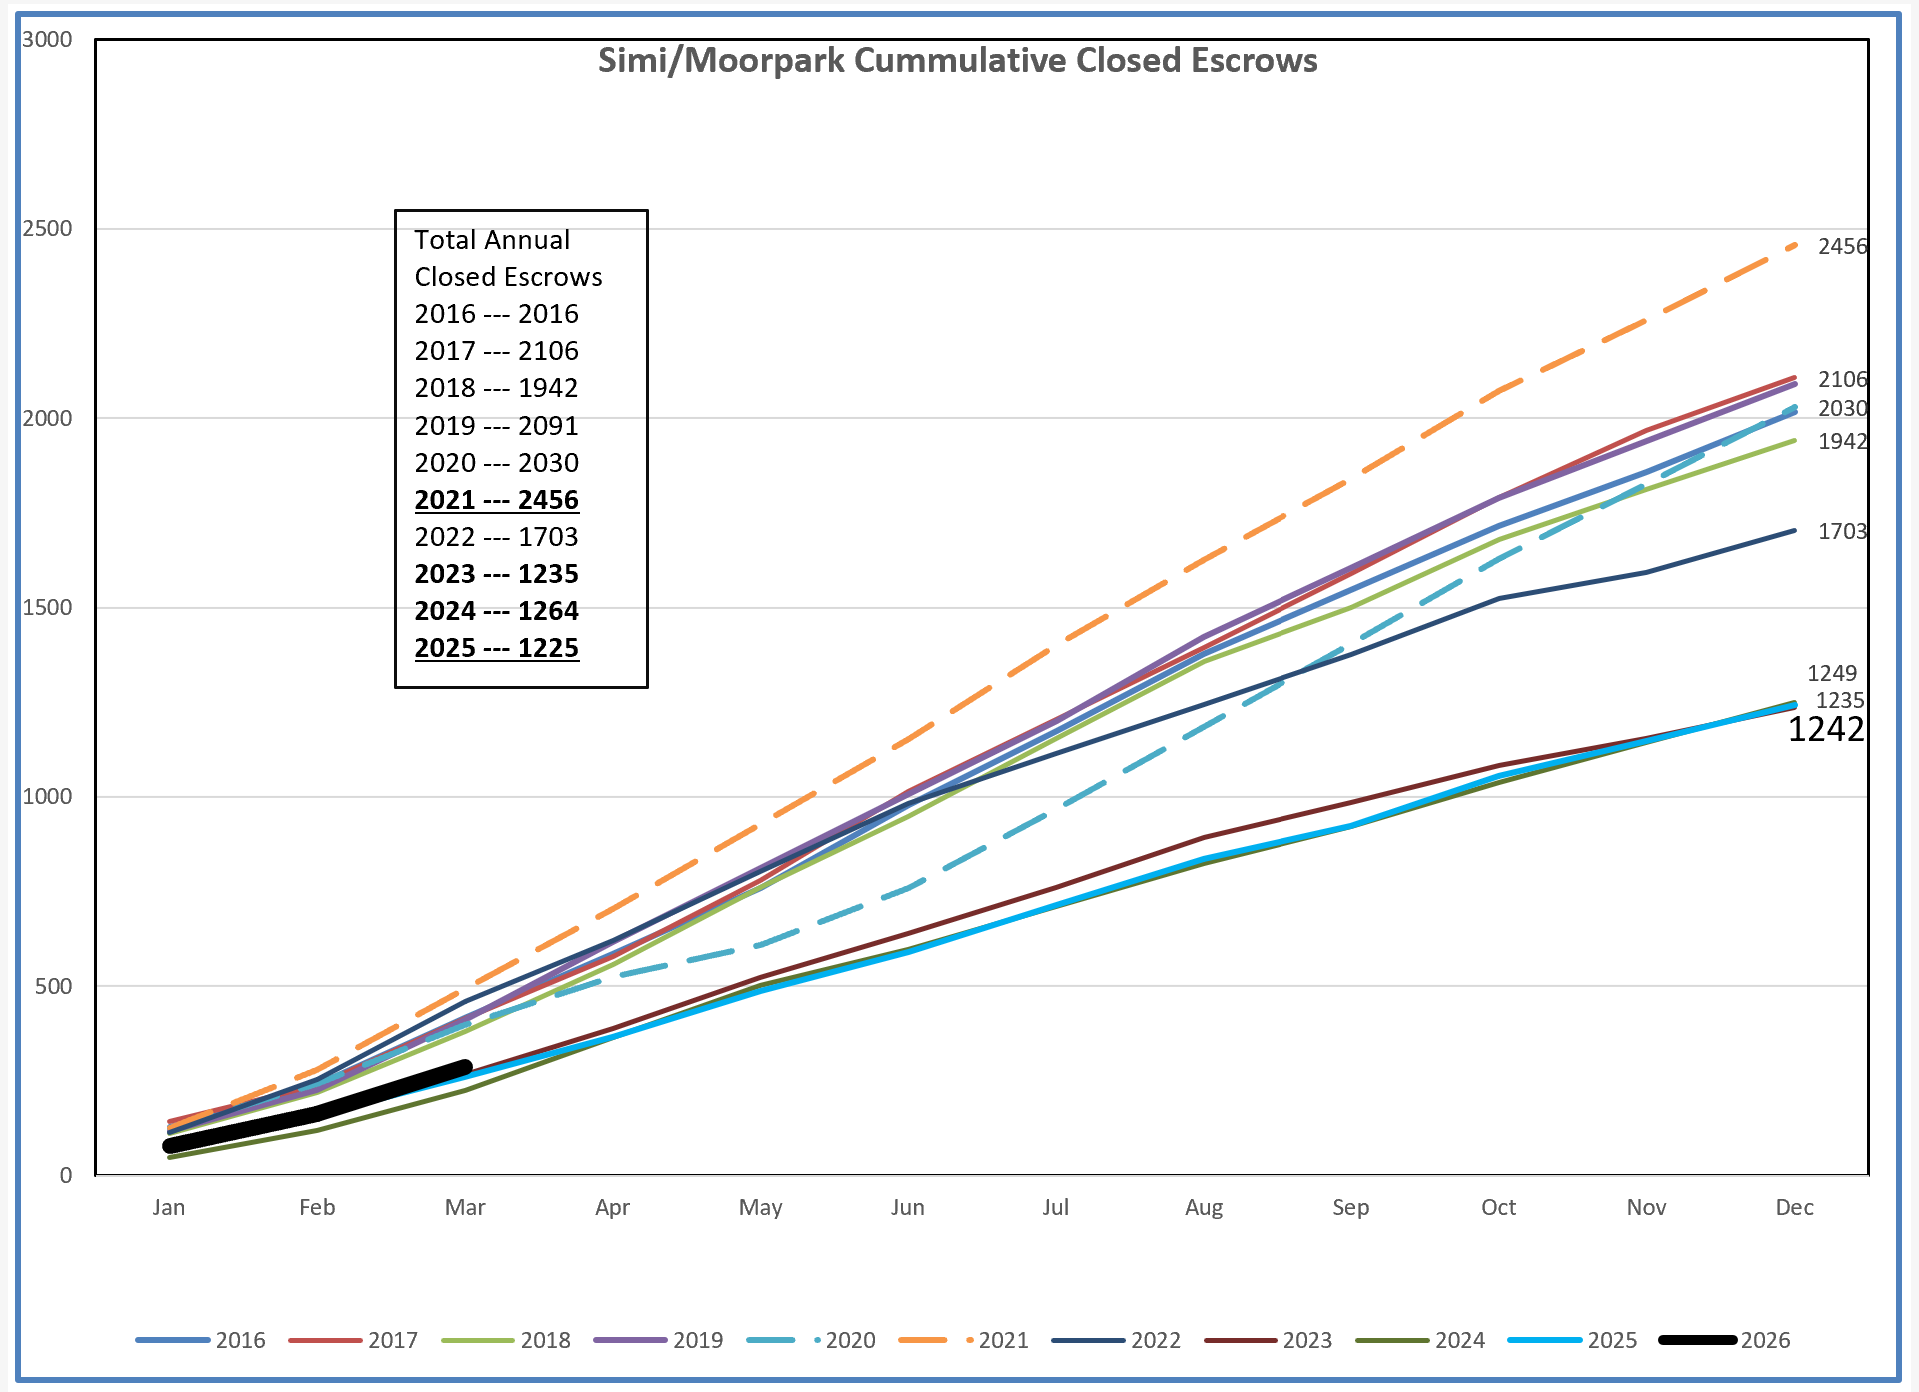
Simi/Moorpark is edging higher, and may beat the 1200 homes sold in each of those past three years.
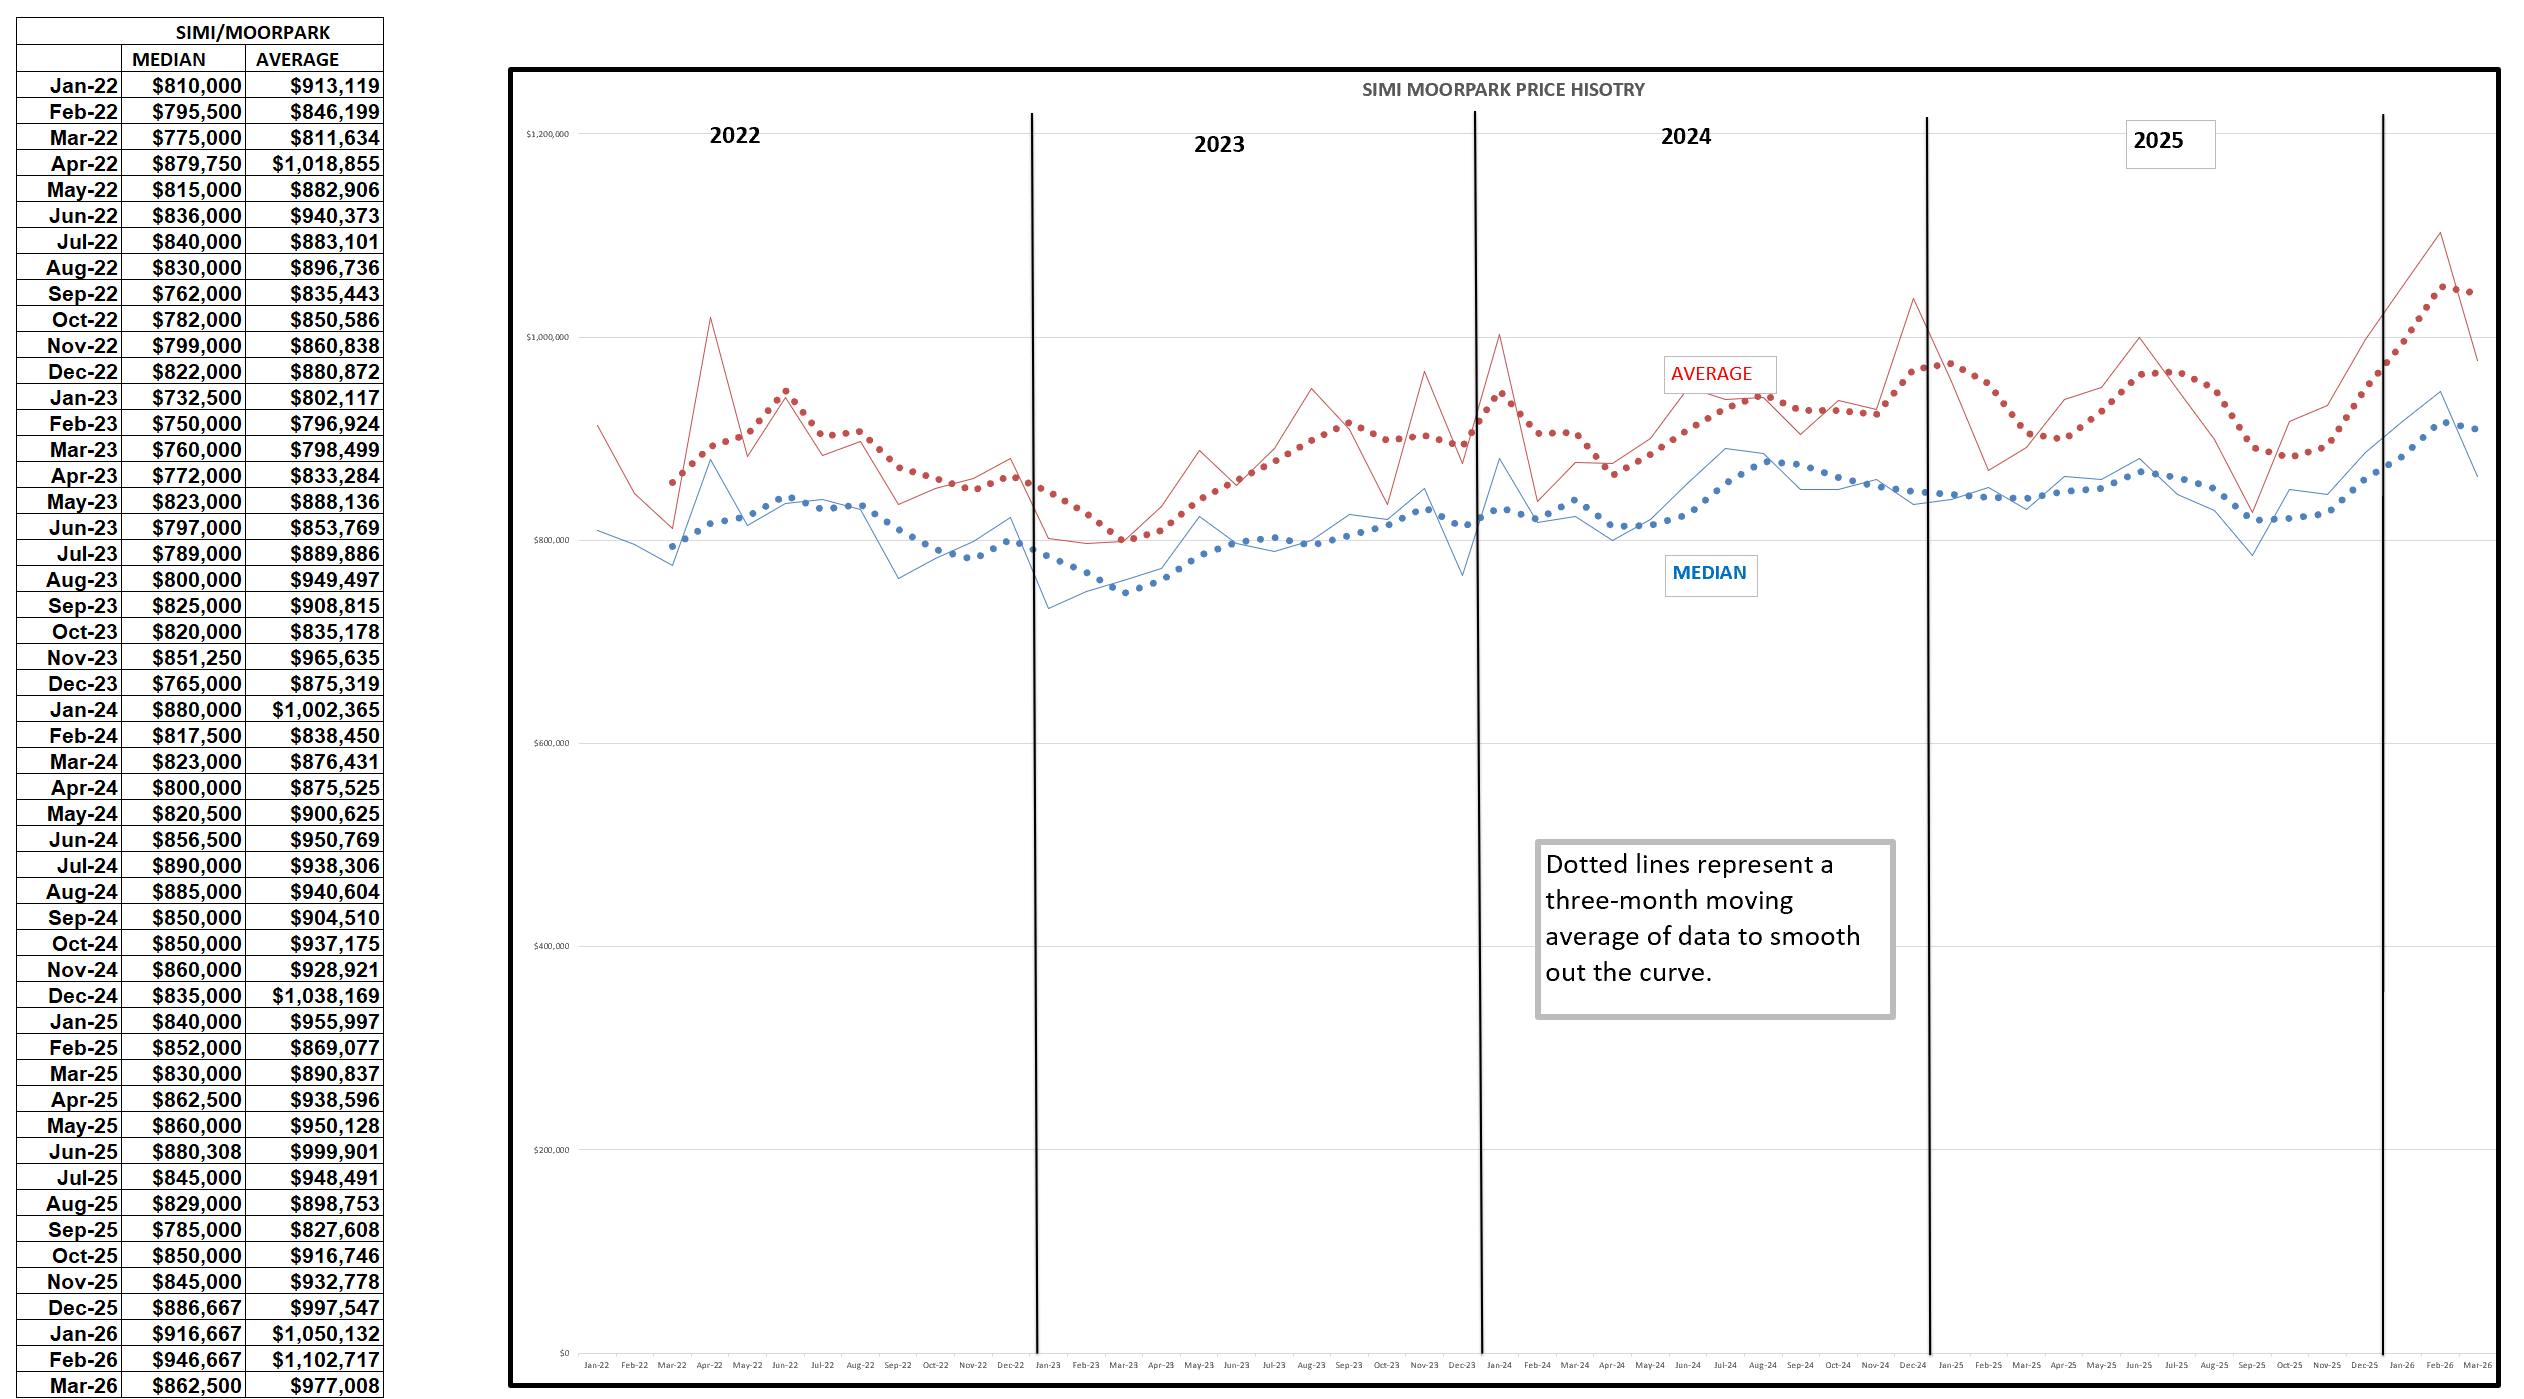
Finally, prices. The table at the beginning of this blog showed a decrease in both Median and Average prices compared year over year. Let’s see how that looks on a chart. This chart does not utilize the three-month averages reported in the table, but instead is populated by the actual one-month median and average prices, represented by the narrow red and blue lines.. The heavier dotted lines take that data and smooth it out by computing the average price over the prior three months. The good news is that while prices decreased in the latter half of 2025, 2026 is actually reporting stronger prices, although down from the same month a year ago.
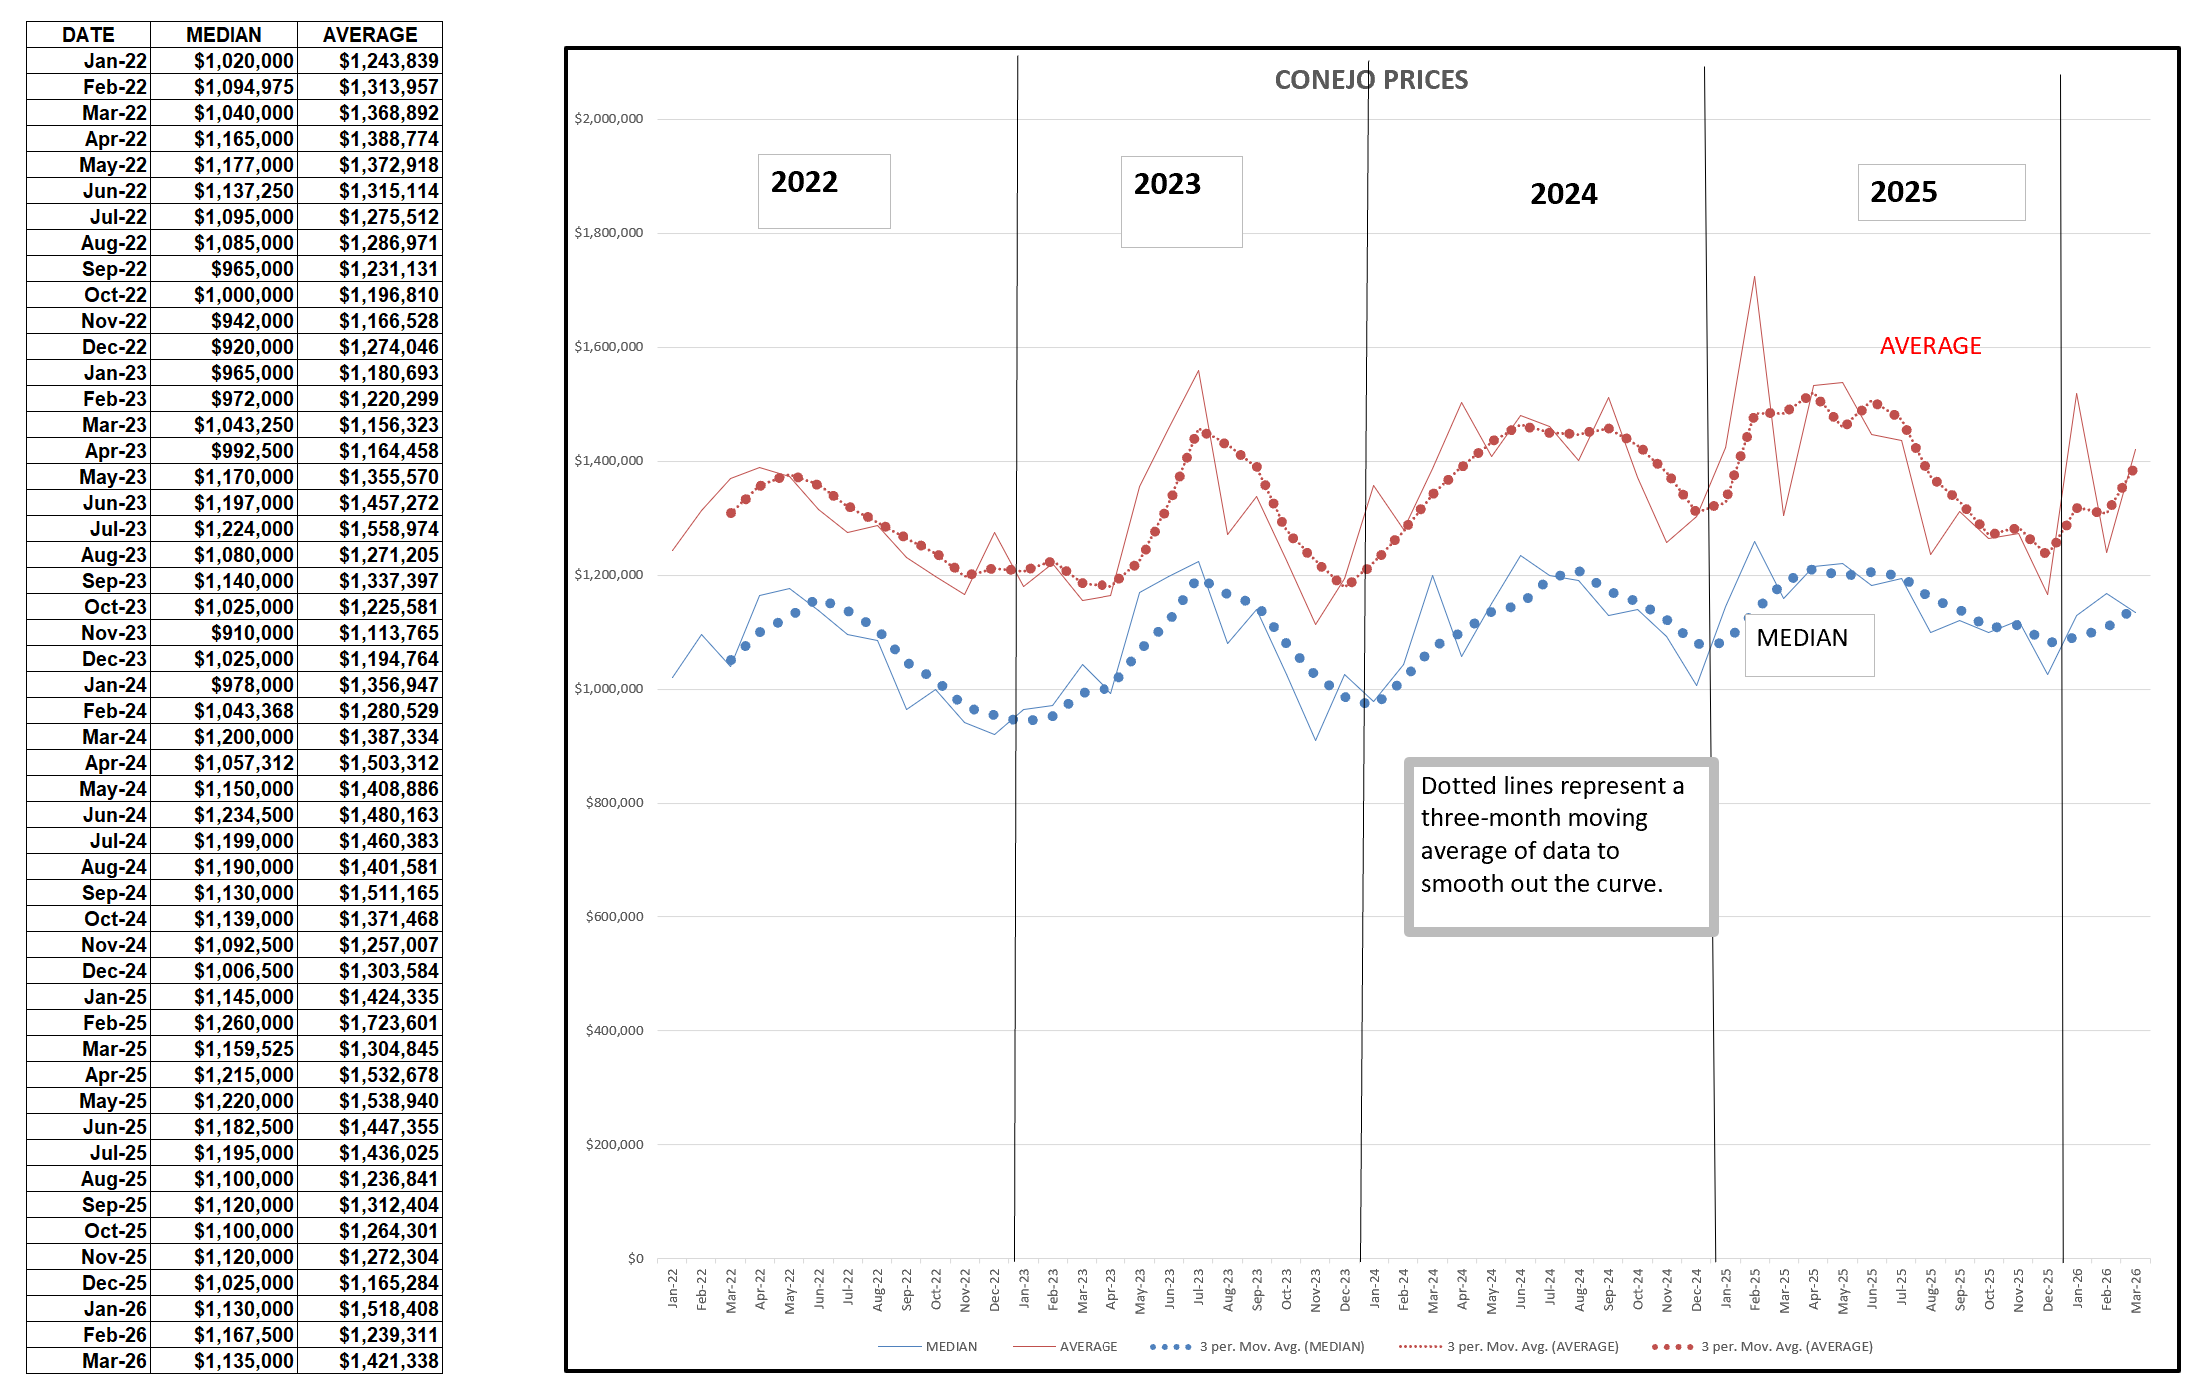
For Simi/Moorpark, we can see prices turn positive in the last few months of 2025 and then continued to increase sharply to new highs before falling last month.
So what of the future? Way too early to tell. We do much better when we have peace in the world, and unfortunatley we do not have peace, we are prosecuting a war. As the Morningstar forecast points out, the result of being at war plus the effect of tariffs are inflationar. Rising prices and uncertainty create the potential for recession. That is not a political statement, but an economic one. Until our world gets better, more stable, less dangerous, I can find no reason to expect our market to be no better than the last three years, with the potential for worse times ahead. Supply and Demand and Pricing are trying to balance with a very different set of circumstances than we had those past three years. My hope is that we can somehow get back to normal. There is little upside potential, but unfortunately there is a threat on the downside.
Stay safe out there.
Chuck