One of the most impactful economic events of the the past decade was really a medical event. Covid. Those three years changed the way we look at working, commuting to work, where we live to deal with the new at-home work environment, and the reduction of commuting.
We’re glad that it is over. But maybe it is not. Last week I tested positive for covid. Thanks to numerous inoculations and a previous episode with covid, as well as a prescription for Paxlovid, I did not have a difficult time, certainly not one in danger of hospitalization. But it did point out to me that it is not just what the FED does to interest rates that spells out the future of the housing market. There are a plethora of things to juggle. I will not be making predictions today, but promise to report next month what someone numerous times wiser, Chief CAR Economist Jordan Levine, has to enlighten us this week.
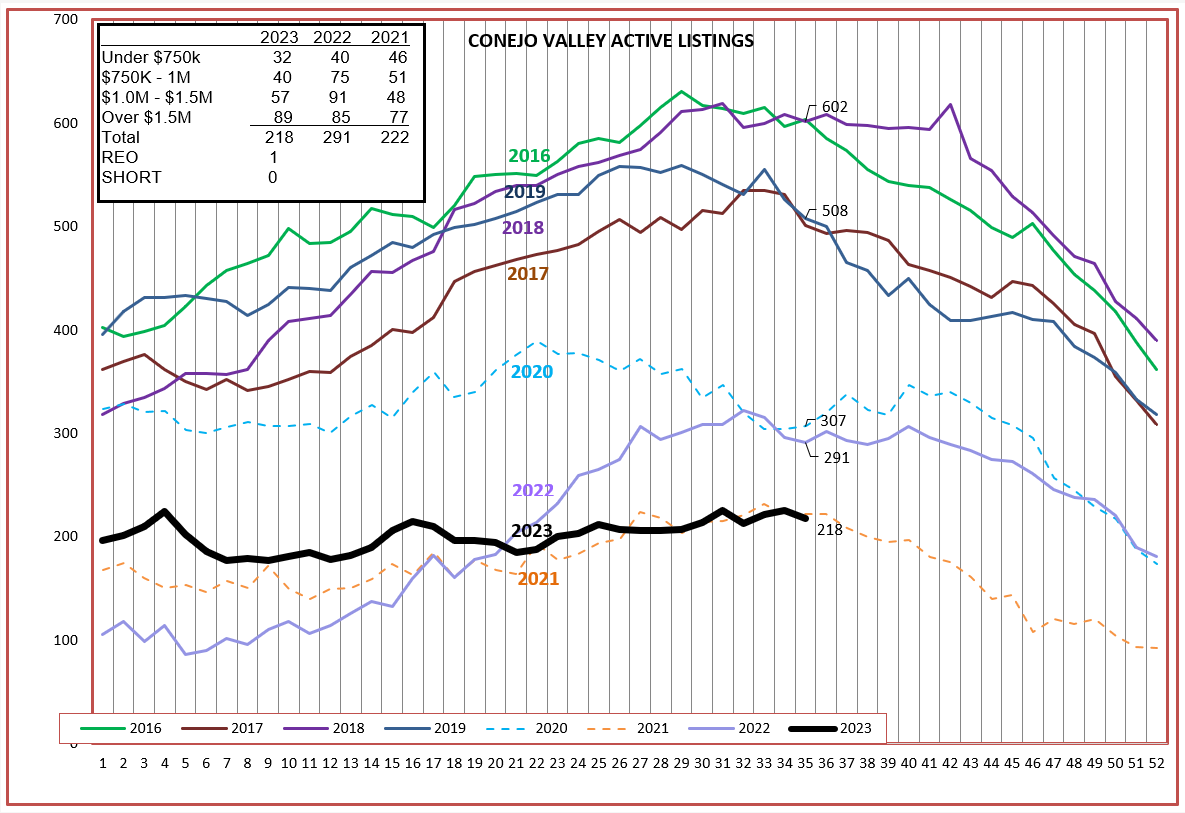
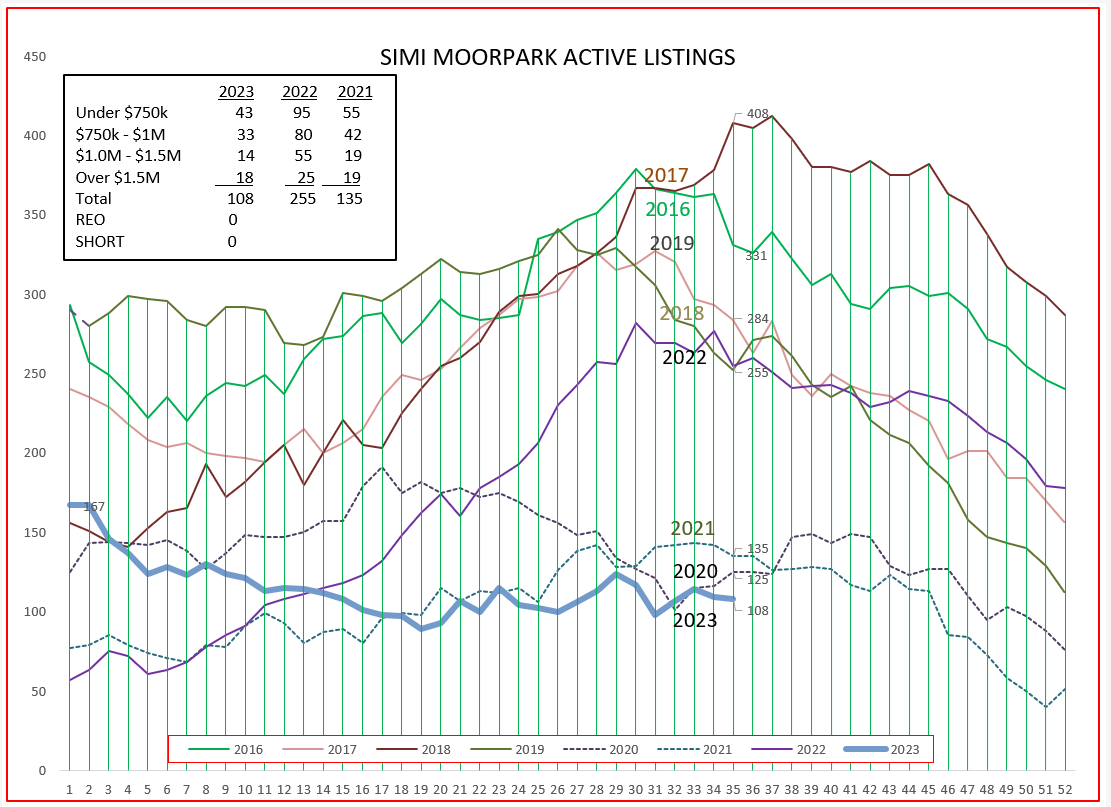
Our market is good for homeowners and home prices, but is providing less business for real estate agents. The lack of inventory is at the base of both. Lack of inventory generally pushes prices higher, or in this case supports prices against dropping. The lack of inventory is not a result of strong demand due to covid, it is more due to the drastic increase in interest rates, doubling mortgage rates of a year ago. Properties that would normally come onto the market are being held by potential sellers who are concerned they could not match their current mortgage rates with another purchase, and are hanging onto their current properties. Conejo Valley, Moorpark, and Simi Valley graphs all exhibit the same problem.
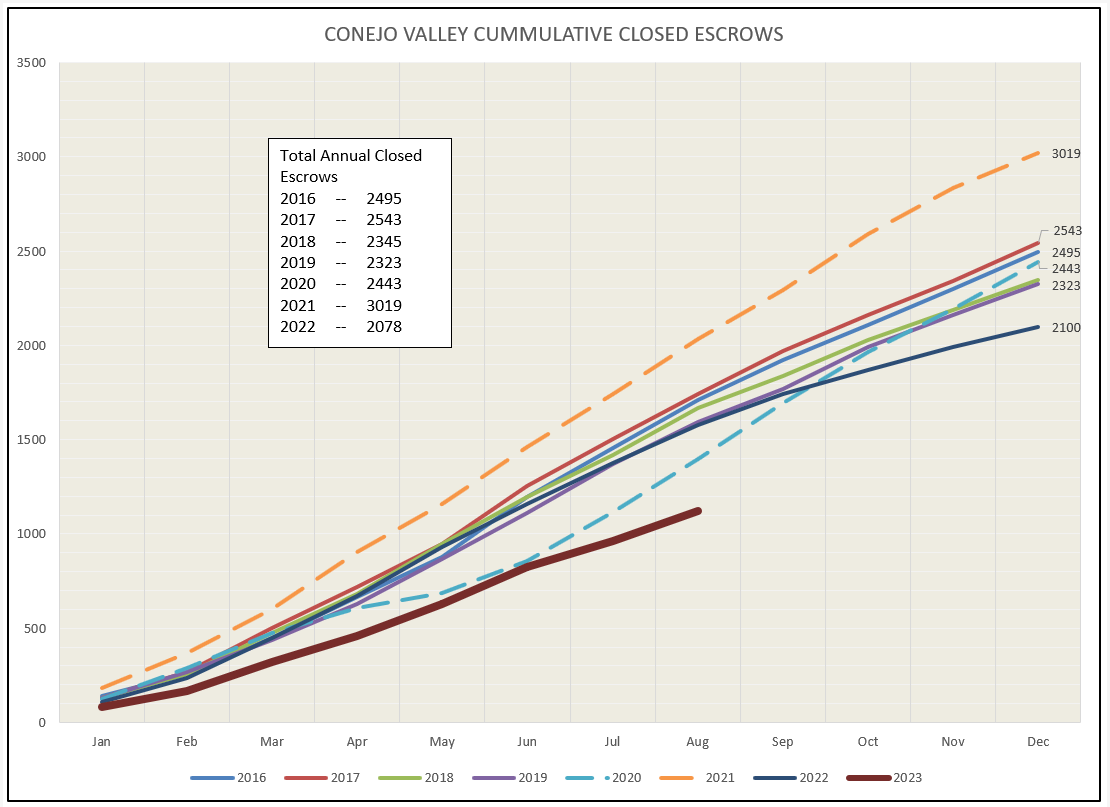
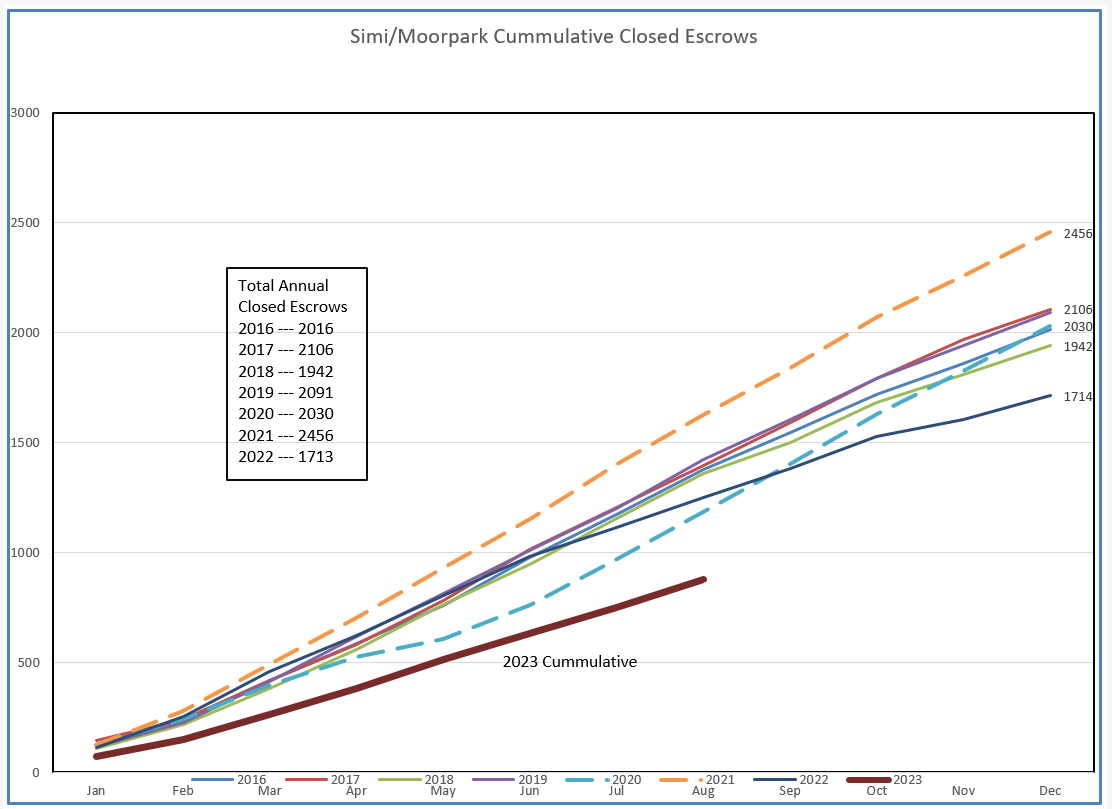
The first Covid outbreak pushed buyers to attack our market, moving from downtown LA to larger homes with workspaces. Commuting times are not a factor if you work from home. The heavy orange line below represents the 5-year average of closed escrows. The heavy green line is 2023, closely following the path of seasonal transactions but at a much lower level.
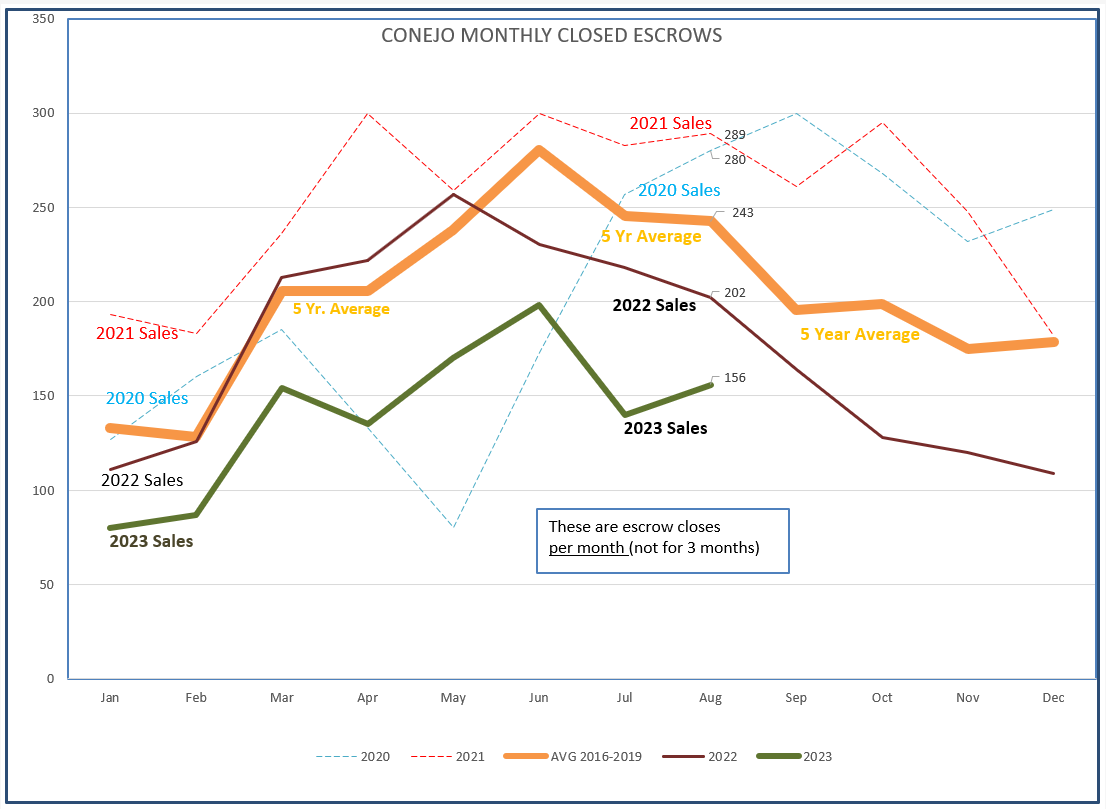
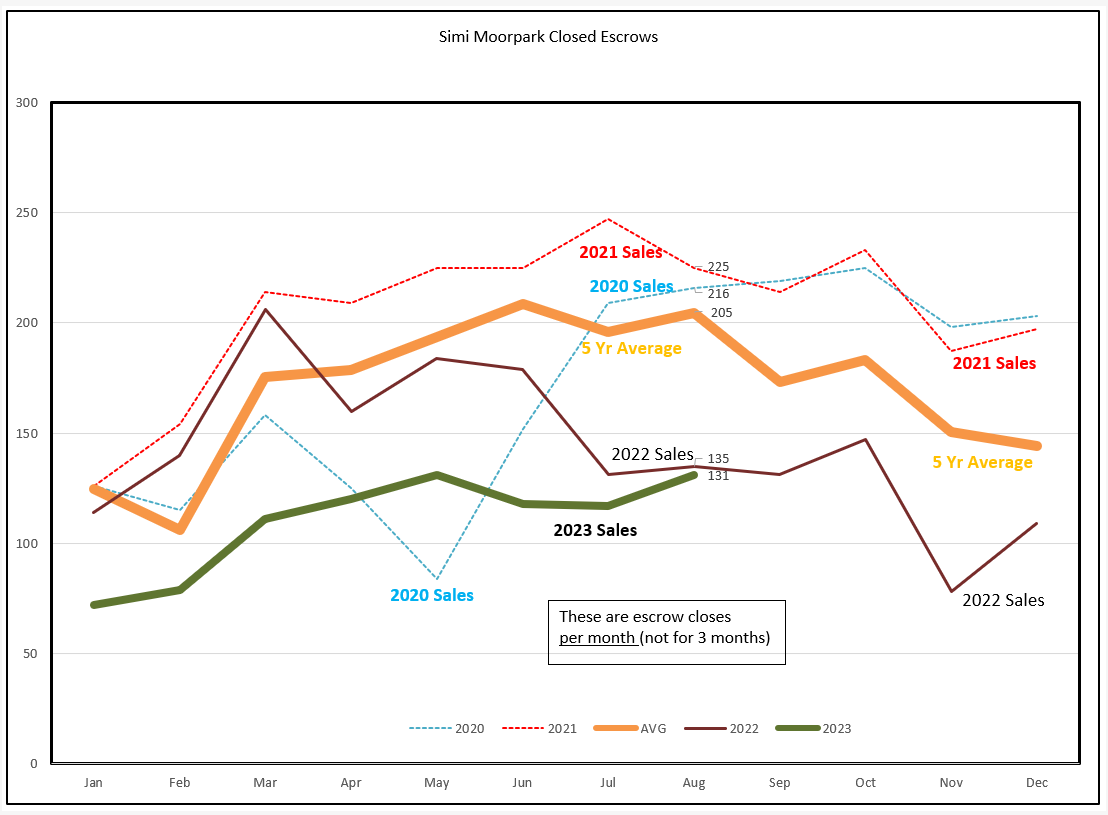
In order to see how big that gap in closed transactions is, let’s look at the same information on a different graph, one that shows the total number of closed escrows as the year progresses. The heavy brown lines below indicate how far out of normal this market is.
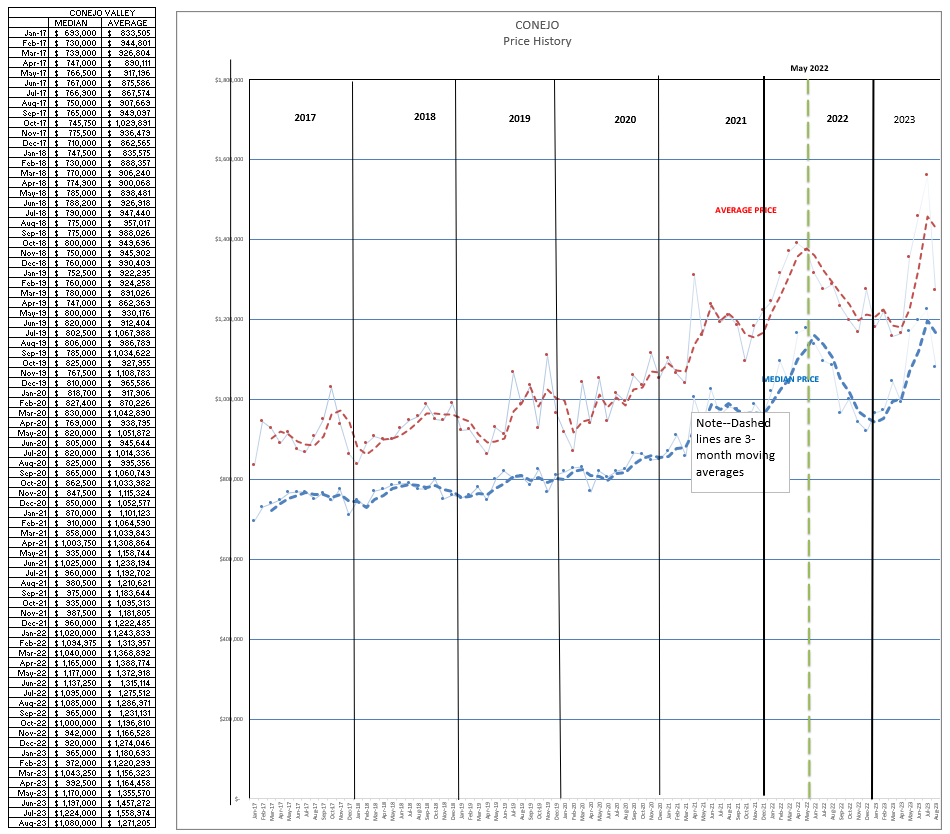
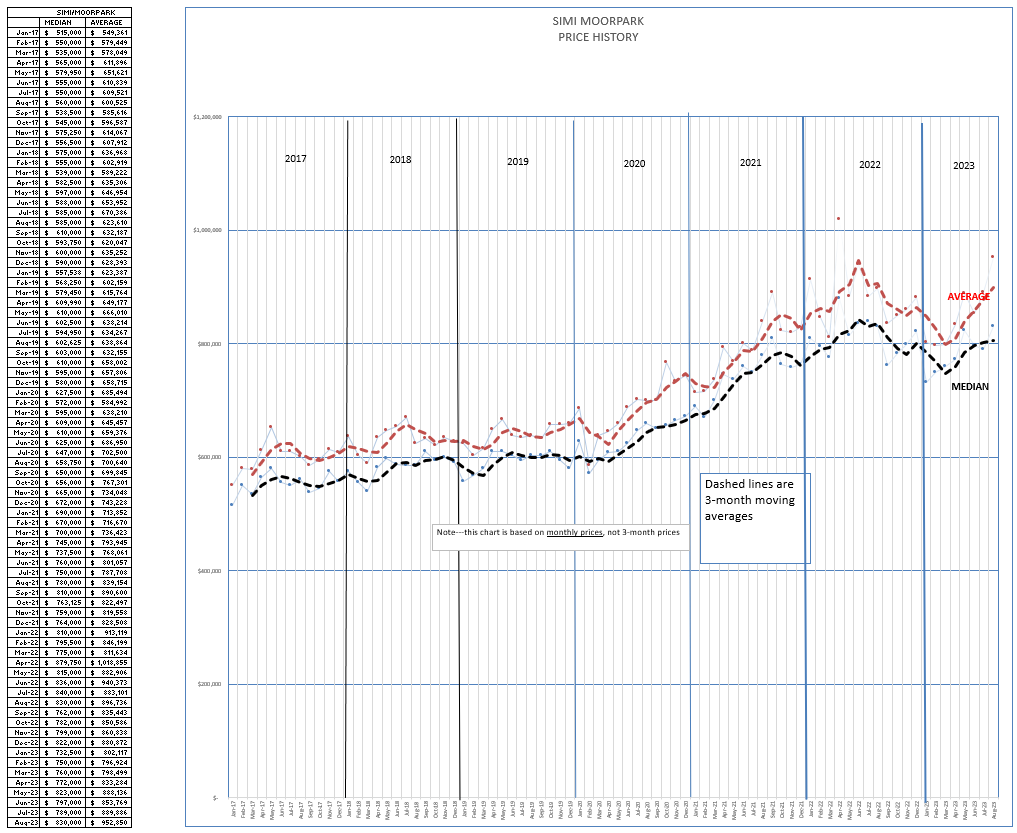
Next, let’s look at how prices are doing in this type of market, with low inventory and low number of transactions. Prices are strong. Again, good news for homeowners, not so good for agents vying for less business.
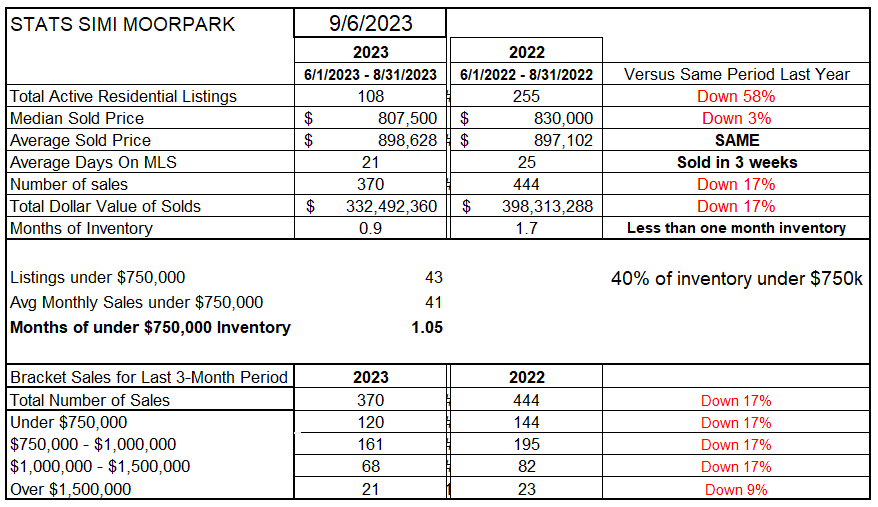
Finally, let’s look at the statistical tables. These are numbers that you can quote to explain the trends in the marketplace.
Compared to last year at this time, inventory is down 25% in the Conejo, down a massive 58% in Simi/Moorpark.
Median prices are about the same as they were at this time last year, a little stronger in the Conejo. As you can see in the price charts above, prices did recede, but have bounced back.
The number of sales is down 26% in the Conejo compared to last year, down 17% in Simi/Moorpark. The reduction in closed escrows is spread evenly among all price categories.
Inventory is low compared to the previous year, yet it represents only about 6 weeks worth of sales. Extremely low by any standards.

Those are the numbers for August. I will get some help from C.A.R. on how these compare across the state, and what the future looks like.
In the meantime, be careful out there. The current covid strain seems to be less deadly, but it also appears to be much more transmissible.
You may want to dust off those masks.
Chuck