My quick answer is no. Prices have strengthened due to low inventory. But low inventory is no match for the FED.
Economics forces balance over time, but not immediately. As the FED continues to try to create a recession, that has to eventually have a negative effect on home sales and prices. So far, it has not. But I believe it is about to happen.
Home sales will never go to zero. There are many reasons homeowners buy and sell. Births in a family require more room, deaths in a family require the conversion of an asset to an inheritance. As the children get older, it pushes parents to increase home size. The youngsters mature and move out, which induces families to downsize. Job moves often require housing changes. Divorces usually require a splitting of assets, with the home being sold. While all these forces influence the supply and demand of the housing market, an overriding factor in our market is interest rates, specifically mortgage rates. The segment of homeowners selling their homes to buy another is beginning to disappear.
Many current homeowners are reluctant to list and buy a replacement home because they have 3% mortgages, and would have to re-borrow at rates now in the 7-8% range. They may love their homes, but they adore their mortgage rates.
In California, 65% of families used to own their homes, 35% were renters. Now those figures are getting closer to 50/50. Legislation, particularly in California, has favored renters. The strong price increases experienced during COVID were a temporary boost. This year, Realtors experienced a 25–30% decrease in closed escrow volume. The average number of homes sold in California for the past few years was about 400,000. This year, it will be under 300,000. Thus far, homeowners have enjoyed continued increases in their home value. But that cannot last forever.
Somebody has to say it, no matter how unpopular it may be. Home prices are headed down. I believe the trend has already begun.
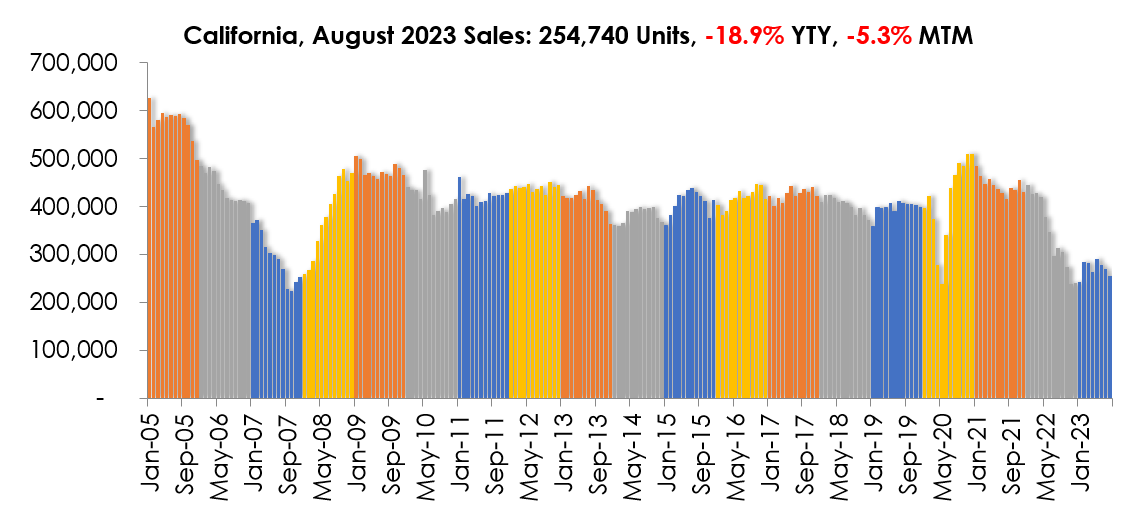
Why? Mortgage interest rates. The FED is trying to extinguish high inflation by raising rates. The following chart is from C.A.R.
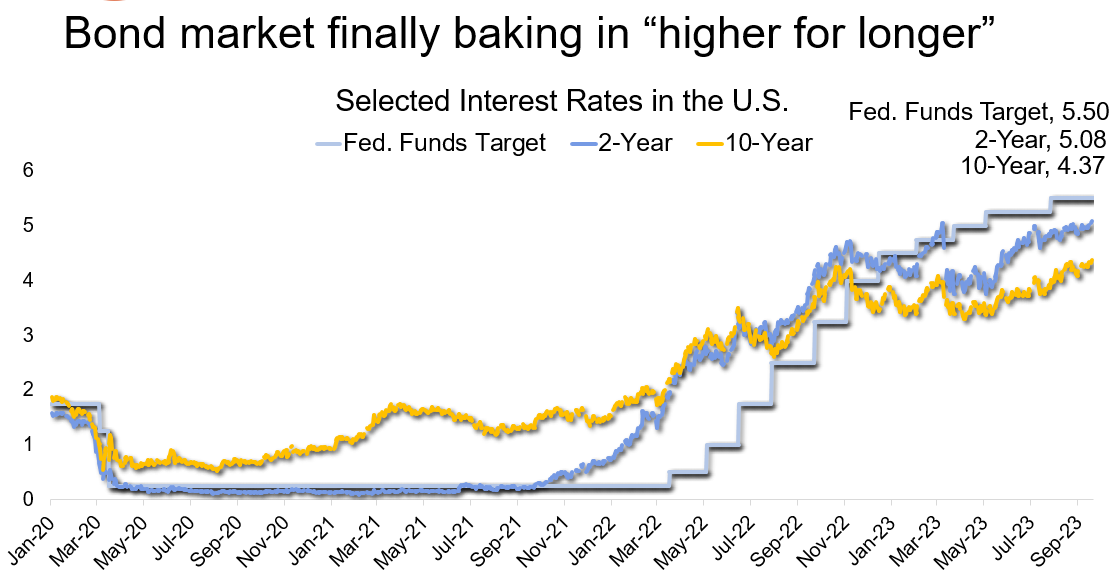
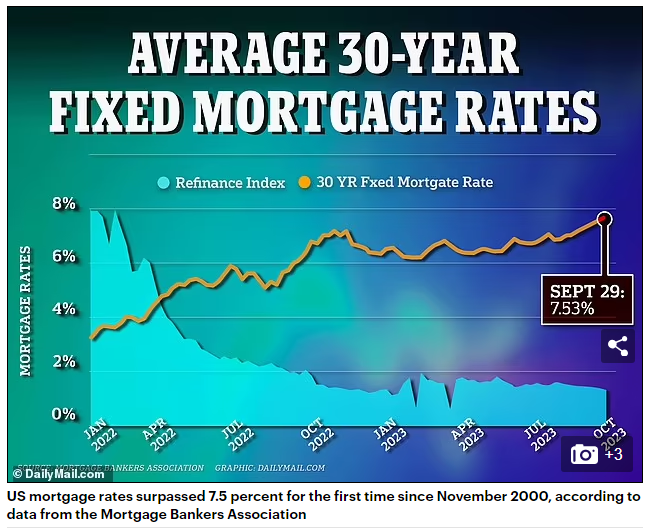
The FED started increasing rates in May 2022. How is that reflected in the home pricing charts? At first, prices decreased. Then, due to low, low inventories, they began to recover in May 2023. Why? There was talk that rates would decline by year end. Unfortunately, as explained in the title of the above chart, FED rates are now forecast to be “HIGHER FOR LONGER”. What has the FED action done to mortgage rates?
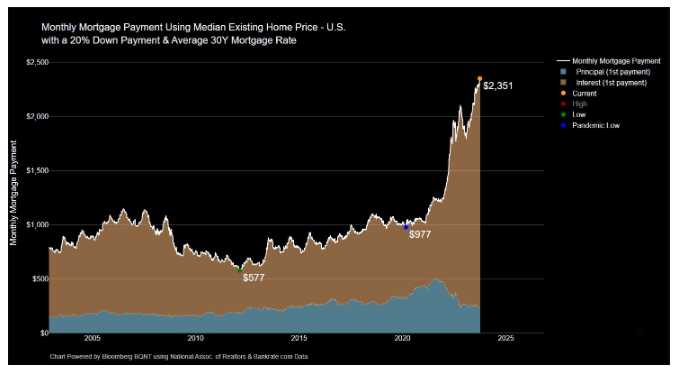
How has that changed the calculus of buying a home? The chart below is courtesy of N.A.R. It computes payment based on a combination of rising home prices and rising interest rates for the average of all U.S. homes. Yes, buying a home has gotten much more expensive.
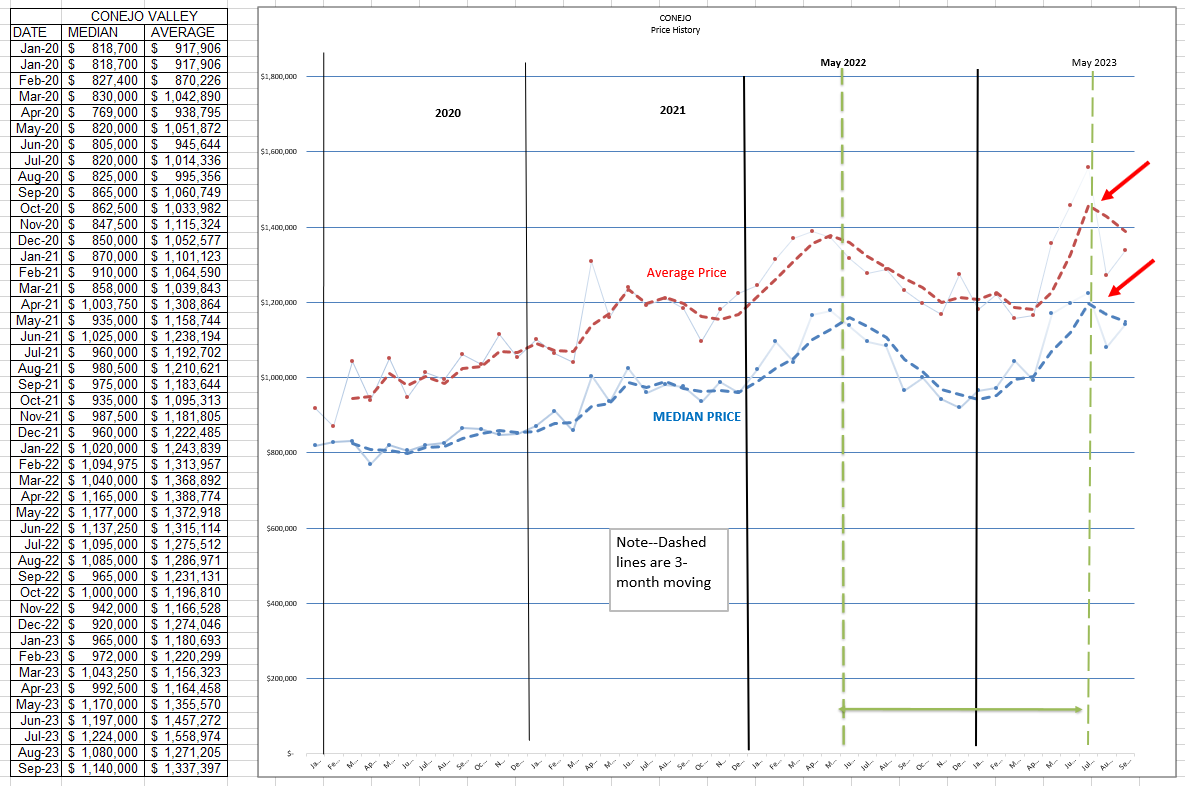
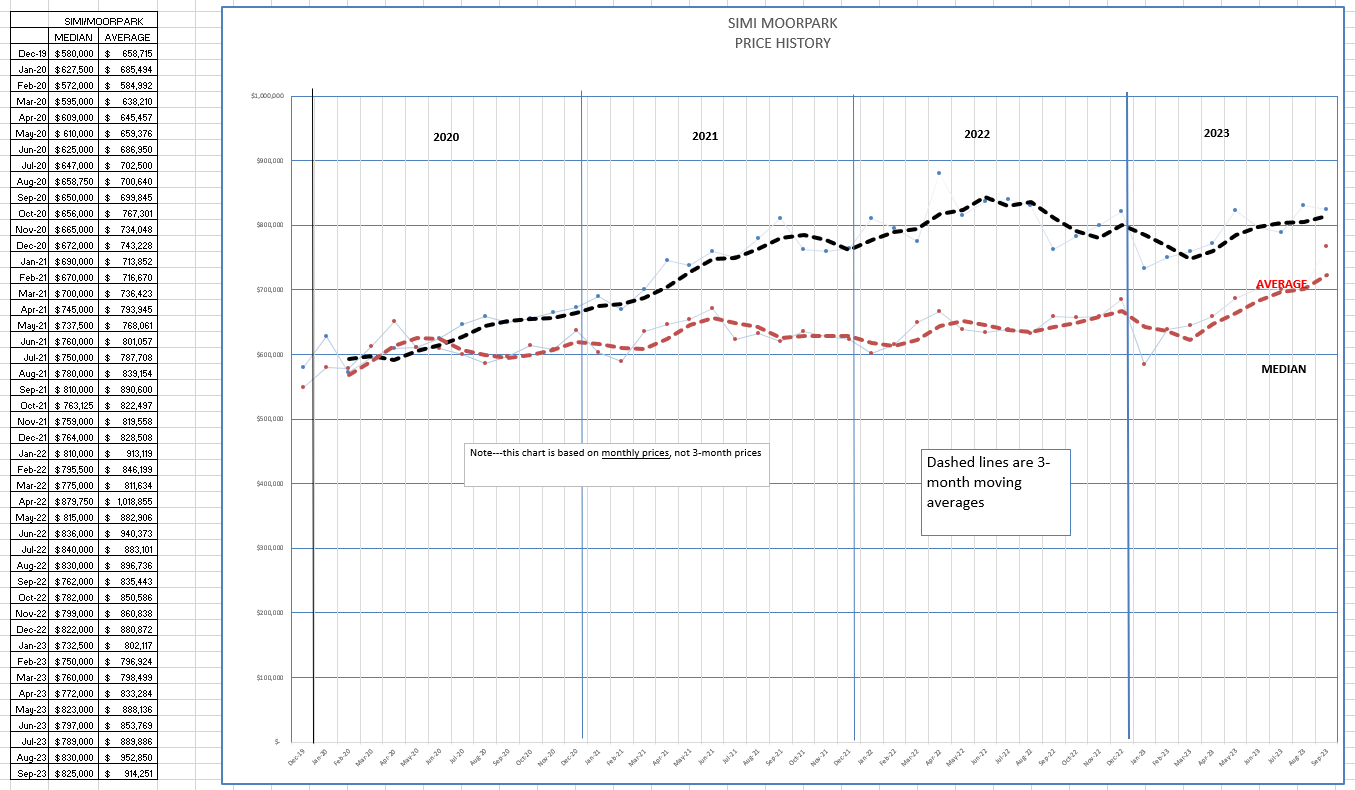
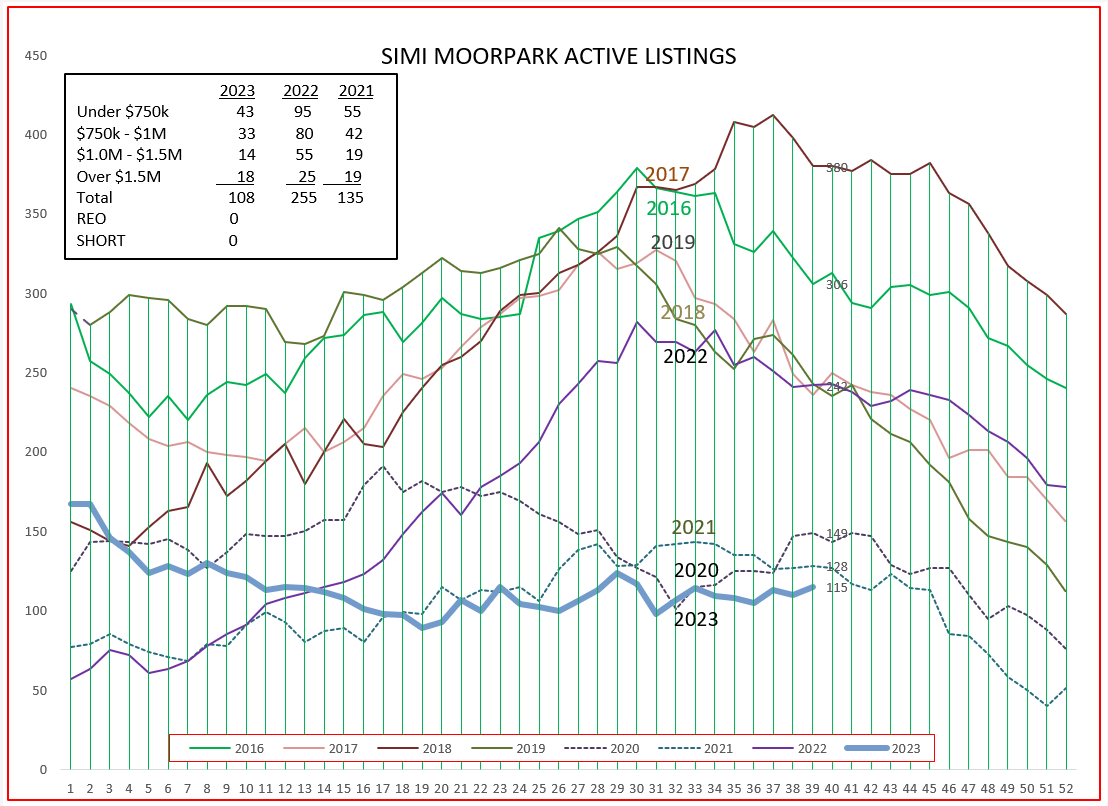
I have refocused the price chart below to reflect only the four prior years. It matches the time frame in the above chart. You can see the history that began in 2020, the year COVID began. To help understand our most recent price history, I have included two vertical green dashed lines. These lines represent the change in the market as the FED increased rates, beginning in May 2022. Prices initially declined, but inventory was restricted because the number of homeowners who may have normally listed their homes dropped, as did the number of buyers. There was talk that rates would return to normal by the end of the year. Buy now, refinance later. Even though mortgage rates continued to rise, properties were snapped up at higher prices. But the far right of the chart shows a significant drop in prices. Notice the red arrows. We hit the tipping point. Prices are moving downward.
Simi/Moorpark does not yet appear to have hit that tipping point. Simi /Moorpark does not have the full range of home prices that Conejo Valley enjoys. This leads me to believe the price changes are initially being felt in the higher price ranges.
There are many automatic valuation models in use. I have subscribed to many for my home. This month’s prices for my home came in at $1,210,000 (Zillow), $1,112,000 (Homebot), $1,443,000 (Redfin), and $1,443,100 (Realtor.com) . An exact match to my home, two doors away, sold last month for $1,500.000. Computer valuations may not be particularly accurate.
Last week’s article in the STAR stated the median home price in Ventura County was up 7% from the previous month. The information source was Realtor.com ,and was for LIST prices. It also stated the median home listing price in Ventura County was up 24.2% from September 2022. That information could confuse many buyers and sellers. Listing prices a year ago were most likely garnering offers over list, whereas listing prices today are most likely being discounted. Listing prices are not a particularly good way of judging value. Sorry, STAR.
The reason I bring these to light is that there is a lot of confusing information being published, and confused buyers are most likely to present lower offers whereas confused sellers are most likely to list at very high prices.
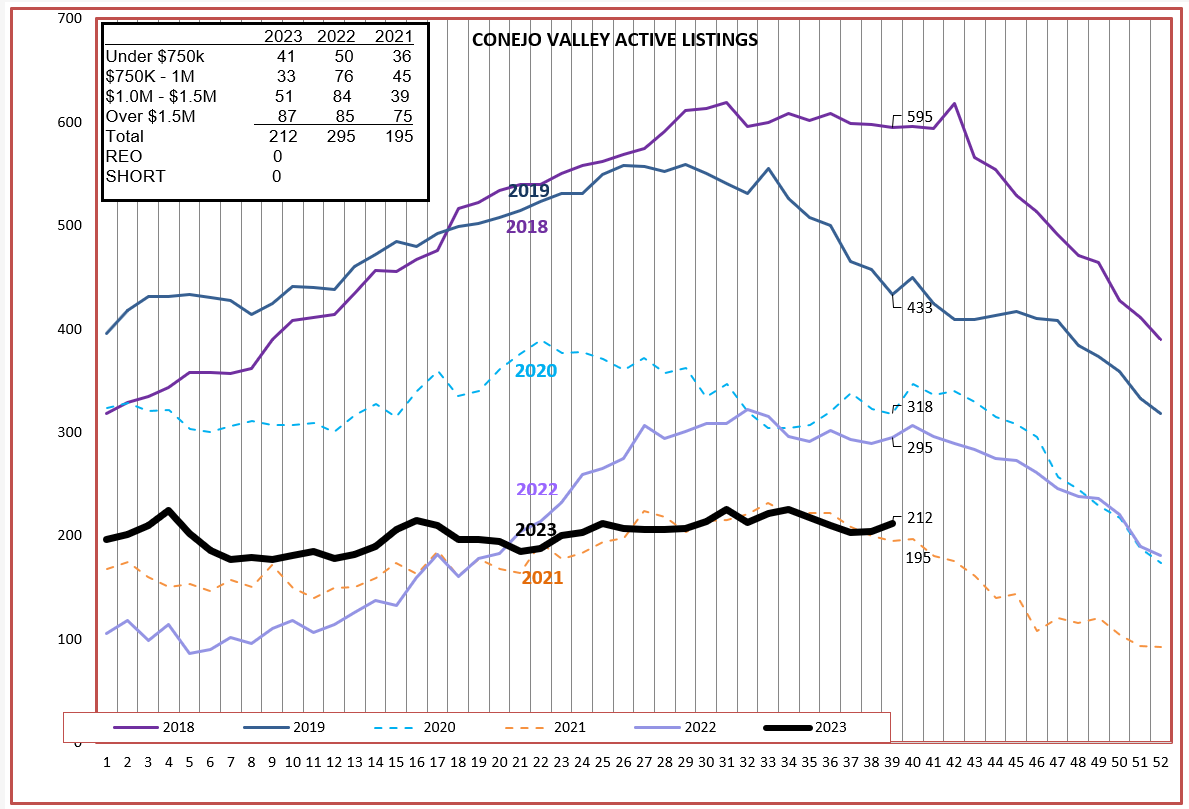
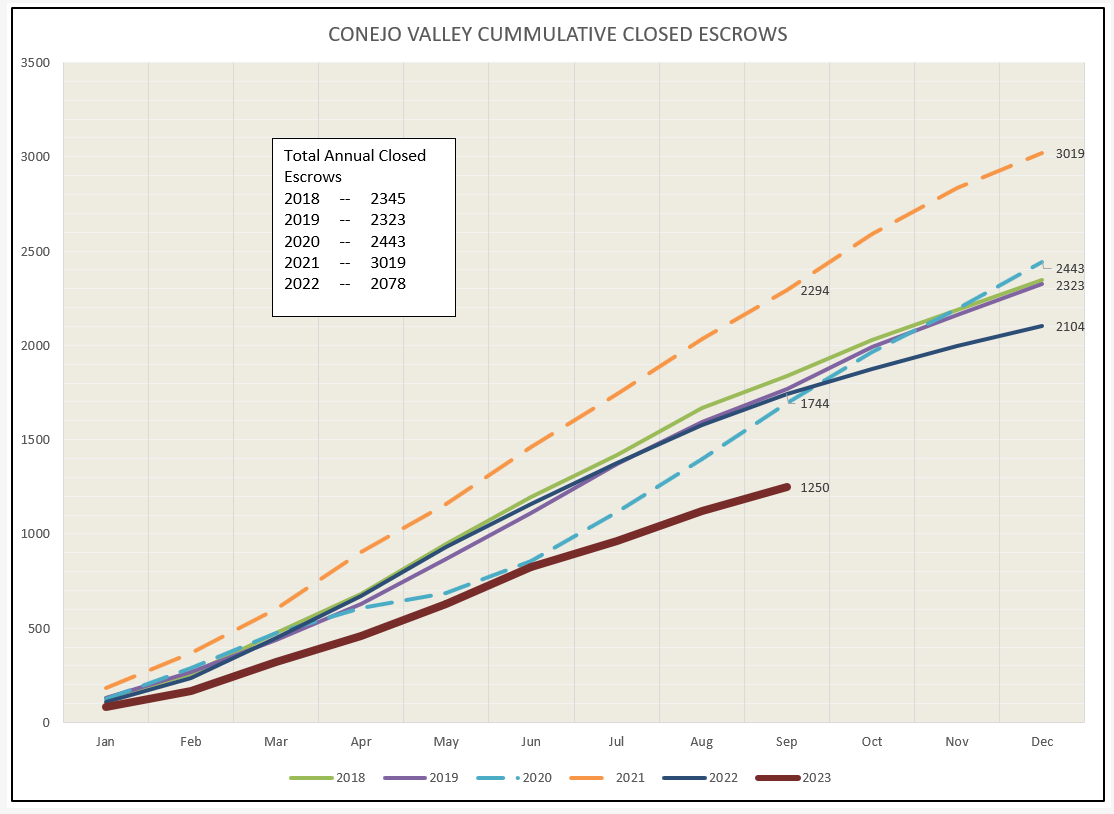
The reality, from our MLS figures, is that prices are in the early process of declining, particularly in the Conejo. This also portends a continued slowdown in the number of sales and the eventual increase in inventory. At least that is what this chart is telling me. (What do you think? I think I am good at recording past history, but not necessarily at foretelling the future.)
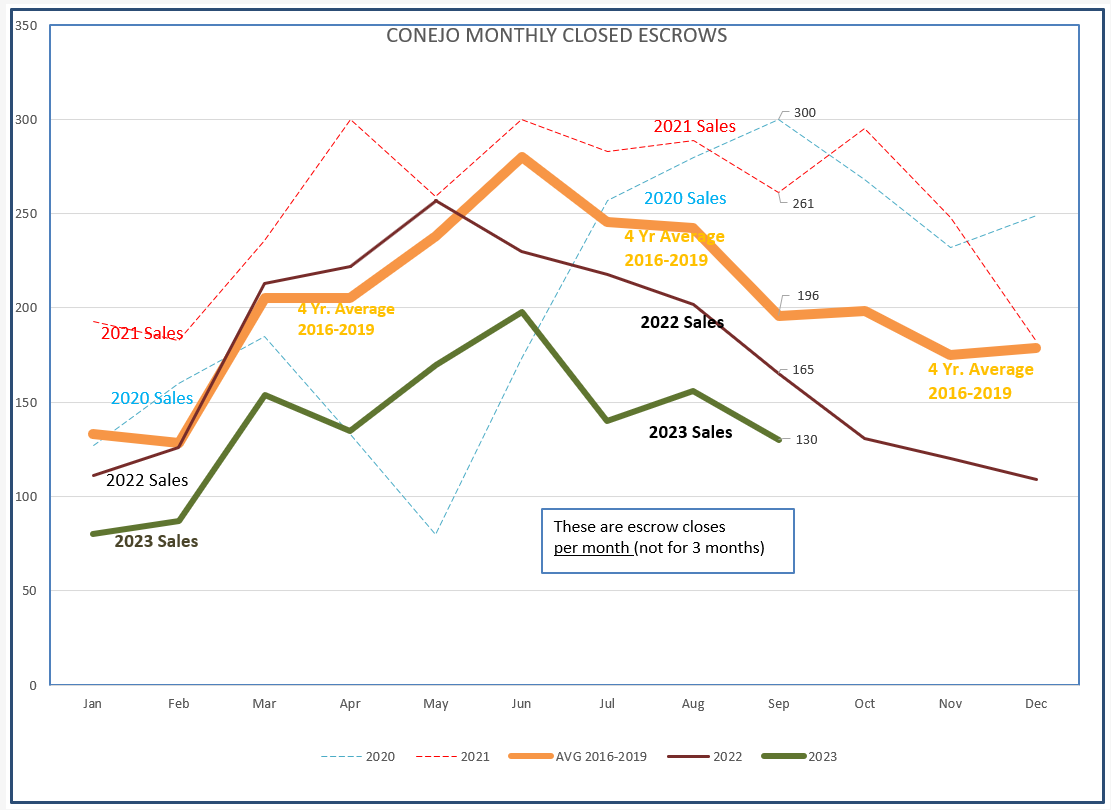
As far as the number of sales taking place, let’s look at the closed escrow charts. Overall, the 2023 heavy Green line appears to be normal in shape, but at a much lower level. September 2023 had 130 sales, versus the 4-year average of 196. (Orange Line)
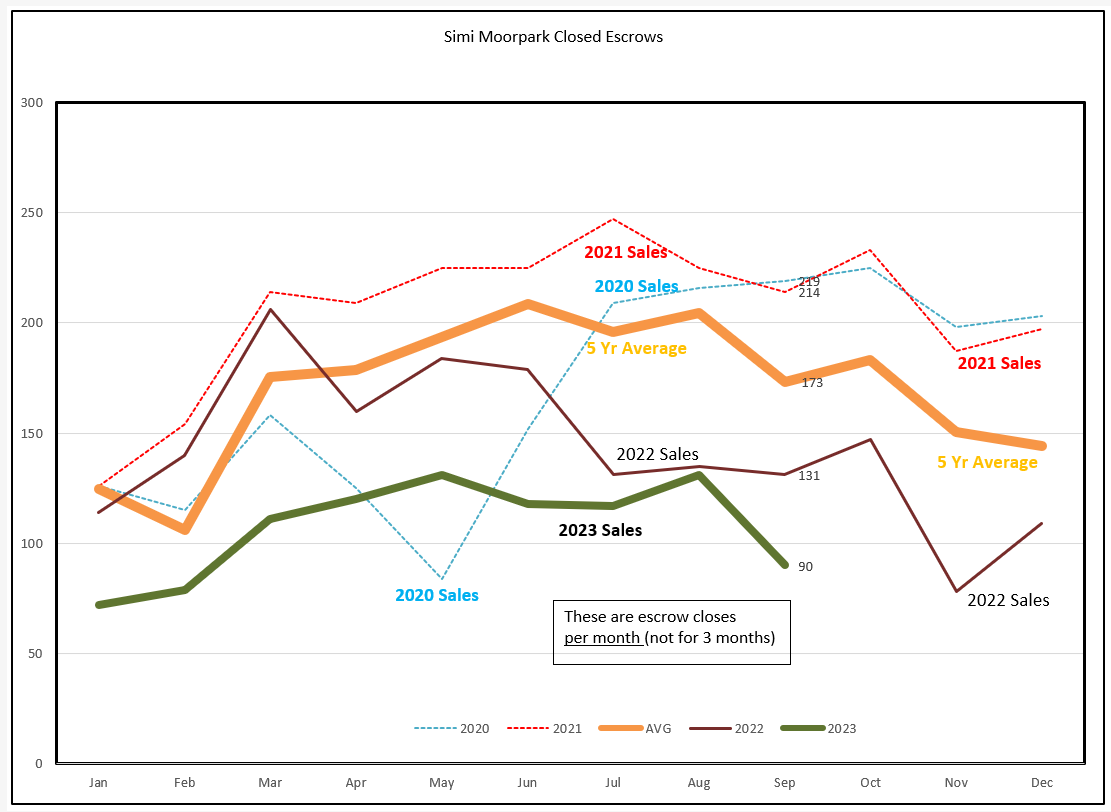
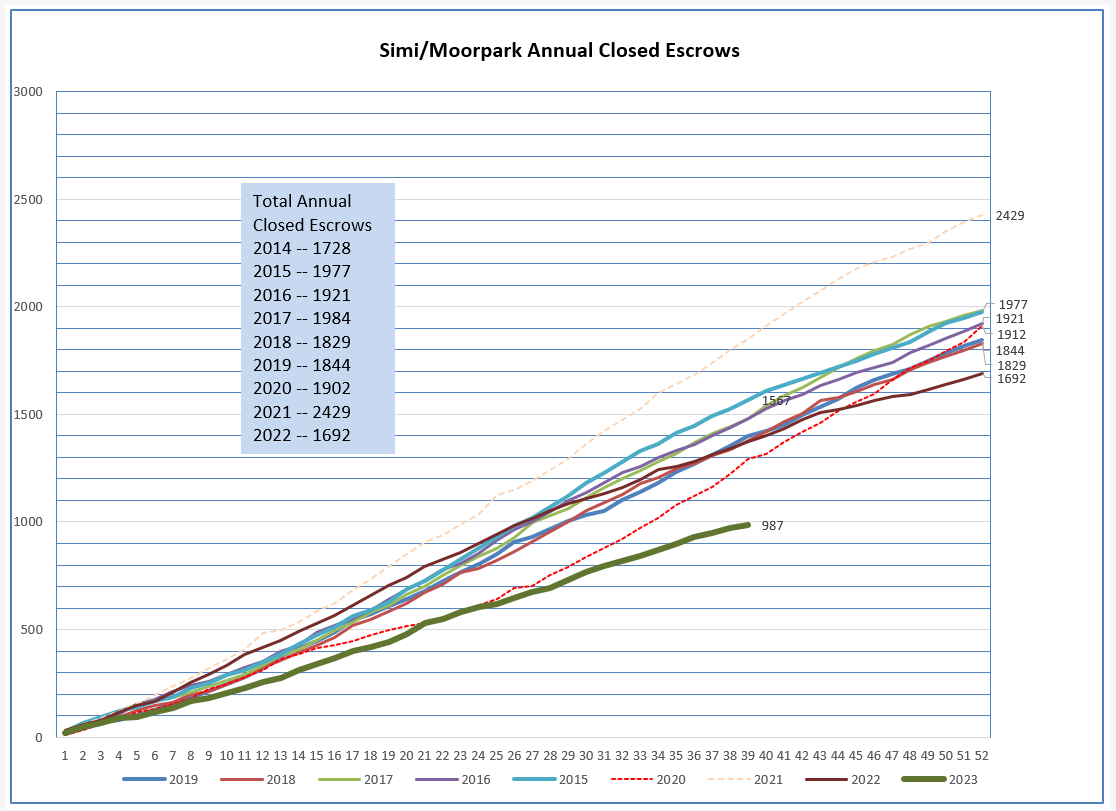
SImi/Moorpark is similar. September had 90 sales, versus the 4-year average of 173.
Inventory remains low, but it is normally in decline at this time of year. My estimate is that as prices have risen, and interest rates have skyrocketed, we will begin to see inventory rise. There is still that portion of sellers who have to sell, but buyers will be priced out of the market, until either prices or interest rates come down. Supply will be steady, but demand will drop. Therefore inventory will rise.
Simi/Moorpark is similar.
The year will end with a much lower number of sales than previous years.
Same for Simi/Moorpark.
Let me import the C.A.R. California Housing Market Forecast, done by my friends Jordan Levine and Oscar Wei. The projection for 2023 closed sales is 266,000, versus 2016-2021 sales of 398,000 to 444,000, dropping to 342,000 in 2022. They are forecasting 327,000 sales for 2024. Still about 25% lower than the average of 2016-2021. I think 2024 will be closer to 2023.
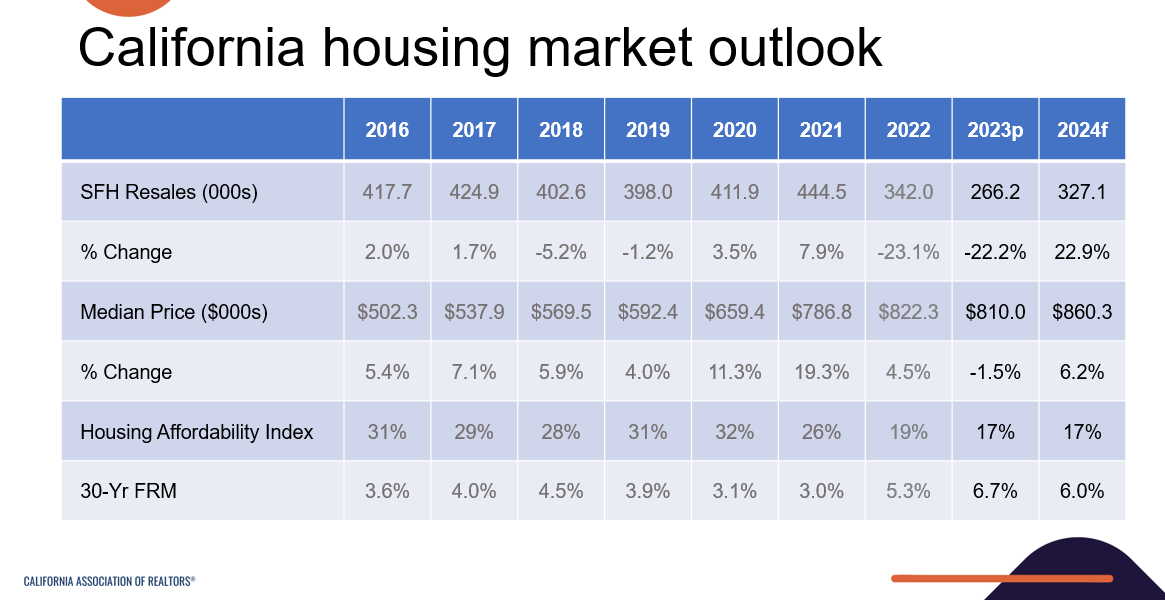
How do their figures look in their graph? Not pretty.
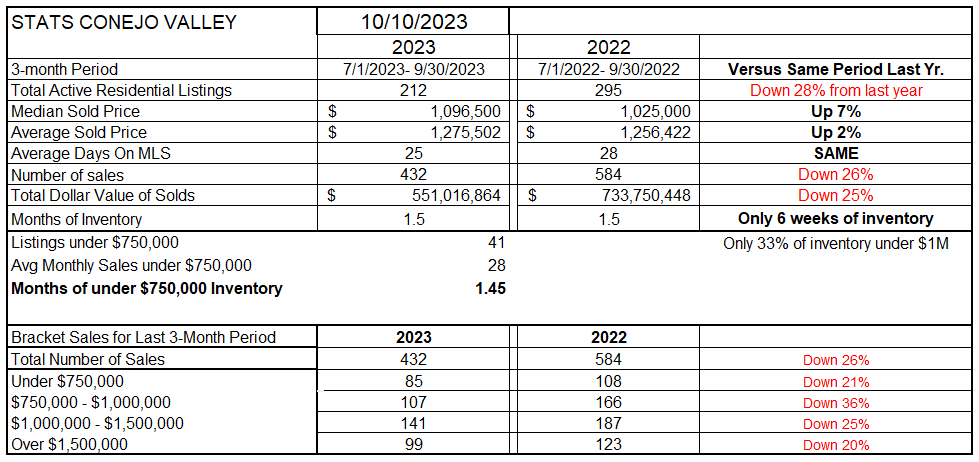
Finally, let’s look my the statistics table. Conejo shows a 7% median price increase from last year, but that does not take into account the drop of the past two months. These figures are a 3-month average. Inventory is down 28%, the number of sales down 26%. Inventory currently represent 6 weeks worth of sales, the same as last year.
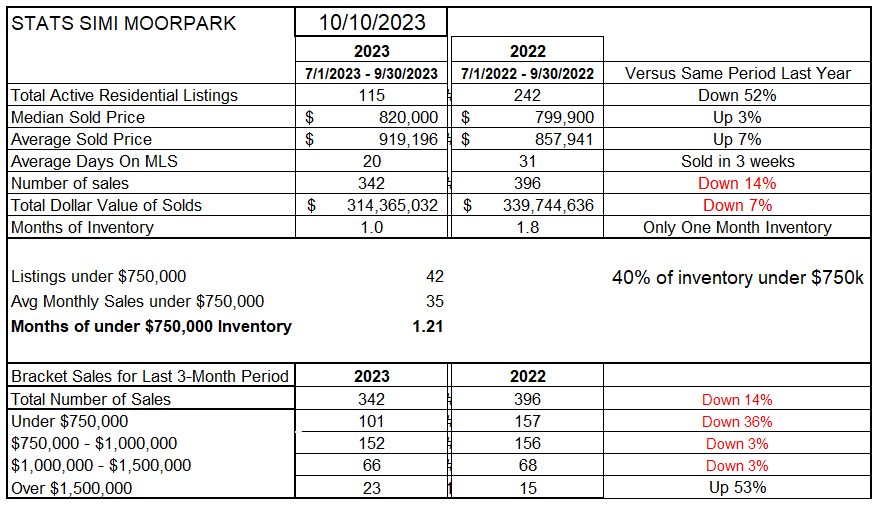
Simi/Moorpark also shows prices up, 3% and 7%. With inventory down 52% from last year, low inventory is still strongly supporting prices.
It is always a stretch to defend what is going to happen. It is more a feeling than a scientific analysis. But that’s what the future is. The unknown.
If I was a professional economist, I would be putting my job on the line here. But I am a closet economist. I share my information, and my analysis, with only a few of you.
Let me know what you think. I am betting on the FED, the all-powerful FED. If they want to slow the economy and bring down inflation, I have a hard time believing they will not be successful. All that money that everyone got from the government during COVID is being spent, along with lots of growth in credit owed. I actually hope I am wrong, but all I can do is tell you what I think.
Let me know what you think.
Chuck