We have been waiting and hoping for the housing market to get back to normal.
To do that we need a lot of elements to come together—confidence in the future, lower interest rates, help with taxes and incentives.
Instead of waiting and hoping, I have begun to ask myself if we have actually reached a level of sales that we should now consider to be normal.
The chart below is from the economists at C.A.R.

This chart exemplifies consistency. Our current level of sales has been consistent for three years.
There are many reasons why people sell or buy homes. Sometimes to buy another home. A new job, a promotion, outgrowing starter homes, moving to a certain school district, financial considerations, neighborhood changes, deferred maintenance, a wedding where both own a home. Unfortunate reasons such as a divorce, and most unfortunately when someone passes away. And the home buying and selling decision is also affected by interest rates, tax consequences, availability, confidence in the future, and the innate stability of not moving. The market never stops completely, but rises and falls based on the composite of these reasons.
There will always be sales, and purchases. But at what level?
In California, we have settled into about 300,000 sales per year, down from 400,000 per year.
Our two areas are both similar and different. Both are affected by the above influences.
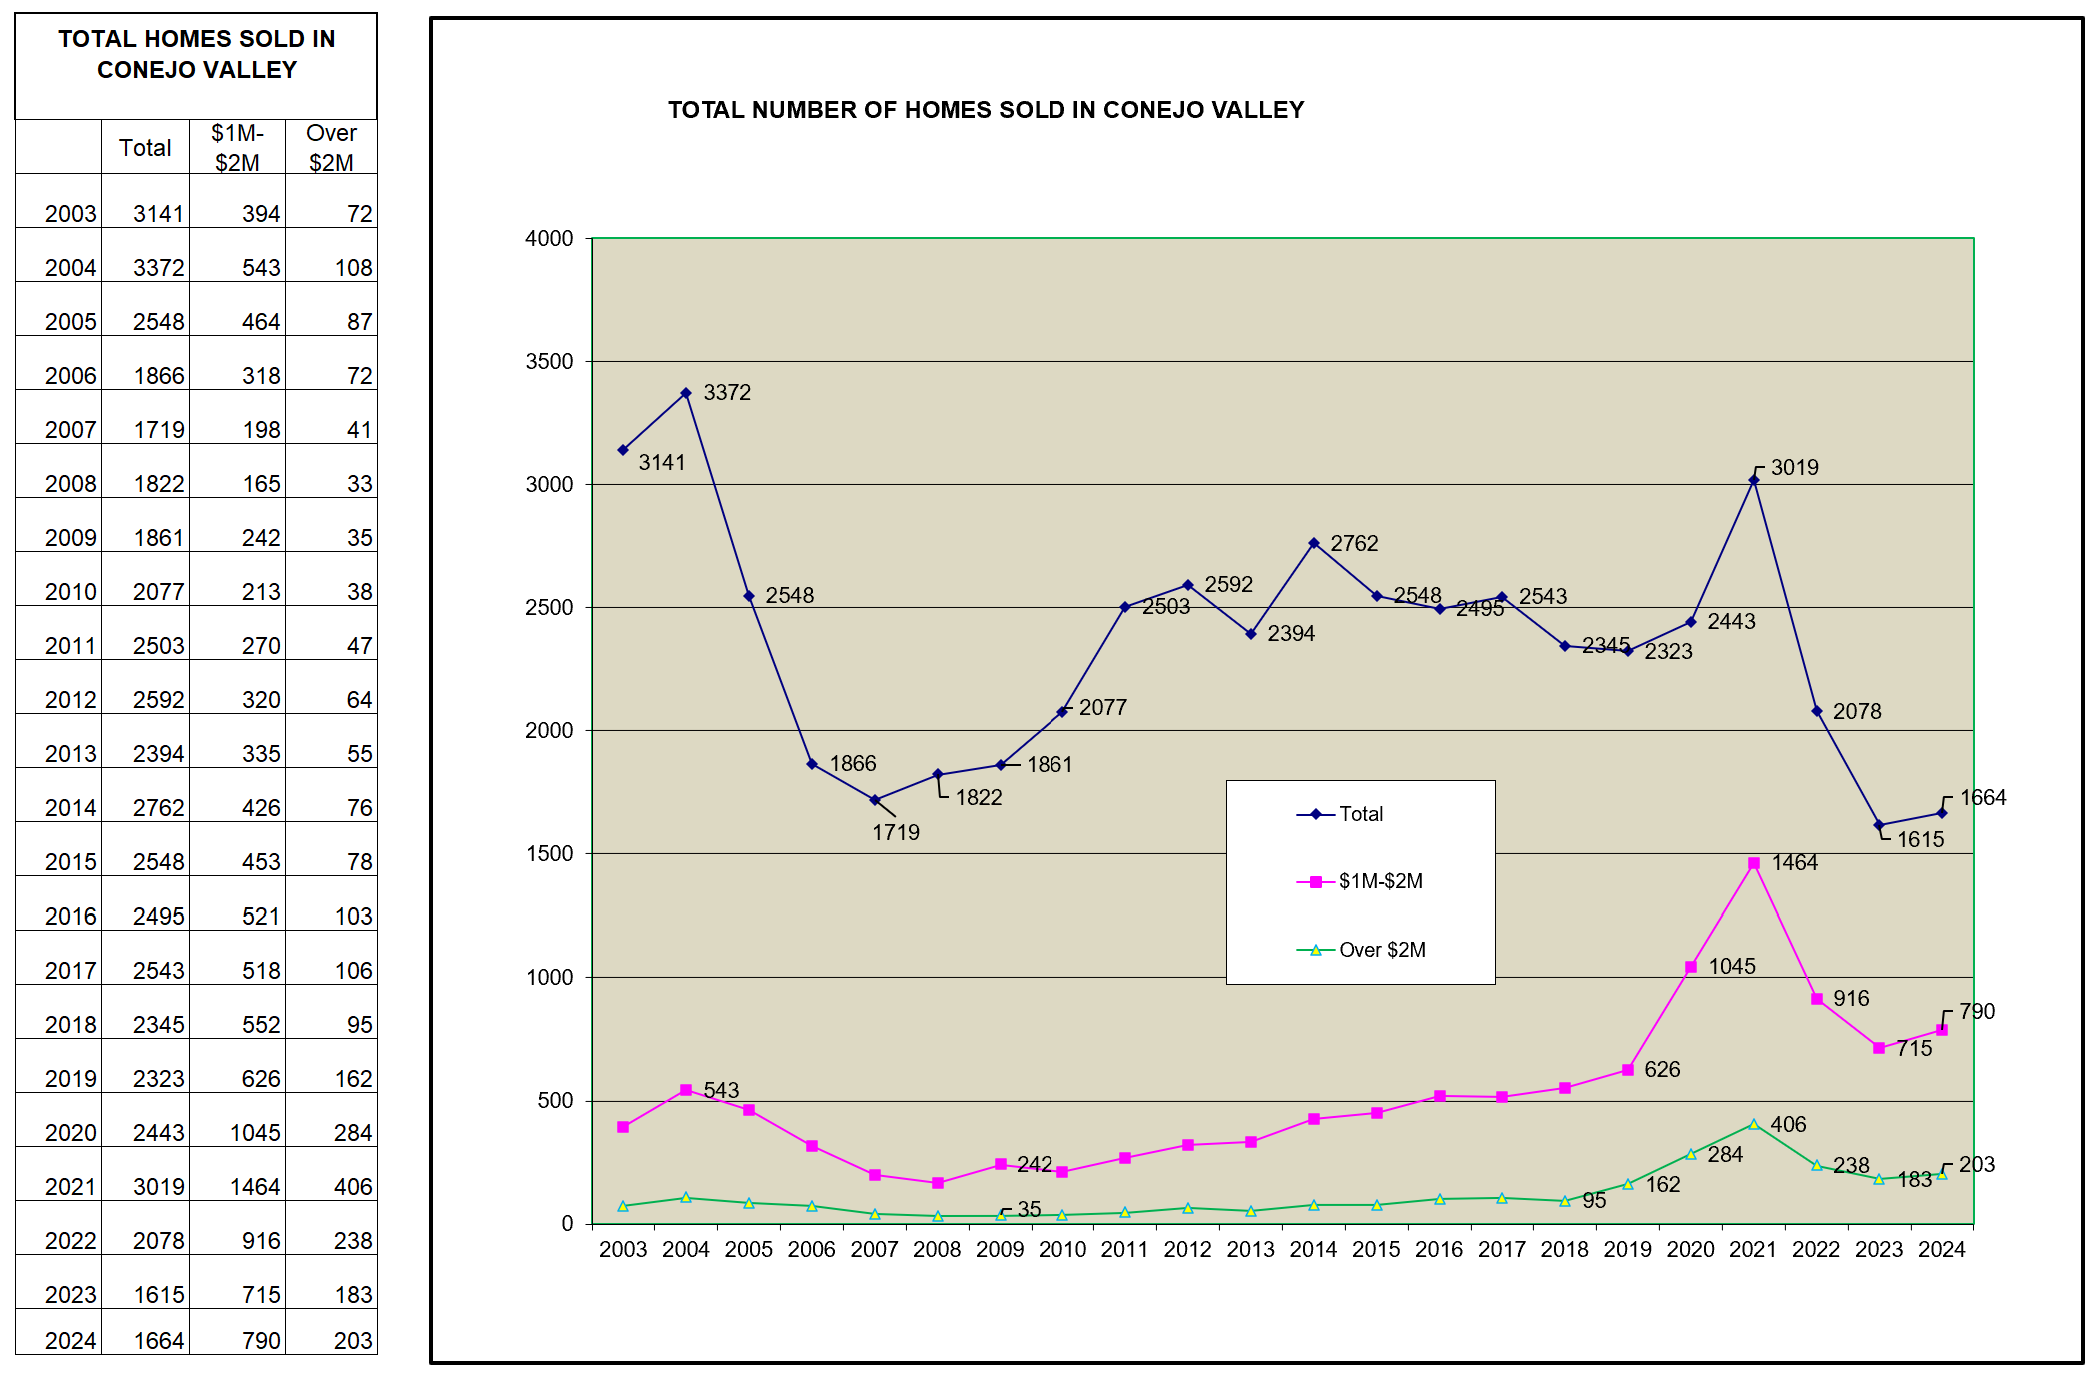
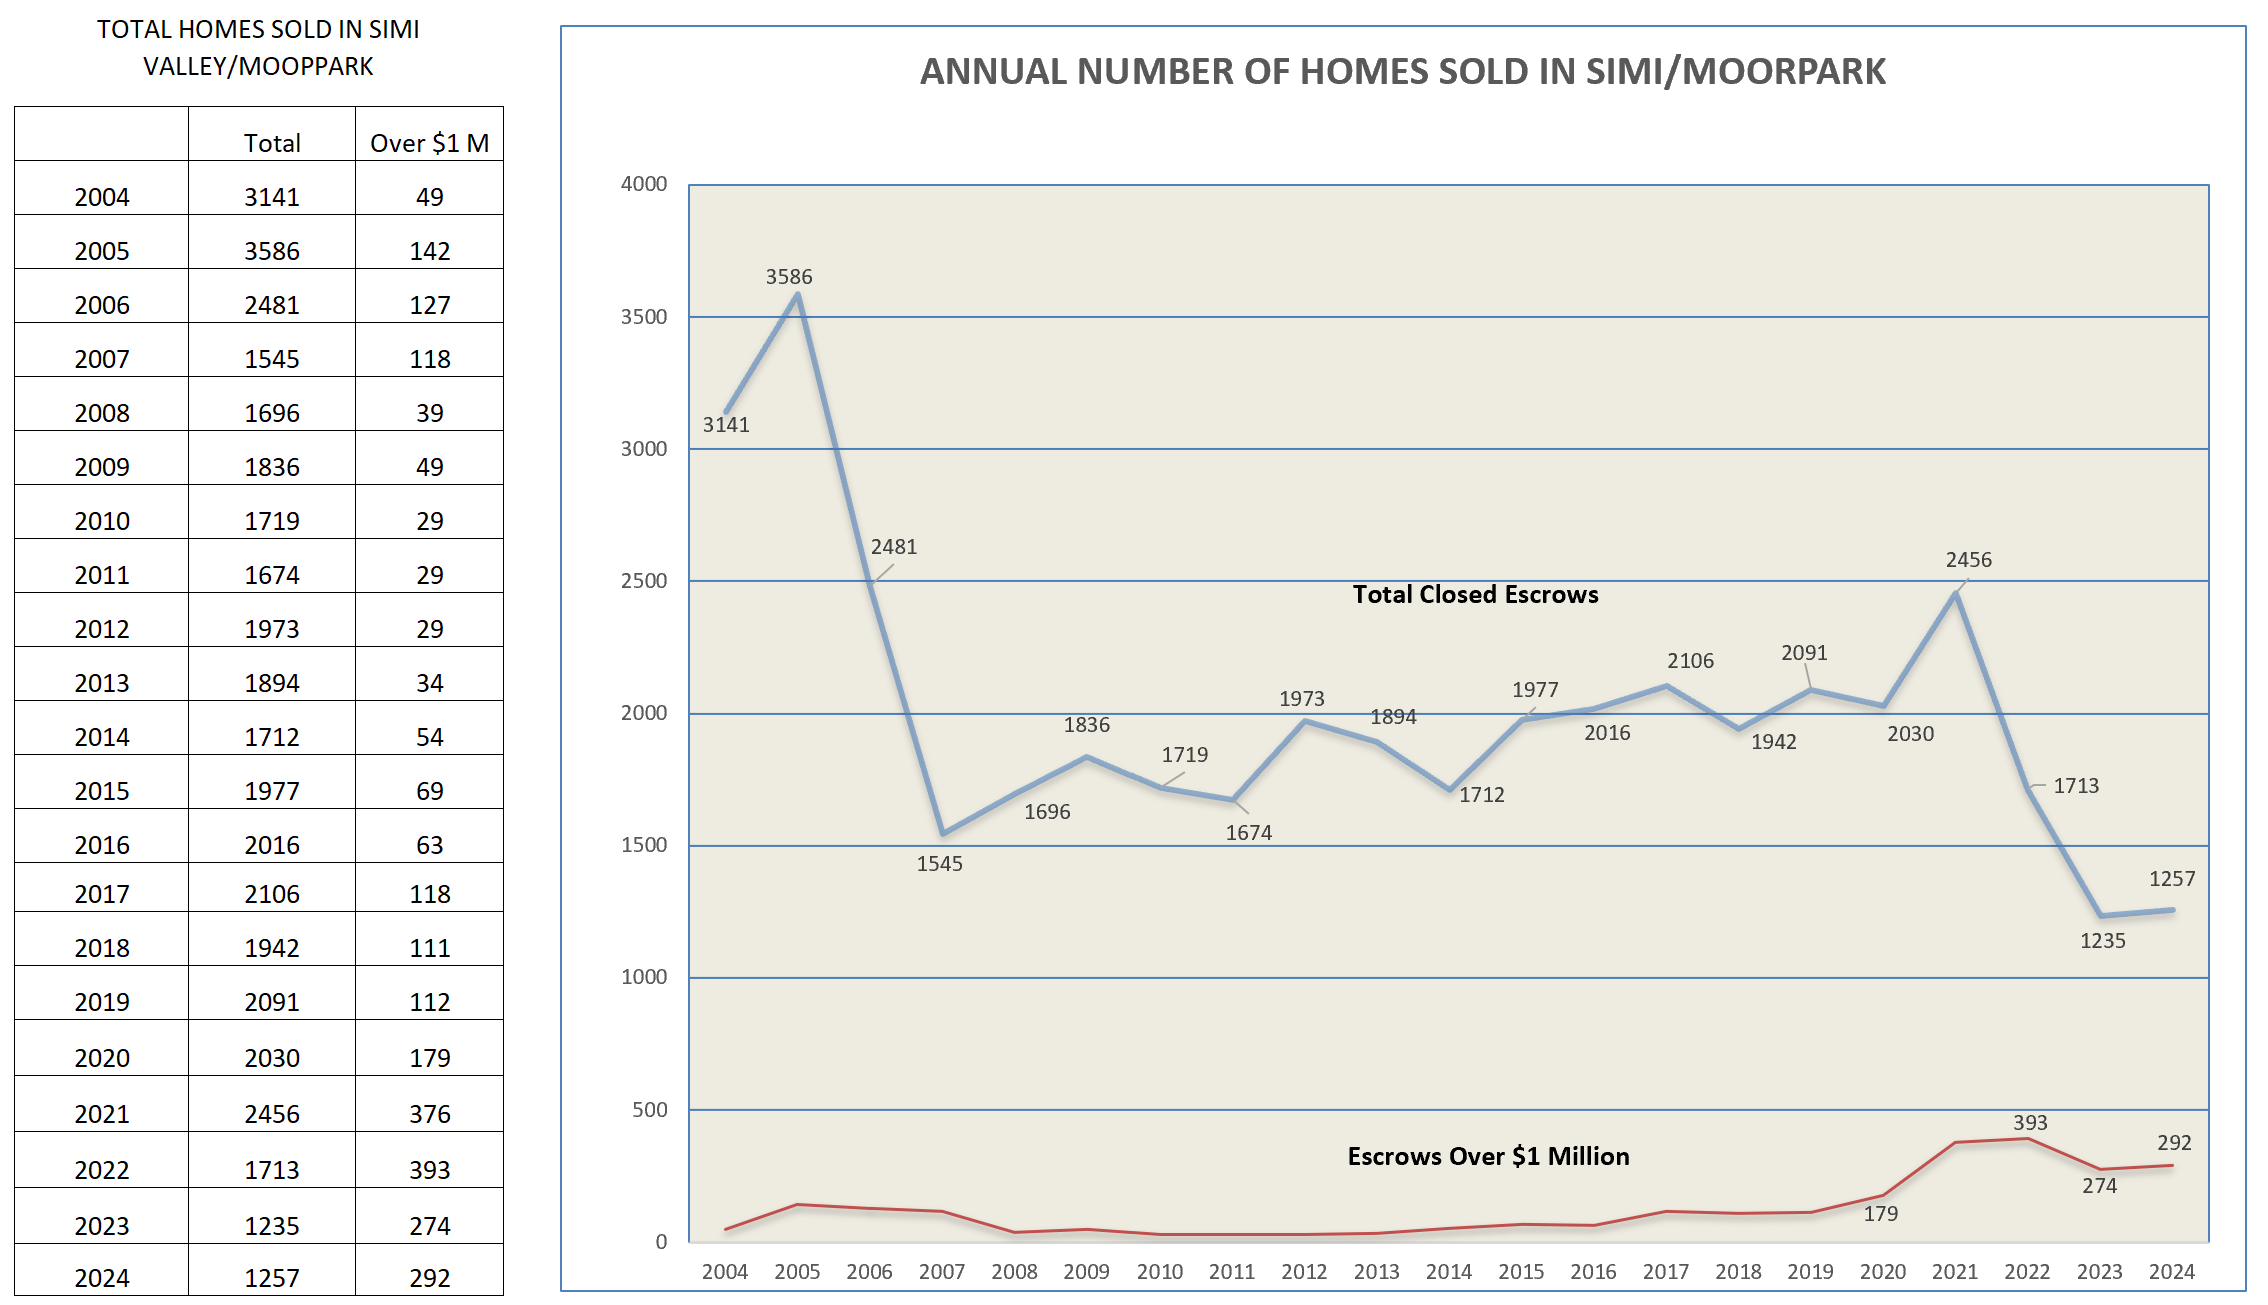
As we have discussed previously, Conejo Valley, with North Ranch and Lake Sherwood ,have a higher number of very high priced homes as compared to Simi Valley and Moorpark. Simi Valley and Moorpark represent a more affordable segment of home prices.
In the Conejo, those very high priced homes are experiencing a strong housing market. Their buyers are not as influenced by interest rates. A high percentage are sold for all cash. Homes sold to buyers requiring mortgages are more limited by high mortgage interest rates, and that market has been weaker.
Let’s see where they share market factors, and where they are different. Conejo inventory is up 68% versus a year ago. The Median sold price is up 2% from a year ago, but the Average price is up 5%. The actual number of sales is up a strong 9% versus last year. Looking at the bottom of this table you can see that sales for this highest category are up a strong 15% from a year ago. Those sales currently represent 33% of all sales in Conejo, and 42% of all listings.

For Simi Valley/Moorpark, the figures tell a little different story. Inventory is up an even stronger73% versus a year ago. The Median sold price is up 4% from a year ago, and the Average price is up 6%. But the number of sales is down 10% versus last year. Looking at the bottom of this table you can see that while sales for the highest category are up a large percentage from last year, the actual number of sales is much smaller, representing only 8% of total sales. The Average Price for Conejo is $1.505 million, versus Simi/Moorpark Average Price of $961,000.

Both inventory charts show strong gains versus past years. The current Conejo inventory compares favorably with the figures from 2018 and 2019.

For Simi/Moorpark, the same can be said.

But inventory is only one part of the picture. How do current 2025 sales compare to sales in 2018 and 2019? That is where the comparison ends. Current sales are about 40% lower than the average sales of 2016 through 2019. So while inventory is available to support higher sales, the higher sales are not happening.

For Simi/Moorpark, the comparison is a little lower, as sales are down 50% from the average sales of 2016-2019.

For the past couple of years, we proposed that the reason for rising home prices was a lack of inventory compared to sales. Low Supply and High Demand. We are no longer in that situation. There is plenty of inventory, and sales are diminished. So let’s see how prices are doing. For 2025, the Median price has basically flatlined at a level of the highest Median level achieved in 2024. The Average line has achieved a higher plateau than happened in 2024, basically increasing the difference between the Median and Average lines, so Conejo Average Pricing is experiencing a bump due to thje quantity of higher priced homes.

For SImi/Moorpark, the price pattern has confused me for quite some time. It did not follow the expected higher in the summer lower in the winter that the Conejo chart experienced. However, the chart does show that the highest price categories are beginning to widen the difference between the Median and Average lines.

Just to emphasize the difference between the two valleys, let’s finish by comparing the Cumulative Sales charts for both valleys. Conejo shows sales growth as the year progresses as slightly improved versus 2023 and 2024.

The chart for Simi/Moorpark shows the difficulty 2025 has in reaching the same levels as 2023 and 2024.

The similarity between the two areas tells me that both market areas have settled in at a significantly lower number of homes sold than we saw in the past. Although I only update the following charts at year end, you can see the growth of the highest end home sales versus the decrease in the level of all homes sold.
For Simi/Moorpark, the same can be said, although the extremely high priced home segment is not as big a factor.
For both areas, the total number of homes sold has settled into a much lower level than experienced in the past. High mortgage rates are the villain, limiting home sales from Want To to Have To. This combination of increased inventory and lower sales will soon influence prices. Remember, completed sales take 30-60 days to report. While we know we are looking at past history, future history is currently residing in escrows.
Buyers recognize market softness more rapidly than sellers. Buyers look at what is going on today by comparing offerings, whereas sellers tend to look at past history and build in a factor for inflation. We have reached a level of three months of inventory compared to current sales. As this figure increases, we will be transitioning from a market of continually increasing prices to one of market stabilization. From a Sellers market to a Buyers market.
At least that is what I think. Please let me know what you think. The best information comes not from history but from conversations with clients currently in the market.
Stay safe out there.
Chuck